Clinical Trial
. 2021 Oct;27(10):1797-1805.
doi: 10.1038/s41591-021-01497-1. Epub 2021 Oct 12.

CAR T cells with dual targeting of CD19 and CD22 in pediatric and young adult patients with relapsed or refractory B cell acute lymphoblastic leukemia: a phase 1 trial

Affiliations
Clinical Trial

CAR T cells with dual targeting of CD19 and CD22 in pediatric and young adult patients with relapsed or refractory B cell acute lymphoblastic leukemia: a phase 1 trial

Shaun Cordoba et al. Nat Med. 2021 Oct.

Abstract

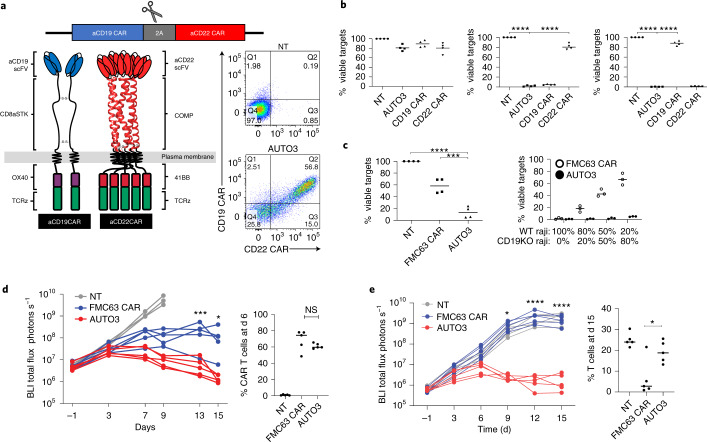
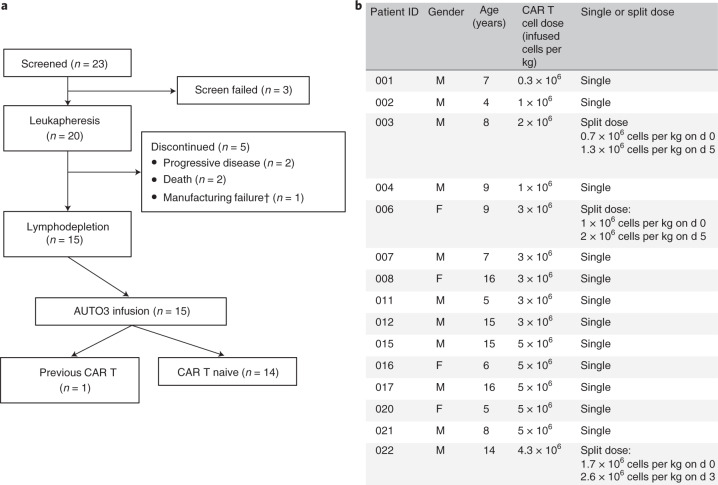
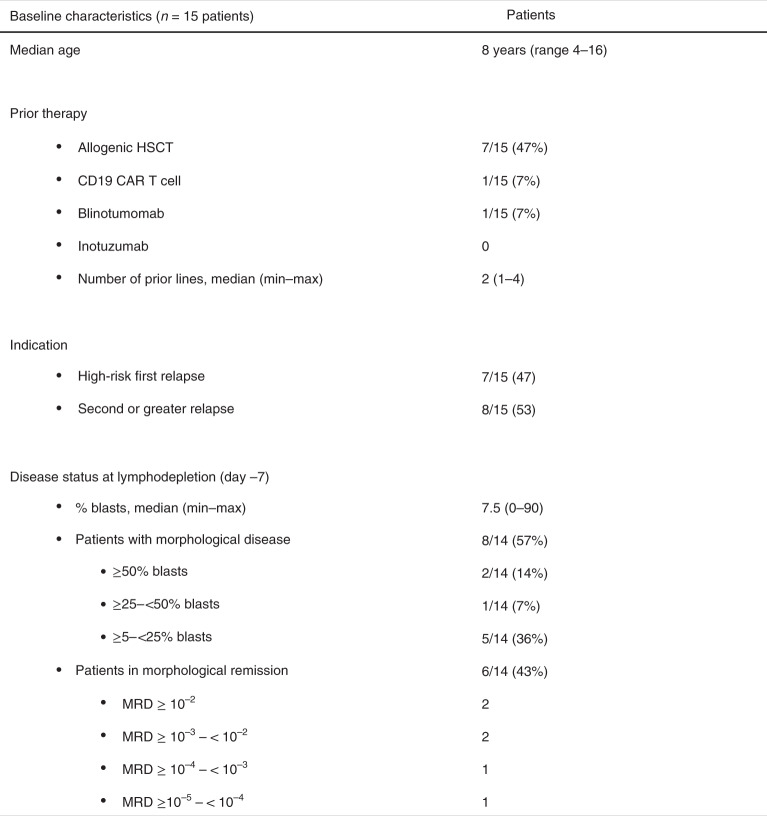
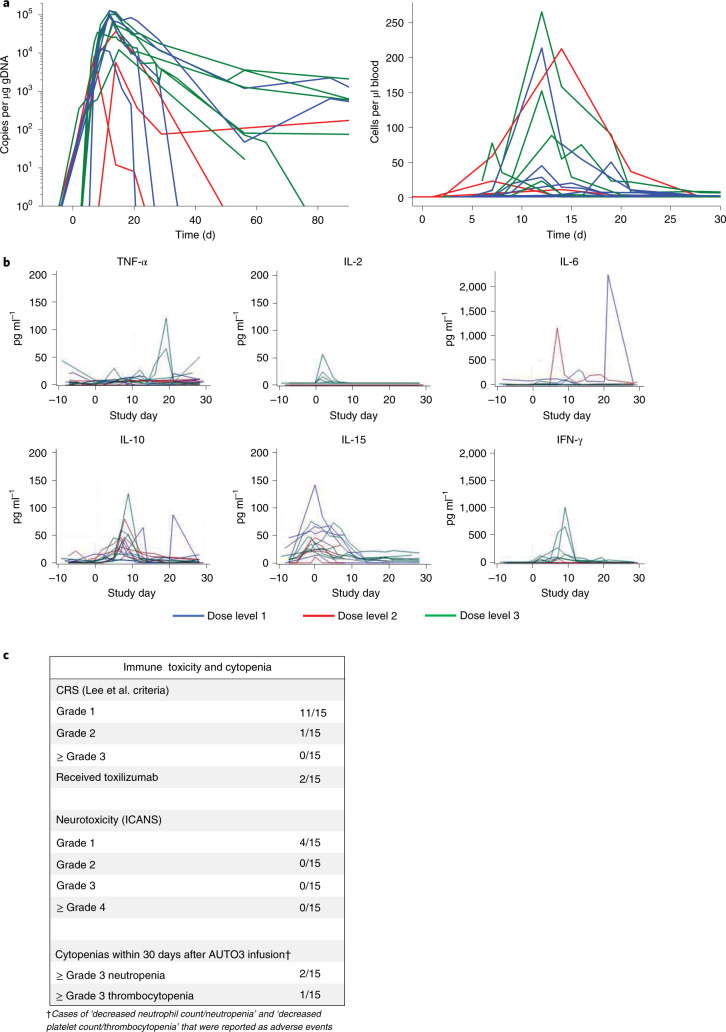
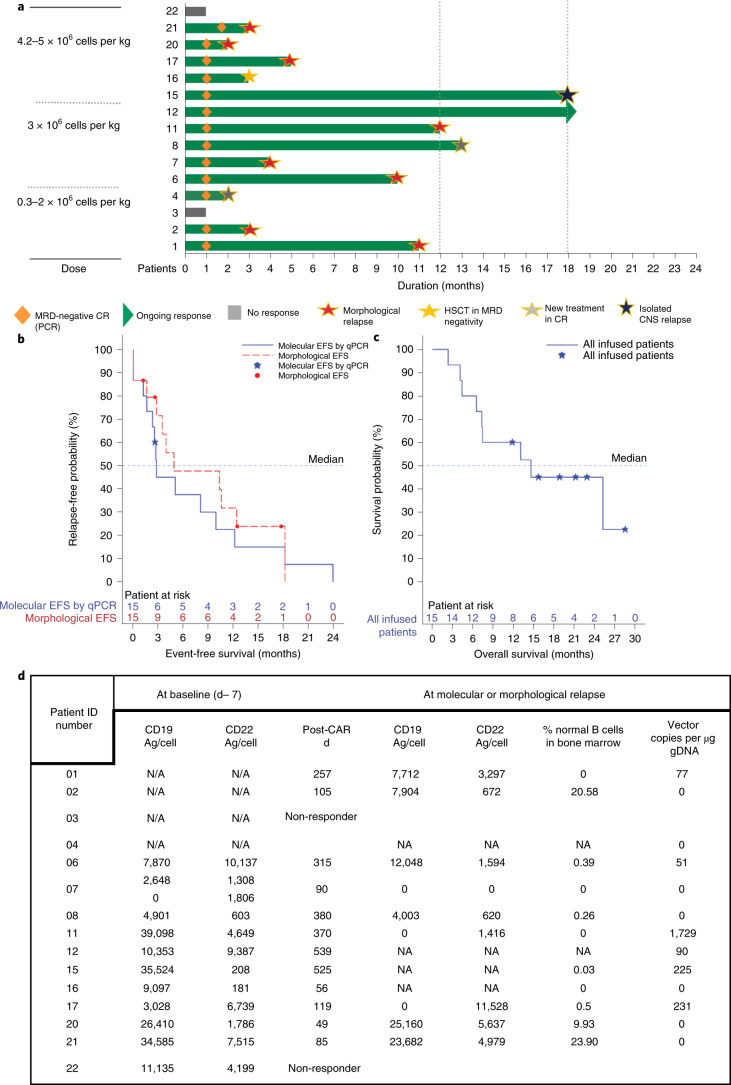
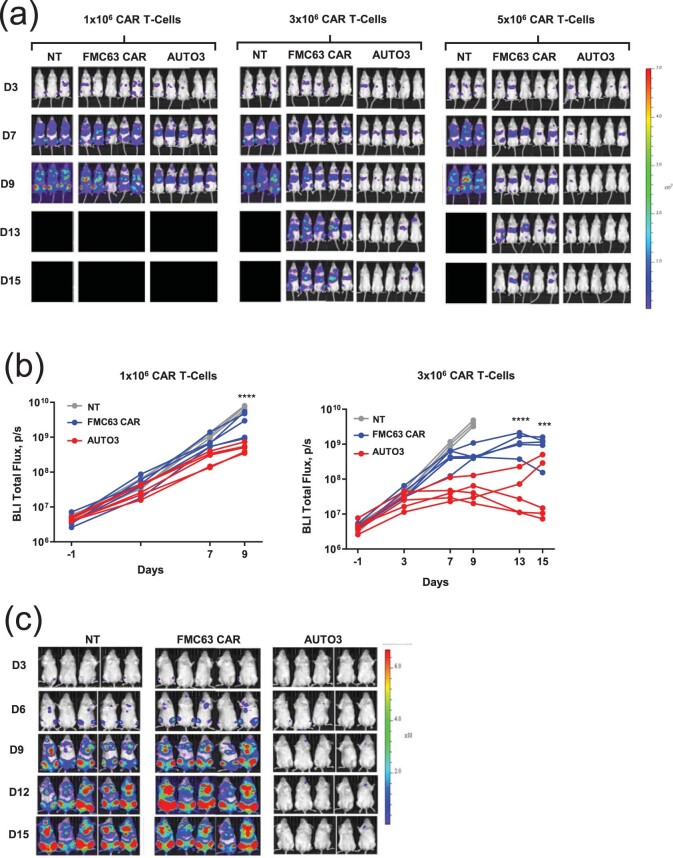
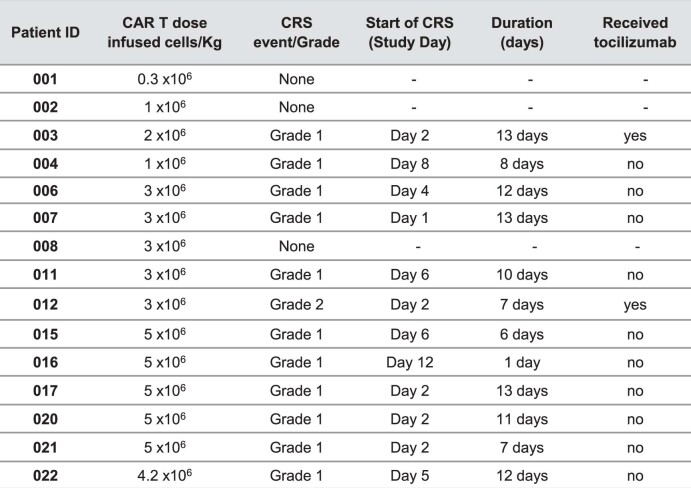
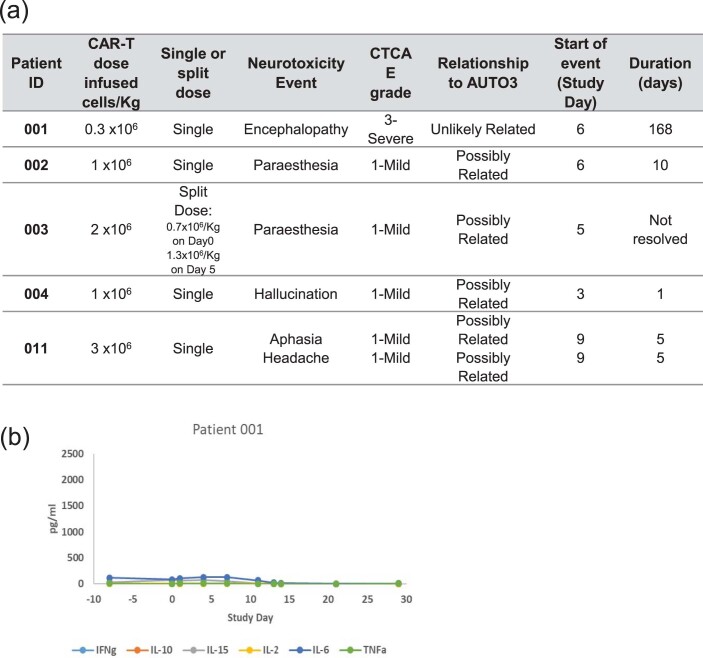
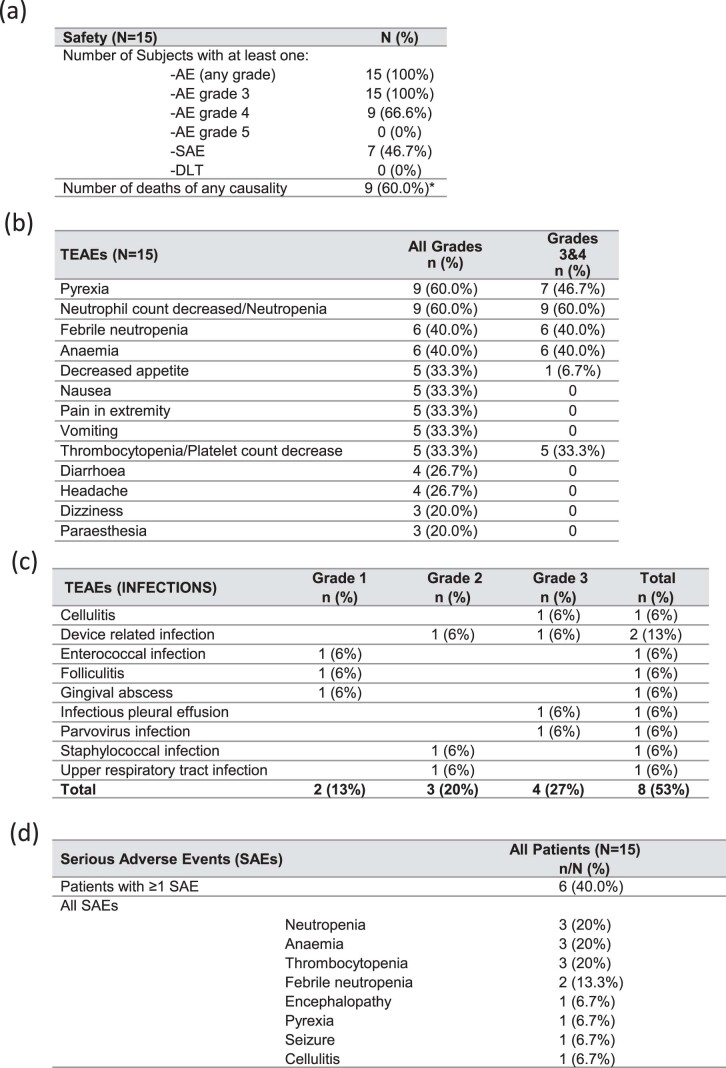
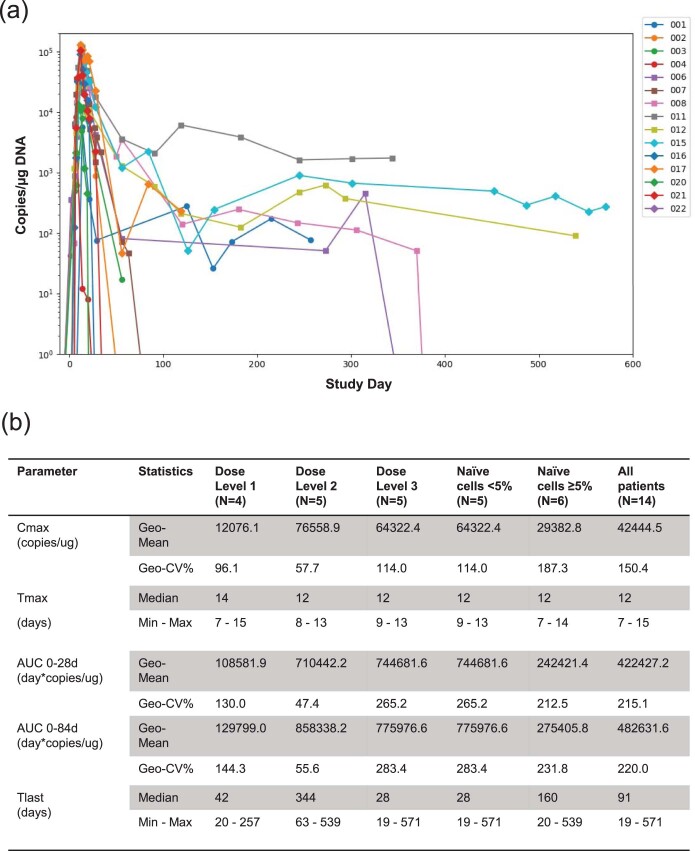
Chimeric antigen receptor (CAR) T cells targeting CD19 or CD22 have shown remarkable activity in B cell acute lymphoblastic leukemia (B-ALL). The major cause of treatment failure is antigen downregulation or loss. Dual antigen targeting could potentially prevent this, but the clinical safety and efficacy of CAR T cells targeting both CD19 and CD22 remain unclear. We conducted a phase 1 trial in pediatric and young adult patients with relapsed or refractory B-ALL (n = 15) to test AUTO3, autologous transduced T cells expressing both anti-CD19 and anti-CD22 CARs (AMELIA trial, EUDRA CT 2016-004680-39). The primary endpoints were the incidence of grade 3-5 toxicity in the dose-limiting toxicity period and the frequency of dose-limiting toxicities. Secondary endpoints included the rate of morphological remission (complete response or complete response with incomplete bone marrow recovery) with minimal residual disease-negative response, as well as the frequency and severity of adverse events, expansion and persistence of AUTO3, duration of B cell aplasia, and overall and event-free survival. The study endpoints were met. AUTO3 showed a favorable safety profile, with no dose-limiting toxicities or cases of AUTO3-related severe cytokine release syndrome or neurotoxicity reported. At 1 month after treatment the remission rate (that is, complete response or complete response with incomplete bone marrow recovery) was 86% (13 of 15 patients). The 1 year overall and event-free survival rates were 60% and 32%, respectively. Relapses were probably due to limited long-term AUTO3 persistence. Strategies to improve CAR T cell persistence are needed to fully realize the potential of dual targeting CAR T cell therapy in B-ALL.


Conflict of interest statement

F.F. has founder shares in Autolus. N.Z.K., V.G.R.P., K.S. and C.P. are shareholders in Autolus PLC. S.C., S.O., S.T., D.S.P., L.C., M.A.-H., M.M.F., V.B., M.F., S.S., R.J., F.A.V., K.D., W.D., Y.Z. and M.P. are shareholders in and employees of Autolus PLC. All other authors have no competing interests.

Figures

Fig. 1
Fig. 1. Pre-clinical validation of AUTO3.
a, AUTO3 is a dual CD19 and CD22 CAR T cell encoded on a single bicistronic γ-retroviral vector under the same promoter. The two CARs are separated by a self-cleaving 2A peptide that allows for equal expression, as shown in the flow cytometry plot. NT, non-transduced. b, Cytotoxicity of T cells co-cultured for 72 h with NT (left), CD19+ (middle) or CD22+ (right) SupT1 targets at a 1:1 effector : target (E:T) ratio. Data were normalized to NT T cells (n = 4 biologically independent samples). c, Comparison of cytotoxicity between AUTO3 and FMC63 CAR against Raji tumor cell lines. (left) Cytotoxicity of AUTO3 and FMC63 CAR T cells co-cultured with Raji for 24 h at a 1:1 E:T ratio (n = 4 biologically independent samples). (right) Cytotoxicity against mixed targets of WT Raji and CD19KO Raji cells at a 1:1 E:T for 72 h (n = 3 biologically independent samples). b,c, Horizontal lines represent the median of data points from healthy individual donors. ****P < 0.0001, ***P = 0.0001, one-way analysis of variance (ANOVA) with Dunnett’s post hoc test for multiple comparisons. d, In vivo efficacy of AUTO3 in a Nalm6 NSG mouse model after treatment with 5 × 106 CAR T cells. BLI, bioluminescent imaging. (left) Total flux radiance of tumor engraftment kinetics 15 d after treatment with CAR T cells (n = 5 FMC63 CAR and AUTO3, n = 3 NT, biologically independent animals). ***P = 0.0006, *P = 0.0437, two-way ANOVA with Bonferroni correction between FMC63 and AUTO3 over all six time points. (right) Percentage of CAR T cells in the bone marrow 6 d after CAR treatment (n = 5 biologically independent animals). Horizontal lines represent the median. P = 0.260 (NS, not significant), unpaired t-test. e, In vivo efficacy of AUTO3 in a CD19KO Nalm6 NSG model after treatment with 5 × 106 CAR T cells. (left) Tumor engraftment kinetics over 15 d (n = 5 biologically independent animals). ****P < 0.0001, *P = 0.0304, two-way ANOVA with Bonferroni correction between FMC63 and AUTO3 over all six time points. (right) CAR T cells in the bone marrow at d 15 (n = 5 biologically independent animals). Horizontal lines represent the median. *P = 0.0216, unpaired t-test.
Fig. 2
Fig. 2. CONSORT diagram and patient CAR T cell dosing.
a,b, CONSORT flow diagram (a) and the total AUTO3 dose and schedule (single versus split dose) for each patient treated with AUTO3 (b). Of the 20 patients who underwent leukapheresis, 15 received AUTO3 because two patients died, two discontinued due to progressive disease before the start of any study treatment and one AUTO3 final product was not released by quality control (classified as manufacturing failure). CAR T cells were infused as a single dose on d 0 for 12 of the 15 patients. Three patients received a dose that was split. For one patient the dose was split between d 0 and d 3. For two patients the dose was split between d 0 and d 5. Target doses of 1 × 106, 3 × 106 and 5 × 106 cells per kg were explored. There were three outliers: patient 001 received a total of 0.3 × 106 cells per kg because after the first dose a serious adverse event (encephalopathy) occurred and prevented him from receiving the second dose of 0.7 × 106 cells per kg; patient 003 was enrolled in the 1 × 106 cells per kg cohort and 2 × 106 cells per kg were manufactured, but the 3 × 106 cells per kg cohort was opened at the time of dosing and he therefore received the full dose available (2 × 106 cells per kg); and patient 022 had a poor leukapheresis product (>70% blasts), and Autolus was able to manufacture 4.3 × 106 cells per kg. F, female; M, male.
Fig. 3
Fig. 3. Baseline characteristics of the patients at enrollment.
The leukemia disease burden was assessed on the day before the start of the lymphodepletion. HSCT, hematopoietic stem cell transplantation.
Fig. 4
Fig. 4. Pharmacodynamics, serum cytokines and adverse events.
a, CAR T cell marking for all patients with evaluable peripheral blood samples. Copies per μg genomic DNA as detected using real-time PCR (left) in the first 90 d after infusion, and marking by flow cytometry (right) using an anti-CD19 CAR anti-idiotype as CAR T cells per μl blood in the first 30 d after infusion. b, Serum cytokines for all patients in the first 30 d after CAR T cell infusion. c, Immune toxicity and reported adverse events of cytopenias within 30 d after AUTO3 infusion.
Fig. 5
Fig. 5. Clinical outcome and relapse phenotypes.
a, Swimmer plot showing responses of individual patients infused with AUTO3, time to MRD negativity by qPCR and duration of response. CR, complete response. b, Kaplan–Meier curves of morphological and molecular event-free survival (EFS) in all patients (n = 15). Morphological EFS, non-response, morphological relapse, or death due to any cause (whichever occurs first); molecular EFS, non-response, morphological relapse, molecular relapse on qPCR (≥10−4) or death due to any cause (whichever occurs first). The blue filled stars and red filled circles represent censored observations. c, Kaplan–Meier curve of overall survival in all patients (n = 15). The blue filled stars represents censored observations. d, CD19 and CD22 expression density on the cell surface of leukemic blasts in bone marrow samples determined by flow cytometry at baseline (defined as d −7, the day before lymphodepletion) and at molecular or morphological relapse. Leukemic blasts were determined based on expression of CD45, CD3, CD19, CD20, CD22, CD10, CD34, CD73 and CD66. CD19 and CD22 density was calculated using antibodies bound per cell as a surrogate for antigens per cell (Ag/cell) using BD Quantibrite phycoerythrin beads as a reference. Blasts with mean fluorescence intensity (MFI) of CD19 or CD22 below twofold the MFI of CD19 or CD22 on T cells or on the samples stained with isotype controls were considered CD19 or CD22 negative. The percentage of normal B cells in the bone marrow samples was measured at the time of molecular or morphological relapse, when there was bone marrow sample available. Vector copy number per μg of genomic DNA in peripheral blood was measured around the time of molecular or morphological relapse, defined as the last time when CAR T cells were detectable on qPCR or the last assessment if zero copies were present. B cell recovery was defined as normal B cells ≥0.1% of the total lymphoid cells analyzed in bone marrow samples. Patient 07 had mixed CD19 CD22+ and CD19+ CD22+ blast populations at baseline; antigen density analysis was performed separately for each population. Patient 15 relapsed with CNS disease and very low levels of bone marrow MRD (10−5 determined by qPCR). NA, data not available.
Extended Data Fig. 1
Extended Data Fig. 1. Biophysical evaluation of the CD19 and CD22 binders.
a) Competition for binding to CD19 between scFv proteins. FMC63 was captured as the ligand and injections of recombinant CD19 followed by FMC63 scFv, HD37 scFv or anti-His tag Ab were used as analyte (i). HD37 did not show interaction with CD19 bound to FMC63, indicating a shared or overlapping epitope. As expected, FMC63 was also unable to bind CD19, while the anti-His recognised a distinct epitope at the C-term of CD19. (ii) Determination of CD22 antibody binding epitope. LT22 was tested against various truncated variants of CD22. Binding was observed upon expression of Ig domain 5 indicating that the antibody targets this region. b) Humanisation of CD19 and CD22 binding domains does not affect binding kinetics in Surface Plasmon Resonance assay. Binding of Murine LT22 mAb (i), Humanised LT22 mAb (ii), Murine LT22 scFv (iii) and HuLT22 scFv (iv) to CD22. Binding of Murine HD37 mAb (v), Humanised HD37 mAb (vi), Murine HD37 scFv (vii) and HuHD37 scFv (viii) to CD19. i-viii) Black = reference subtracted sensograms; Red = sensogram fit with 1:1 Langmuir binding model. (ix) binding kinetic values for murine and humanized anti-CD19 mAb and scFv for CD19. (x) binding kinetic values for murine and humanized anti-CD22 mAb and scFv. c) Antibody humanness T20 score for the VH and Vk sequence of HD37, humanised HD37, LT22, humanised LT22 and FMC63 (i). A score >85 is associated with a human sequence. Humanised HD37 and LT22 binders show improved scores, with values nearing or surpassing the humanness threshold. (ii) Prediction of Human MHC-I affinity (EC50) on HLA allele A*02:01 for scFv-derived peptides (8-14 aa). Red line = mean value of individual datasets. No significant average MHC-I affinity difference was determined for humanised HD37 (P = 0.3799) and LT22 (P = 0.9268) binders compared to their respective parental antibody (unpaired t-test). Significantly lower average MHC-I affinity was determined for both HD37 and LT22 (humanised and parental), compared to FMC63, suggesting reduced immunogenicity. One-way ANOVA (Dunnett post-test) *P = 0.0250 for FMC63 vs. LT22, *P = 0.0322 for FMC63 vs. HuLT22, **P = 0.0040 for FMC63 vs. HD37, **P = 0.0088 for FMC63 vs. HuHD37. Unpaired t test P = 0.9268 for LT22 vs. HuLT22 and P = 0.8150 for HD37 vs. HuHD37.
Extended Data Fig. 2
Extended Data Fig. 2. Comparison of OX40 and 41BB function.
PBMCs transduced to express the anti-CD19 CAR HD37 with either a 41BBz or OX40z endodomain. i) CAR T cells were co-cultured at a 1:1 ratio with either non-transduced SupT1 targets cells (NT) or SupT1 cells transduced to express CD19. After 72 h the remaining targets cells were assessed by flow cytometry. n = 4 biologically independent samples, statistical analysis performed by one-way ANOVA with Dunnett’s post-test comparing the 41BBz CAR to all other conditions. ns = non-significant, P = 0.1078. ii) 1×10⁶ transduced CAR T cells were stimulated with 50ug/ml HD37 idiotype for 24 h before assessing the expression activation markers CD69 and PD1 by flow cytometry. Lines represent the median value, n = 6 biologically independent samples. Statistical analysis performed by one-way ANOVA with Dunnett’s post-test comparing the 41BBz CAR to all other conditions. ns = non-significant, CD69% - P = 0.8009 and PD1% - P = 0.0730. iii) 1×10⁶ transduced CAR T cells were stimulated with 50ug/ml HD37 idiotype for 24 h. RNA was extracted from stimulated CAR T cells and gene profile assessed using the nCounter CAR T cell characterisation panel (Nanostring). The panel of immune persistence genes were analysed via Principal Component Analysis (PCA) using R/stats version 4.0.5 (n = 5 healthy donors).
Extended Data Fig. 3
Extended Data Fig. 3. In vitro activity of CD19/CD22 CARs.
a) Comparison of CD22CAR cytotoxicity and cytokine secretion with two different spacers. The spacers domains from a pentameric coiled-coil spacer from cartilage oligomeric matrix protein (CD22-COMP CAR) or the hinge domain from human IgG1 (CD22-HNG CAR) were used to transduced T cells. A Cytotoxicity was determined after 72 h co-cultures with Raji (i) and SupT1 CD22+ (ii) tumour cell lines (1:1 E:T). EGFRvIII CAR was used as an irrelevant CAR and data were normalised to non-transduced (NT) T cells. iii) Cytokine release of CAR T cells co-cultured with Raji (1:1 E:T at 72 h). Lines represent the mean of individual healthy donors. Statistical analysis performed by one-way ANOVA with Dunnett’s post-test comparing the CD22 COMP-CAR to all other conditions (n = 3-5 biologically independent samples). (i) ****P < 0.0001, **P = 0.0012, (ii) *P = 0.012, (iii) ***P = 0.0004 for NT PBMCs vs CD22 COMP-CAR, ***P = 0.0008 for CD22 HNG-CAR vs CD22 COMP-CAR, ***P = 0.0005 for EGFR viii CAR vs CD22 COMP-CAR. b) Activity of CD19/CD22 CAR against CD19  negative tumor cells. Cytotoxicity (i) and IFN-γ release (ii) was assessed after AUTO3 CAR T cells were co-cultured for 24 hrs with Raji (empty squares) or CD19  knockout Raji cells (solid dots) at a 1:1 E:T. EGFRvIII CAR was used as an irrelevant CAR and cytotoxicity data were normalised to non-transduced (NT) T cells (n = 9 biologically independent samples). iii) Proliferation: Transduced T cells prepared as above were labelled with CTV (Cell Trace Violet) prior to 1:1 co-culture with Raji or CD19  knockout Raji cells. After 4 days the fluorescence of CTV on CD3+ cells was measured by flow cytometry. Lines represent the mean value of individual healthy donors (n = 6 biologically independent samples). Statistical analysis performed by one-way ANOVA with Dunnett’s post test comparing AUTO3 CAR against NT and EGFRviii CAR within each target group (Raji or CD19  KO Raji); (i), (ii) and (iii) ****P < 0.0001; (i) ***P = 0.0003; (ii) **P = 0.003 for AUTO3 vs NT and **P = 0.007 for AUTO3 vs EGFRvIII CAR; (iii) ***P = 0.0005 for AUTO3 vs EGFRvIII CAR and ***P = 0.0002 for AUTO3 vs NT, *P = 0.017 for AUTO3 vs NT and *P = 0.015 for AUTO3 vs EGFRvIII CAR.
Extended Data Fig. 4
Extended Data Fig. 4. In vivo efficacy of AUTO3 in Nalm6 NSG models.
In vivo efficacy of AUTO3 in Nalm6 NSG models. (a-c) CD19+ CD22+ Nalm6 cells transduced to express luciferase were IV administered into NSG mice. After 4 days, 1×10⁶, 3×10⁶ or 5×10⁶ transduced AUTO3 CAR T cells or matched number of non-transduced (NT) T cells were administered IV. a) Bioluminescent imaging (BLI) of the Nalm6 tumor burden measured post CAR T-cell injection. b) The mean total flux radiance quantified pre (day -1) and post administration of 1×10⁶ and 3×10⁶ CAR T-cells (n = 5 for FMC63 and AUTO3, n = 3 for NT). c) BLI of a CD19 knockout (CD19KO) Nalm6 NSG model. NSG mice were IV injected with luciferase positive CD19KO Nalm6 cells 8 days prior to the IV administration of 5×10⁶ transduced CAR T-cells or matched number of non-transduced (NT) T cells (n = 5 biologically independent animals). Statistical analysis performed by two-way ANOVA with Bonferroni correction between FCM63 and AUTO3 over all time points. 1×10⁶ dose **** P = 0.00002. 3×10⁶ dose day 13 ****P < 0.00001, day 16 *** P = 0.00057.
Extended Data Fig. 5
Extended Data Fig. 5. AUTO3 product phenotype characterization data.
Drug product memory phenotype composition as percentage of CD4+ or and CD8+ CAR T cells: naïve T cells (CD45RA+, CCR7+), central memory (CM) T cells (CD45RA-, CCR7+), effector memory (EM) T cells (CD45RA-, CCR7-), terminally differentiated T effector memory cells re-expressing CD45RA, TEMRA (CD45RA+, CCR7-). Drug product exhaustion phenotype composition based on percentage of CD4+ or CD8+ CAR T cells expressing TIM3, LAG3, PD-1 or TIGIT. Stacked bars show percentage of cells expressing single markers per individual patients.
Extended Data Fig. 6
Extended Data Fig. 6. CRS events per patient.
Duration defined as day from start of 1st selected AE to end of last AE related to CRS by the investigator. Selected AEs included: febrile neutropenia, hypotension, pyrexia, tachycardia. Neutropenia alone was not considered a CRS related AE and was excluded from this analysis. No patients were admitted to intensive care unit (ICU) due to CRS.
Extended Data Fig. 7
Extended Data Fig. 7. Neurotoxicity.
a) Summary of neurotoxicity events in the 5 patients who had any reported neurotoxicity AE. Note: Patient 3 had a not resolved event because the event was still ongoing when patient died due to disease progression 2.3 months after AUT03 infusion. b) Serum cytokine levels in patient 001 who experienced encephalopathy 5 days after a 0.3×10⁶cell/kg dose of AUTO3 infusion, the encephalopathy was considered likely related to the prior infusion of intrathecal methotrexate and unlikely related to AUTO3.
Extended Data Fig. 8
Extended Data Fig. 8. General Toxicity.
a) Summary table of adverse events by grade (occurring anytime from AUTO3 infusion until the data cut-off), SAEs, DLTs and deaths. *All deaths were due to disease progression. b) Treatment-Emergent Adverse Events (TEAEs) by preferred term with incidence of ≥ 20%. Treatment-emergent was defined as any AE that occurred during or after administration of AUTO3 and anytime up to the data cut-off c) Treatment emergent infections by grade and infection type. No Grade 4 or 5 infections were reported. d) Serious adverse events, all patients and SAEs occurring in ≥5% patients (occurring anytime from AUTO3 infusion until the data cut-off).
Extended Data Fig. 9
Extended Data Fig. 9. CAR T engraftment kinetics.
a) Individual concentration-time profiles for AUTO3 transgene levels by qPCR in peripheral blood post AUTO3 infusion. b) Summary of CAR T cell kinetic parameters as measured in peripheral blood by qPCR. Cmax - maximum concentration; Tmax - Time to Cmax (Days), Tlast -Time to last measurable in blood (Days), AUC - area under the curve; AUC 0-28d - AUC from time zero to day 28; AUC 0-84d - AUC from time zero to day 84; Time to Cmax is the time to reach peak CAR T cell concentration. Dose Level 1, 0.3-2 ×10⁶ cells/kg, Dose Level 2, 3×10⁶ cells/kg, Dose level 3, 4.3-5 ×10⁶ cells/kg. Of Note: 1 non-responding patient did not have any CAR-T expansion and therefore was non-evaluable for kinetic parameter derivation.
Extended Data Fig. 10
Extended Data Fig. 10. PD-1 expression at peak CAR expansion.
a) Expression of PD1 on CD3+ CAR+ cells from peripheral blood at the peak of expansion analyzed by flow cytometry in patients with the highest dose cohort. Treatment day is indicated in the parenthesis. Expression on CD3+ CAR- cells is shown as reference. Cells gated on live CD3+ CD45+ cells. b) Percentage of PD1+ CD3+ CAR+ in the peripheral blood of patients at the peak of CAR marking that received the highest AUTO3 dose.

References

    1. Maude SL, et al. Tisagenlecleucel in children and young adults with B-cell lymphoblastic leukemia. N. Engl. J. Med. 2018;378:439–448. doi: 10.1056/NEJMoa1709866. - DOI - PMC - PubMed
    1. Ghorashian S, et al. Enhanced CAR T cell expansion and prolonged persistence in pediatric patients with ALL treated with a low-affinity CD19 CAR. Nat. Med. 2019;25:1408–1414. doi: 10.1038/s41591-019-0549-5. - DOI - PubMed
    1. Fry TJ, et al. CD22-targeted CAR T cells induce remission in B-ALL that is naive or resistant to CD19-targeted CAR immunotherapy. Nat. Med. 2018;24:20–28. doi: 10.1038/nm.4441. - DOI - PMC - PubMed
    1. Shah NN, et al. CD4/CD8 T-cell selection affects chimeric antigen receptor (CAR) T-cell potency and toxicity: updated results from a phase I anti-CD22 CAR T-cell trial. J. Clin. Oncol. 2020;38:1938–1950. doi: 10.1200/JCO.19.03279. - DOI - PMC - PubMed
    1. Wang N, et al. Efficacy and safety of CAR19/22 T-cell cocktail therapy in patients with refractory/relapsed B-cell malignancies. Blood. 2020;135:17–27. doi: 10.1182/blood.2019000017. - DOI - PubMed

Publication types

MeSH terms

Substances