. 2021 Oct;27(10):1761-1782.
doi: 10.1038/s41591-021-01498-0. Epub 2021 Oct 12.

Anemia prevalence in women of reproductive age in low- and middle-income countries between 2000 and 2018

Collaborators, Affiliations

Anemia prevalence in women of reproductive age in low- and middle-income countries between 2000 and 2018

Damaris Kinyoki et al. Nat Med. 2021 Oct.

Abstract

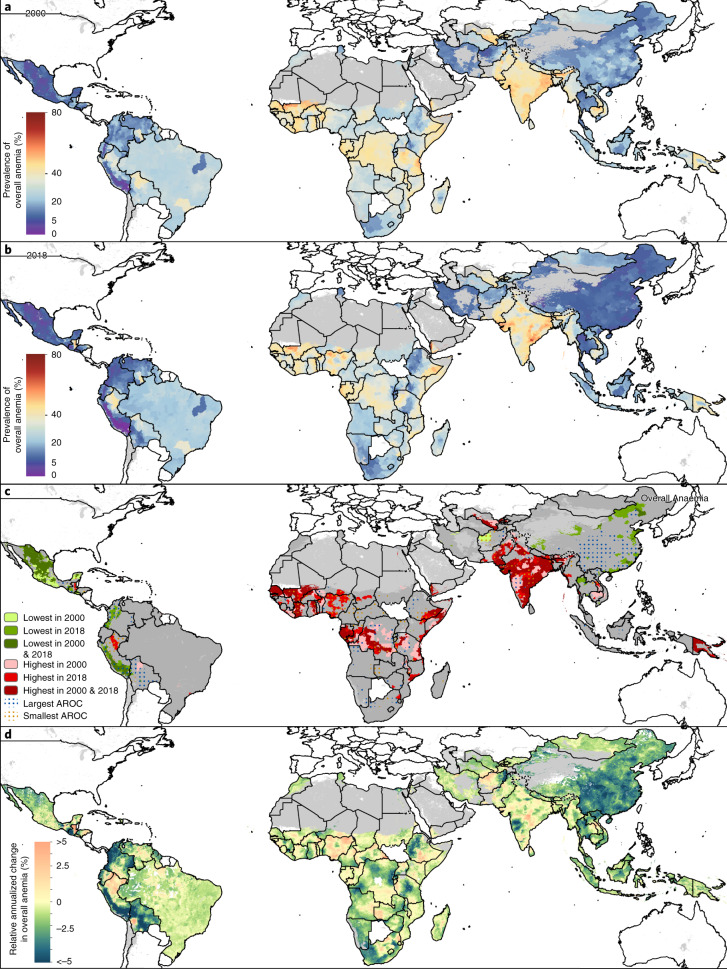
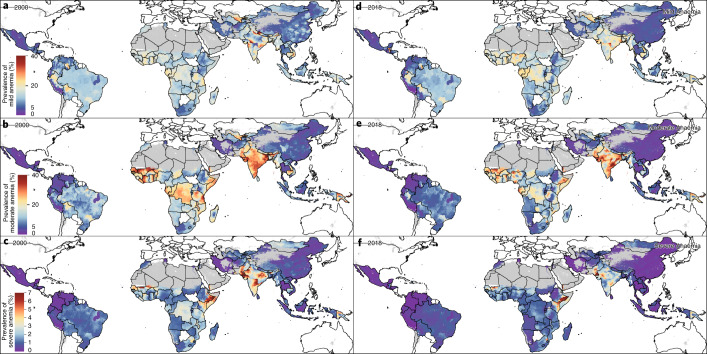
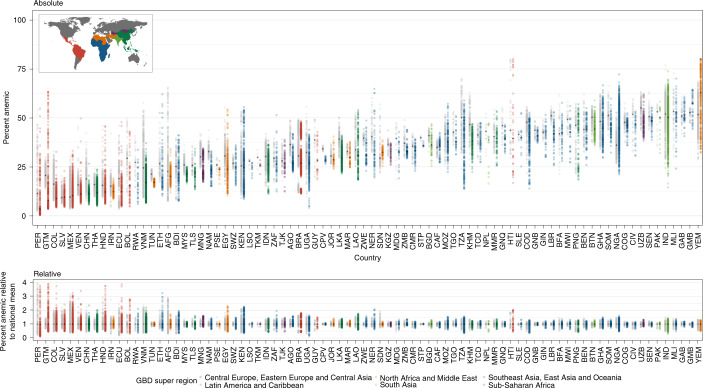
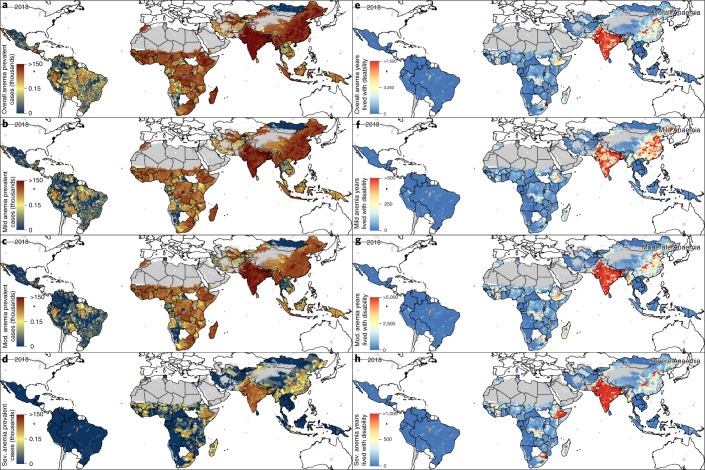
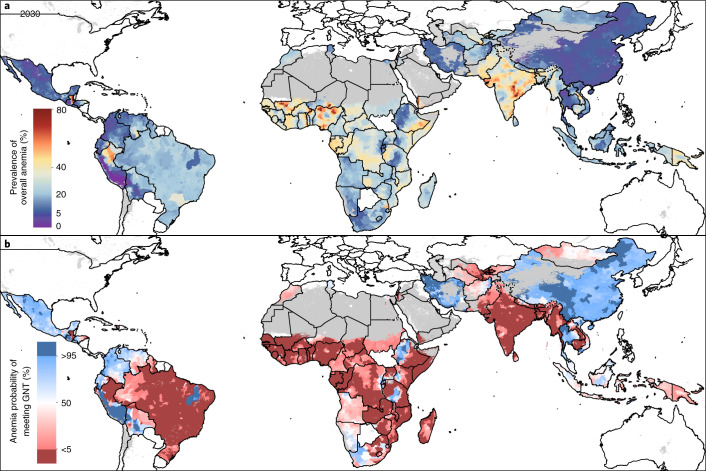
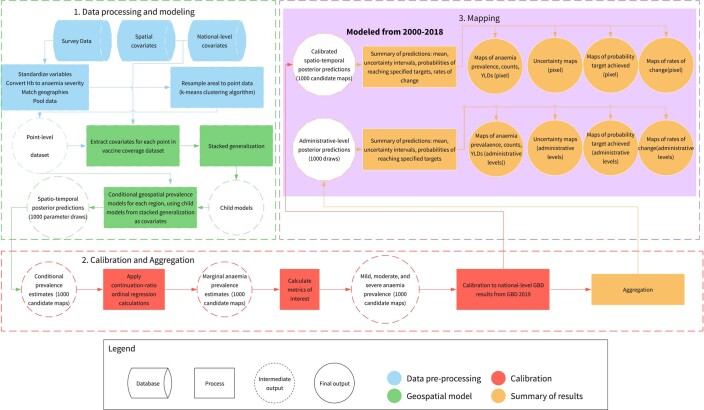
Anemia is a globally widespread condition in women and is associated with reduced economic productivity and increased mortality worldwide. Here we map annual 2000-2018 geospatial estimates of anemia prevalence in women of reproductive age (15-49 years) across 82 low- and middle-income countries (LMICs), stratify anemia by severity and aggregate results to policy-relevant administrative and national levels. Additionally, we provide subnational disparity analyses to provide a comprehensive overview of anemia prevalence inequalities within these countries and predict progress toward the World Health Organization's Global Nutrition Target (WHO GNT) to reduce anemia by half by 2030. Our results demonstrate widespread moderate improvements in overall anemia prevalence but identify only three LMICs with a high probability of achieving the WHO GNT by 2030 at a national scale, and no LMIC is expected to achieve the target in all their subnational administrative units. Our maps show where large within-country disparities occur, as well as areas likely to fall short of the WHO GNT, offering precision public health tools so that adequate resource allocation and subsequent interventions can be targeted to the most vulnerable populations.


Conflict of interest statement

This study was funded by the Bill & Melinda Gates Foundation. Co-authors employed by the Bill & Melinda Gates Foundation provided feedback on initial maps and drafts of this manuscript. Otherwise, the funders of the study had no role in study design, data collection, data analysis, data interpretation or writing of the final report. The corresponding author had full access to all the data in the study and had final responsibility for the decision to submit for publication. R.A. received consultancy/speaker fees from UCB, Sandoz, Abbvie, Zentiva, Teva, Laropharm, CEGEDIM, Angelini, Biessen Pharma, Hofigal, AstraZeneca and Stada. Dr. Bell reports grants from the Wellcome Trust Foundation, grants from the NIH, grants from the Environmental Protection Agency, personal fees from the University of Montana, other from the NIH and grants from the Yale Climate Change and Health Center, all outside of the submitted work. Dr. Gessner reports employment from Pfizer Vaccines, outside of the submitted work. Dr. Islam reports grants from the National Heart Foundation of Australia and grants from the NHMRC, outside of the submitted work. Dr. Jozwiak reports personal fees from Amgen, personal fees from Alab Laboratories, personal fees from Teva, personal fees from Synexus, personal fees from Boehringer Ingelheim and personal fees from Zentiva, outside of the submitted work. Dr. Krishan reports non-financial support from the UGC Centre of Advanced Study, CAS II, Department of Anthropology, Panjab University, outside of the submitted work. Dr. Mendoza reports employment as a program analyst in Population and Development at the United Nations Population Fund-UNFPA Country Office in Peru, which does not necessarily endorse this study. Dr. Pandi-Perumal reports non-financial support from Somnogen Canada and personal fees from royalties, outside of the submitted work. Dr. Postma reports grants and personal fees from MSD, grants and personal fees from GSK, grants and personal fees from Pfizer, grants and personal fees from Boehringer Ingelheim, grants and personal fees from Novavax, personal fees from Quintiles, grants from Bayer, grants and personal fees from BMS, grants and personal fees from Astra Zeneca, grants and personal fees from Sanofi, personal fees from Novartis, personal fees from Pharmerit, other from Health-Ecore, other from PAG, other from Asc Academics, grants and personal fees from IQVIA, grants from bioMérieux, grants from the WHO, grants from the European Union, grants and personal fees from Seqirus, grants from FIND, grants from Antilope and grants from DIKTI, LPDP, Budi, all outside of the submitted work. Dr. Rezahosseini reports grants from the Research Foundation of Rigshospitalet and grants from the A.P. Møller Fonden, outside of the submitted work. Dr. Shivarov reports salary from PRAHS, outside of the submitted work. Dr. Uddin reports as having worked as a visiting fellow at Deakin University Institute for Physical Activity and Nutrition (IPAN). IPAN paid for travel (including flights and transportation), accommodations and meals. E.Upadhyay is listed on two patents: ‘A system and method of reusable filters for anti-pollution mask’ (pending) and ‘A system and method for electricity generation through crop stubble by using microbial fuel cells’ (pending). Dr. Wu reports grants from the Ministry of Science and Technology in China, personal fees from HealthKeepers, grants from Suzhou Municipal Science and Technology Bureau and grants from Kunshan Government, outside of the submitted work. Dr. Zhu reports grants from UTHealth Innovation for Cancer Prevention Research Training Program Pre-doctoral Fellowship (Cancer Prevention and Research Institute of Texas, grant no. RP160015), during the conduct of the study.

Figures

Fig. 1
Fig. 1. Prevalence and AROCs of overall anemia in WRA (2000–2018).
a, b, Prevalence of overall anemia among WRA (ages 15–49) at the second administrative unit (for example, district) level in 2000 (a) and 2018 (b). c, Overlapping population-weighted highest and lowest (10th and 90th deciles) prevalence and AROCs between 2000 and 2018. Largest AROC indicates where largest decreases in overall anemia prevalence from 2000 to 2018 occurred, whereas smallest AROC indicates where the largest increases (or smallest decreases or stagnation) in overall anemia prevalence from 2000 to 2018 occurred. d, Weighted annualized percentage of change of overall anemia prevalence in WRA from 2000 to 2018. Maps reflect administrative boundaries, land cover, lakes and population; gray-colored grid cells had fewer than ten people per 1 × 1-km grid cell and were classified as ‘barren or sparsely vegetated’, whereas white-colored grid cells were not included in this analysis.
Fig. 2
Fig. 2. Prevalence of anemia in WRA by severity in LMICs (2000 and 2018).
af, Prevalence of anemia stratified by severity among WRA (ages 15–49) at the second administrative unit (for example, district) level. Prevalence of mild anemia among WRA in 2000 (a) and 2018 (d). Prevalence of moderate anemia among WRA in 2000 (b) and 2018 (e). Prevalence of severe anemia among WRA in 2000 (c) and 2018 (f). See Supplementary Table 7 for the cutoffs defining mild, moderate and severe anemia. Maps reflect administrative boundaries, land cover, lakes and population; gray-colored grid cells had fewer than ten people per 1 × 1-km grid cell and were classified as ‘barren or sparsely vegetated’, whereas white-colored grid cells were not included in this analysis.
Fig. 3
Fig. 3. Geographical inequality in overall anemia among WRA across 82 countries for 2000 and 2018.
a, Absolute inequalities: range of overall anemia estimates in WRA in second administrative-level units within 82 LMICs. b, Relative inequalities: range of ratios of overall anemia estimates in WRA in second administrative-level units relative to country means (administrative level/country level). Each dot represents a second administrative-level unit. The lower bound of each bar represents the second administrative-level unit with the lowest overall anemia in WRA in each country. The upper end of each bar represents the second administrative-level unit with the highest overall anemia in WRA in each country. Thus, each bar represents the extent of geographic inequality in overall anemia in WRA estimated for each country. Bars indicating the range in 2018 are colored according to their GBD super-region (Extended Data Fig. 3). Gray bars indicate the range in overall anemia in WRA in 2000. The black diamond in each bar represents the median and mean overall anemia in WRA estimated across second administrative-level units in each country and year for the absolute (median) and relative (mean) inequalities plots. A colored bar that is shorter than its gray counterpart indicates that geographic inequality has narrowed.
Fig. 4
Fig. 4. Counts and YLDs by anemia severity among WRA across LMICs in 2018.
ad, Number of WRA across 82 LMICs with overall (a), mild (b), moderate (c) and severe (d) anemia in 2018 by second administrative-level units. eh, Number of YLDs among WRA attributable to overall (e), mild (f), moderate (g) and severe (h) anemia in 2018 by second administrative-level units. Maps reflect administrative boundaries, land cover, lakes and population; gray-colored grid cells had fewer than ten people per 1 × 1-km grid cell and were classified as ‘barren or sparsely vegetated’, whereas white-colored grid cells were not included in this analysis.
Fig. 5
Fig. 5. Prevalence for overall anemia among WRA in 2030 and probability of achieving the WHO GNT for overall anemia by 2030.
a, Predicted prevalence of overall anemia among WRA in 2030 by second administrative-level units. b, Probability of achievement of the WHO GNT to reduce overall anemia in WRA by 50% by the year 2030, with the year 2012 as a baseline, by second administrative-level units. Maps reflect administrative boundaries, land cover, lakes and population; gray-colored grid cells had fewer than ten people per 1 × 1-km grid cell and were classified as ‘barren or sparsely vegetated’ or were not included in this analysis.
Extended Data Fig. 1
Extended Data Fig. 1. Highest- and lowest-performing second administrative-level units stratified by anaemia severity in women of reproductive age across LMICs (2000–2018).
ad, Overlapping population-weighted highest and lowest deciles of prevalence and weighted annualised rates of change (AROC) by severity at the second administrative level between 2000 and 2018 for overall (a), mild (b), moderate (c), and severe anaemia (d) among WRA. Maps reflect administrative boundaries, land cover, lakes, and population; grey-coloured grid cells had fewer than ten people per 1 × 1-km grid cell and were classified as “barren or sparsely vegetated”, while white-coloured grid cells were not included in this analysis.
Extended Data Fig. 2
Extended Data Fig. 2. Counts and years lived with disability (YLDs) by anaemia severity among WRA in 2000.
ad, Number of WRA across 82 LMICs with overall (a), mild (b), moderate (c), and severe anaemia (d) in 2000 by second administrative-level units. eh, Number of years lived with disability (YLDs) among women of reproductive age (WRA) attributable to overall (e), mild (f), moderate (g), and severe anaemia (h) in 2000 by second administrative-level units. Maps reflect administrative boundaries, land cover, lakes, and population; grey-coloured grid cells had fewer than ten people per 1 × 1-km grid cell and were classified as “barren or sparsely vegetated”, while white-coloured grid cells were not included in this analysis.
Extended Data Fig. 3
Extended Data Fig. 3. Modelling regions.
Modelling regions were based on geographic and Socio-demographic Index (SDI) regions from the Global Burden of Disease, defined as Andean South America, Central America and the Caribbean, Central sub-Saharan Africa (SSA), East Asia, Eastern SSA, Middle East, North Africa, Oceania, Southeast Asia, South Asia, South SSA, Central Asia, Tropical South America, and Western SSA. Regions in grey (Stage 3) were not included in our models due to high-middle and high SDI. Only 82 low- and middle-income countries (LMICs) were included in this study.
Extended Data Fig. 4
Extended Data Fig. 4. Modeling process flow diagram.
The geospatial modelling process consists of three main sections. First, all available survey data that can be referenced to a coordinate/point (for example, survey cluster) or small polygon (administrative) unit are compiled, Hb measurements are converted to anaemia severity, data matched to polygons are resampled into pseudo-points, covariates are merged onto the point-level dataset, a series of conditional geospatial model is fit using stacked generalization child models as main effects is fit for each geographic region, and 1000 posterior predictions are sampled from the fitted model. Second, the 1000 parameter draws are projected into 1000 5x5km pixel conditional prevalence candidate maps, converted into marginal anaemia severity prevalence maps, calibrated to GBD 2019 estimates, and aggregated to administrative levels. Lastly, the 1000 calibrated pixel and aggregated draws are summarized into estimates of anaemia prevalence, counts, YLDs, and the associated uncertainty, probabilities of meeting targets, and rates of change. See the Methods for more details.

Comment in

References

    1. Kassebaum NJ, GBD 2013 Anemia Collaborators. The Global Burden of Anemia. Hematol. Oncol. Clin. North Am. 2016;30:247–308. doi: 10.1016/j.hoc.2015.11.002. - DOI - PubMed
    1. World Health Organization. Global nutrition targets 2025: anaemia policy brief. https://apps.who.int/iris/handle/10665/148556 (2014) .
    1. Haas JD, Brownlie T. Iron deficiency and reduced work capacity: a critical review of the research to determine a causal relationship. J. Nutr. 2001;131:676S–690S. doi: 10.1093/jn/131.2.676S. - DOI - PubMed
    1. Horton S, Ross J. The economics of iron deficiency. Food Policy. 2003;28:51–75. doi: 10.1016/S0306-9192(02)00070-2. - DOI
    1. Martinsson A, et al. Anemia in the general population: prevalence, clinical correlates and prognostic impact. Eur. J. Epidemiol. 2014;29:489–498. doi: 10.1007/s10654-014-9929-9. - DOI - PubMed

Publication types