. 2021 Oct;7(10):e08140.
doi: 10.1016/j.heliyon.2021.e08140. Epub 2021 Oct 7.

Dynamics of SARS-CoV-2-specific antibodies among COVID19 biobank donors in Argentina

Affiliations

Dynamics of SARS-CoV-2-specific antibodies among COVID19 biobank donors in Argentina

Yesica Longueira et al. Heliyon. 2021 Oct.

Abstract

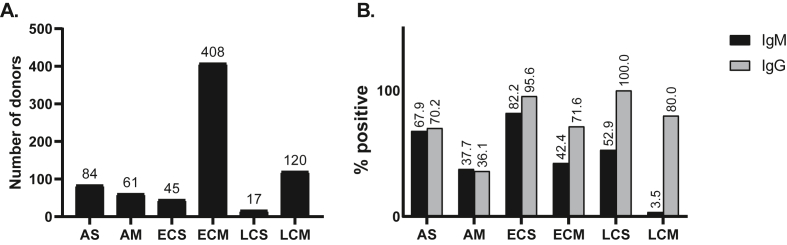
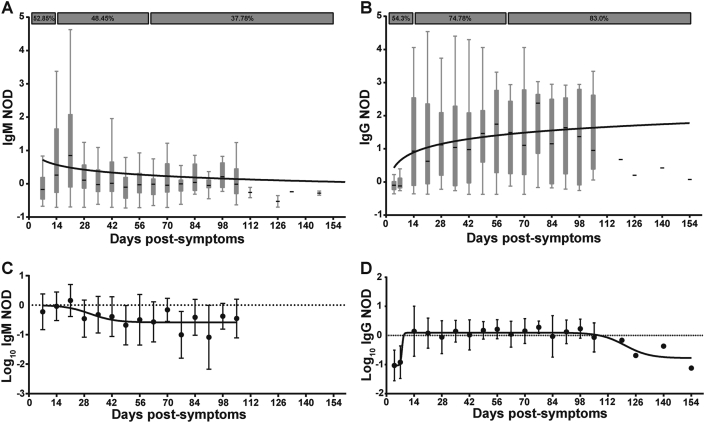
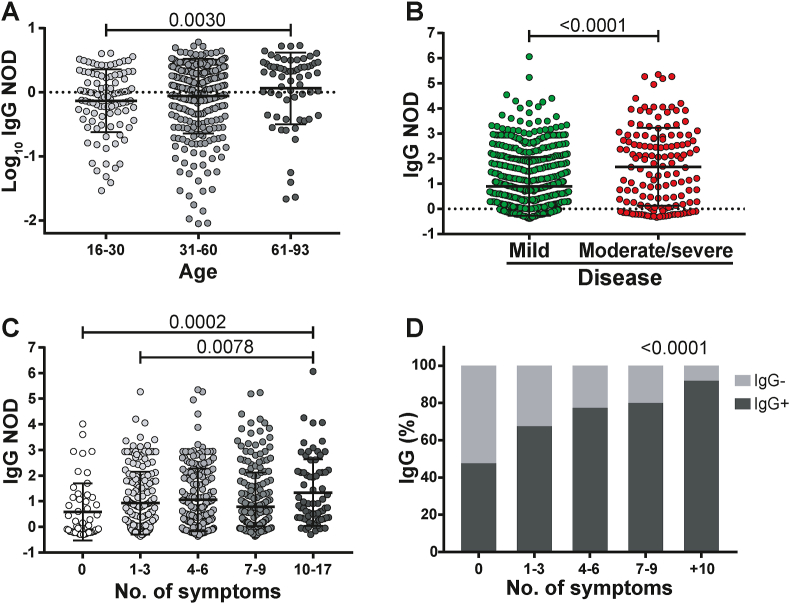
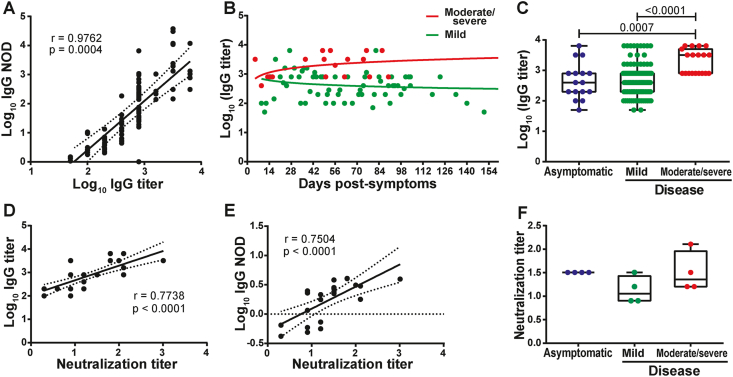
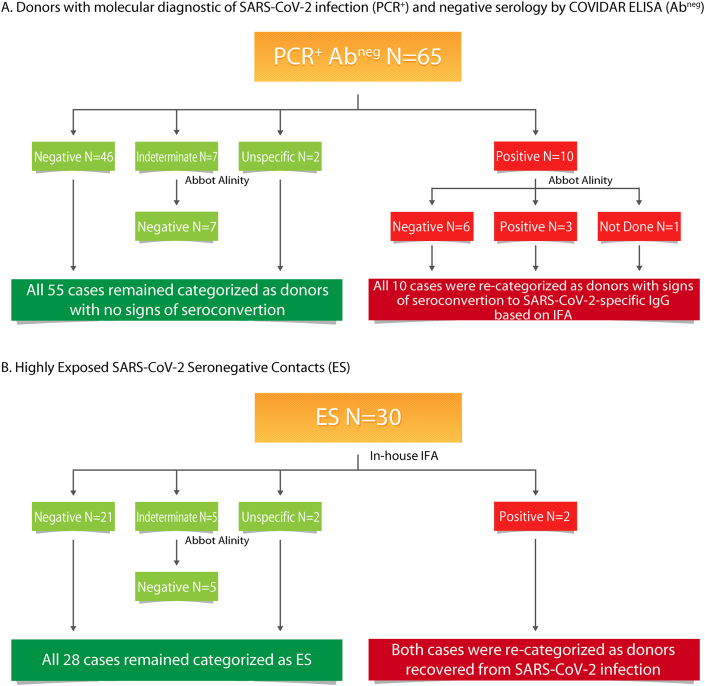
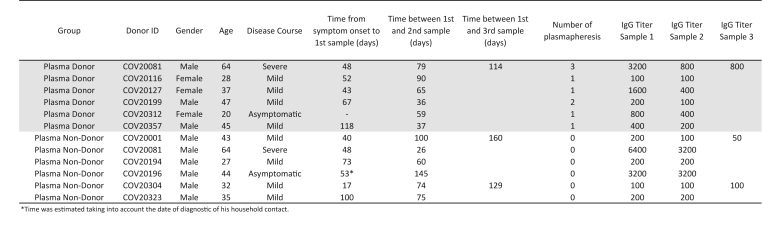
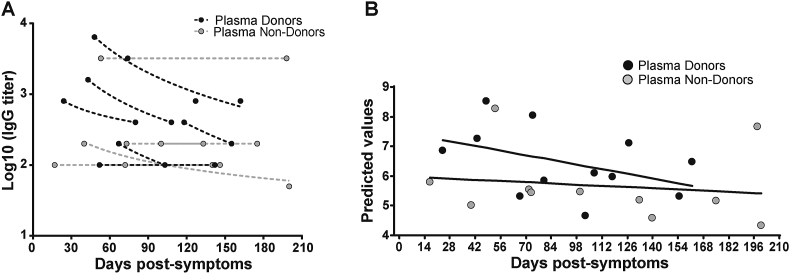
Biobanks are instrumental for accelerating research. Early in SARS-CoV-2 pandemic, the Argentinean Biobank of Infectious Diseases (BBEI) initiated the COVID19 collection and started its characterization. Blood samples from subjects with confirmed SARS-CoV-2 infection either admitted to health institutions or outpatients, were enrolled. Highly exposed seronegative individuals, were also enrolled. Longitudinal samples were obtained in a subset of donors, including persons who donated plasma for therapeutic purposes (plasma donors). SARS-CoV-2-specific IgM and IgG levels, IgG titers and IgG viral neutralization capacity were determined. Out of 825 donors, 57.1% were females and median age was 41 years (IQR 32-53 years). Donors were segregated as acute or convalescent donors, and mild versus moderate/severe disease donors. Seventy-eight percent showed seroconversion to SARS-CoV-2 specific antibodies. Specific IgM and IgG showed comparable positivity rates in acute donors. IgM detectability rate declined in convalescent donors while IgG detectability remained elevated in early (74,8%) and late (83%) convalescent donors. Among donors with follow-up samples, IgG levels seemed to decline more rapidly in plasma donors. IgG levels were higher with age, disease severity, number of symptoms, and more durable in moderate/severe disease donors. Levels and titers of anti-spike/RBD IgG strongly correlated with neutralization activity against WT virus. The BBEI-COVID19 collection serves a dual role in this SARS-CoV-2 global crisis. First, it feeds researchers and developers transferring samples and data to fuel research projects. Second, it generates highly needed local data to understand and frame the regional dynamics of the infection.

Keywords: Antibody response; Biobank; COVID-19; Convalescent plasma; SARS-CoV-2.


Conflict of interest statement

The authors declare no conflict of interest.

Figures

Figure 1
Figure 1
A. Distribution of donors with past or present confirmed SARS-CoV-2 infection per group (Total N = 735). Infection was confirmed either by molecular diagnostic, serology or both. B. SARS-CoV-2-specific IgM and IgG positivity rate per group. Antibodies were evaluated in plama samples by ELISA using the COVIDAR kit. AS: acute severe, AM: acute mild, ECS: early convalescent severe, ECM: early convalescent mild, LCS: late convalescent severe, LCM: late convalescent mild.
Figure 2
Figure 2
Dynamics of anti-SARS-CoV-2 IgM and IgG antibodies. A) Normalized optical density (NOD) measures for IgM, and B) IgG antibodies, were plotted by days post-symptoms onset. Positivity rates for acute, as well as early and late convalescent infection are indicated in both cases. C) Log10 of NOD values for IgM, and D) IgG antibodies were also obtained. Median and 25th and 75th percentiles are shown in A and B, while mean and standard errors are indicated in C and D. Longitudinal data was modeled by using a semi-log (A, B) and a sigmoidal 4PL non-linear regression model (C, D); best fitted curves are depicted in the plots.
Figure 3
Figure 3
Characterization of IgG response in COVID-19 patients. A) Log10 of normalized optical density (NOD) IgG values from patients within separate age groups. B) NOD IgG levels from individuals with mild or moderate/severe disease. C) NOD IgG values from individuals displaying different number of symptoms. D) Positivity rate for IgG antibodies versus number of symptoms. Individual values, mean and standard deviation are shown. Statistical comparisons were made by using Kruskal-Wallis test followed by Dunn's post-test (A, D), two-sided Mann-Whitney test (B) and chi squared test for trend (D). p values are indicated in each panel.
Figure 4
Figure 4
Relationship between optical density, titer, and neutralizing capacity of anti-SARS-CoV-2 IgG antibodies. A) Correlation analysis between Log10 of normalized optical density (NOD) and Log10 of IgG titers. B) Log10 of IgG titers corresponding to individuals who experienced moderate/severe (red dots) or mild disease (green dots) were plotted by day post-symptoms onset. C) Log10 of IgG titers from asymptomatic, and symptomatic individuals. D) Correlation analysis between Log10 IgG titers and IgG neutralizing titers and E) Log10 of NOD IgG values versus and IgG neutralizing titers. F) IgG neutralizing titers from asymptomatic, and symptomatic individuals. Individual measures, median and 25th and 75th percentiles are shown. Correlation studies were performed by using the Spearman rank test. In B, longitudinal data were studied by multiple linear regression, with disease severity and days post symptoms as independent predictors. Coefficients as wells as linear prediction equations are shown in Figure S1A. Statistical comparisons between groups in C and F, were made by using Kruskal-Wallis test followed by Dunn's post-test. p values are indicated in each panel.
Figure 5
Figure 5
Flowchart indicating serology results obtained using different methodologies to evaluate SARS-CoV-2-specific IgG. A) Analysis in a subgroup of donors with molecular diagnostic of SARS-CoV-2 infection (PCR+) and undetected SARS-CoV-2-specific IgG by the COVIDAR kit (Abneg). B) Analysis in a subgroup of suspected highly exposed uninfected donors.
Figure 6
Figure 6
Characteristic of plasma donors and non-donors included in Figure 7.
Figure 7
Figure 7
Fluctuations in IgG titers due to convalescent plasma donation. A) Antibody titers from samples obtained both before and after convalescent plasma donation were quantified, and plotted by days post-symptom onset (black dots, plasma-donors). Time-matched samples from plasma non-donors were analyzed as controls (grey dots, plasma non-donors). B) A repeated measures lineal regression analysis was applied to model data. Plasma donation, days since the onset of symptoms, as well as the interaction between them were set as fixed predictors, and subjects as random effects. Fitted lines are shown. Fixed effects estimates as well as linear prediction equations are shown in Figure S1B.

References

    1. Zhu N. A novel coronavirus from patients with pneumonia in China, 2019. N. Engl. J. Med. 2020;382(8):727–733. - PMC - PubMed
    1. Zhou P. A pneumonia outbreak associated with a new coronavirus of probable bat origin. Nature. 2020;579(7798):270–273. - PMC - PubMed
    1. World Health Organization . 2021. Coronavirus Disease (COVID-19) Situation Reports.https://www.who.int/emergencies/diseases/novel-coronavirus-2019/situatio...
    1. Ministerio de Salud de la Republica Argentina . 2021. COVID19 Daily Report.https://www.argentina.gob.ar/coronavirus/informes-diarios/reportes/abril...
    1. Macera M. Clinical presentation of COVID-19: case series and review of the literature. Int. J. Environ. Res. Publ. Health. 2020;17(14) - PMC - PubMed

LinkOut - more resources