

A Geographic Information System Approach to Map Tick Exposure Risk at a Scale for Public Health Intervention
- PMID: 34642748
- PMCID: PMC8755993
- DOI: 10.1093/jme/tjab169
A Geographic Information System Approach to Map Tick Exposure Risk at a Scale for Public Health Intervention
Abstract
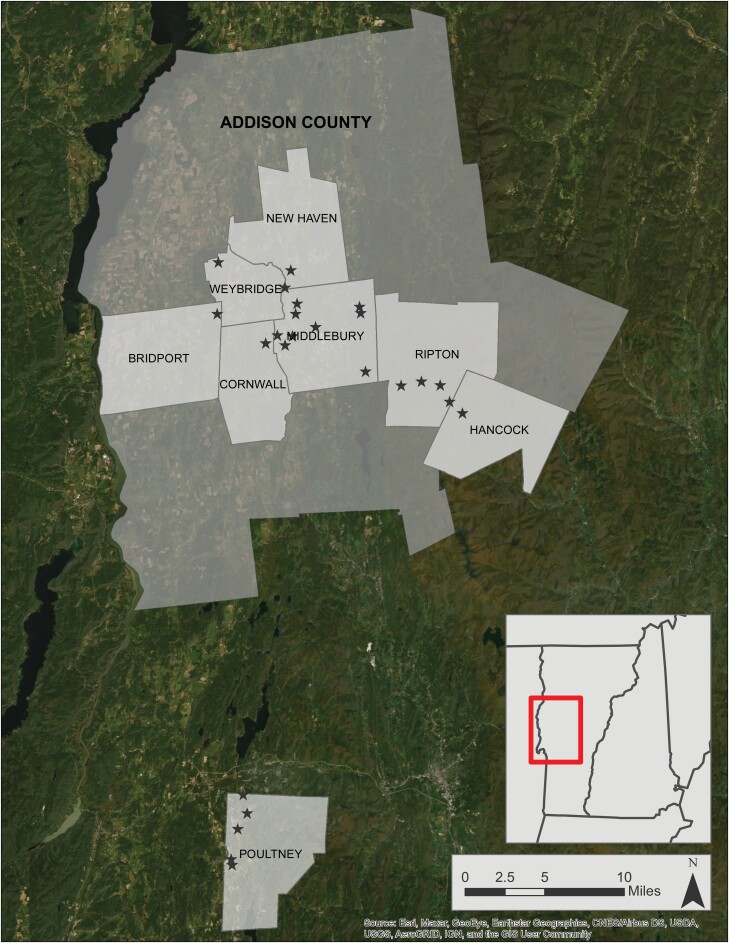
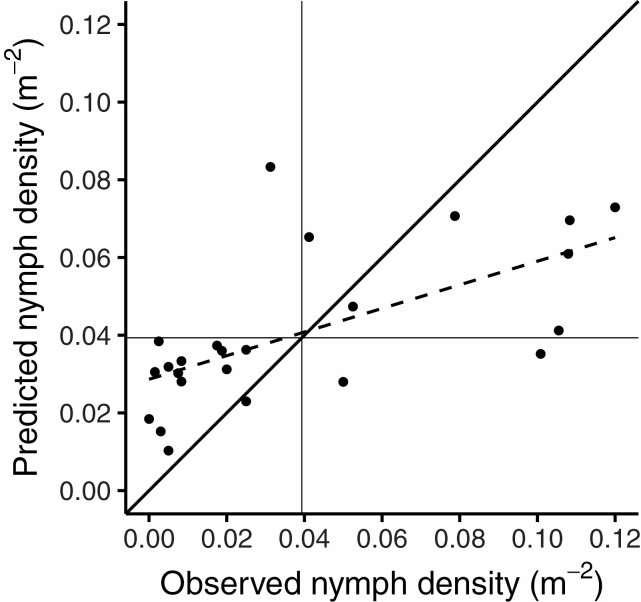
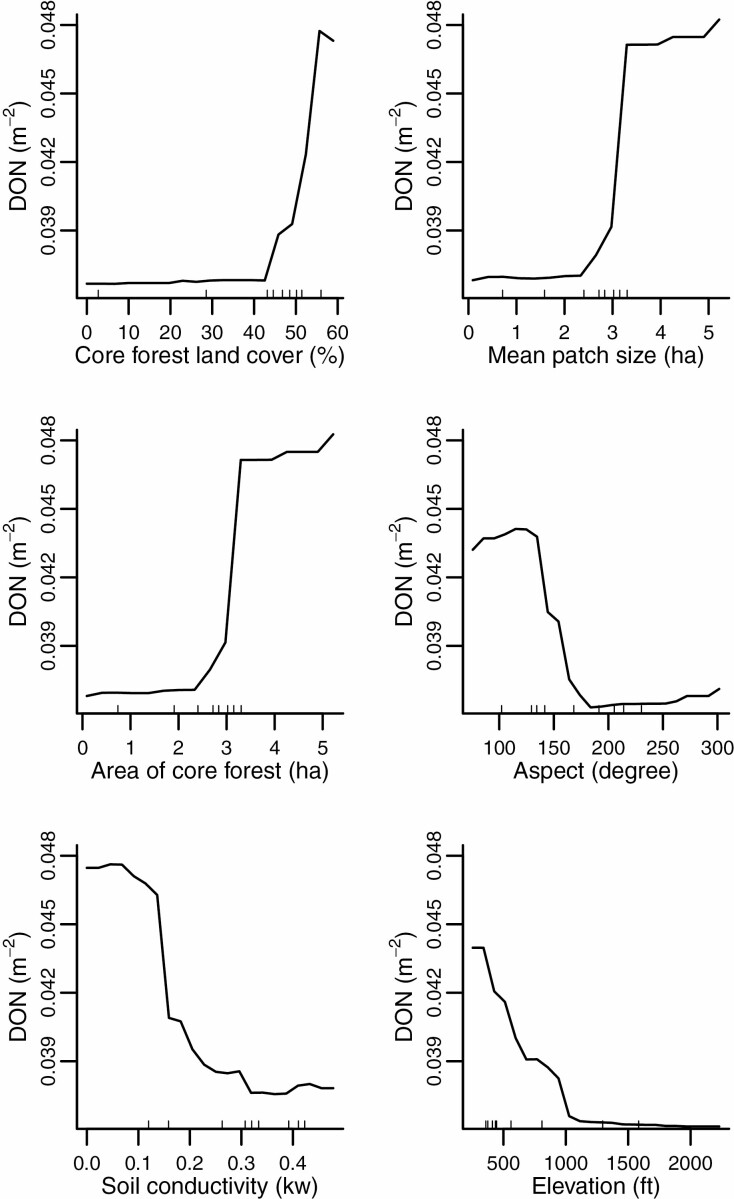
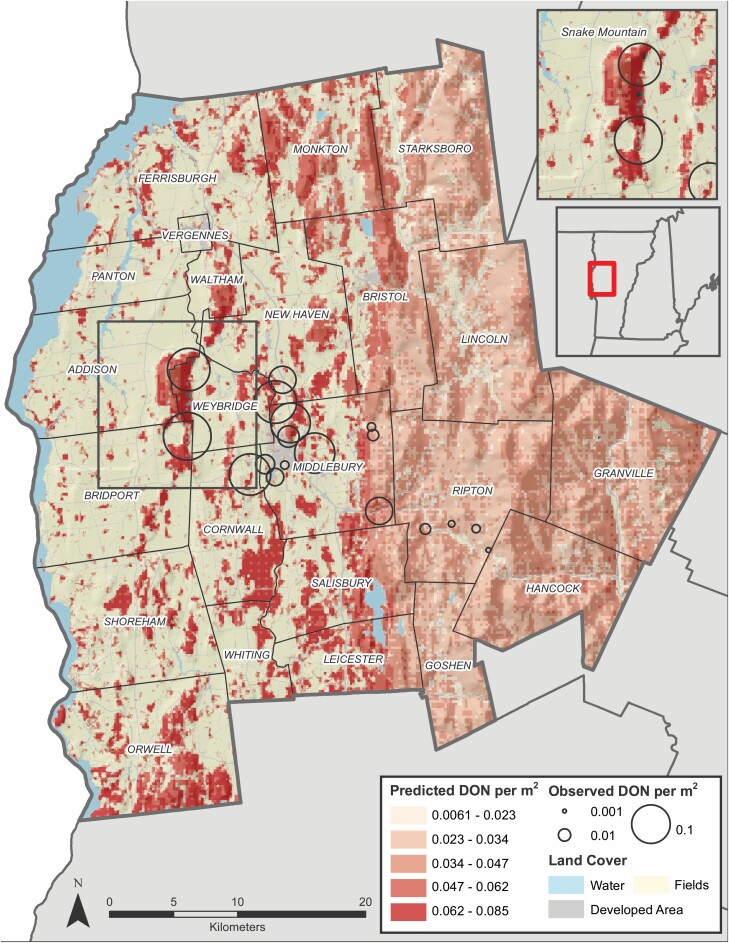
Tick-borne disease control and prevention have been largely ineffective compared to the control of other vector-borne diseases. Although control strategies exist, they are costly or ineffective at large spatial scales. We need tools to target these strategies to places of highest tick exposure risk. Here we present a geographic information system (GIS) method for mapping predicted tick exposure risk at a 200 m by 200 m resolution, appropriate for public health intervention. We followed the approach used to map tick habitat suitability over large areas. We used drag-cloth sampling to measure the density of nymphal blacklegged ticks (Ixodes scapularis, Say (Acari: Ixodidae)) at 24 sites in Addison and Rutland Counties, VT, United States. We used a GIS to average habitat, climatological, land-use/land-cover, and abiotic characteristics over 100 m, 400 m, 1,000 m, and 2,000 m buffers around each site to evaluate which characteristic at which buffer size best predicted density of nymphal ticks (DON). The relationships between predictor variables and DON were determined with random forest models. The 100 m buffer model performed best and explained 37.7% of the variation in DON, although was highly accurate at classifying sites as having below or above average DON. This model was applied to Addison County, VT, to predict tick exposure risk at a 200 m resolution. This GIS approach to map predicted DON over a small area with fine resolution, could be used to target public health campaigns and land management practices to reduce human exposure to ticks.
Keywords: Ixodes scapularis; Lyme disease; bioclimatic modeling; remote sensing; risk-mapping.
© The Author(s) 2021. Published by Oxford University Press on behalf of Entomological Society of America.All rights reserved. For permissions, please e-mail: journals.permissions@oup.com.
Figures


References
-
- Allan, B. F., Keesing F., and Ostfeld R. S.. 2001. Effect of forest fragmentation on Lyme disease risk. Conserv. Biol 17: 267–272.
-
- Barbour, A. G., and Fish D.. 1993. The biological and social phenomenon of Lyme disease. Science. 260: 1610–1616. - PubMed
-
- Borgmann-Winter, B. W., Oggenfuss K. M., and Ostfeld R. S.. 2021. Blacklegged tick population synchrony between oak and non-oak forests. Ecol. Entomol. 46: 827–833.
-
- Brownstein, J. S., Skelly D. K., Holford T. R., and Fish D.. 2005. Forest fragmentation predicts local scale heterogeneity of Lyme disease risk. Oecologia. 146: 469–475. - PubMed
Publication types
MeSH terms
Grants and funding
LinkOut - more resources
Full Text Sources
