

HOMA2-B enhances assessment of type 1 diabetes risk among TrialNet Pathway to Prevention participants
- PMID: 34642772
- PMCID: PMC8752172
- DOI: 10.1007/s00125-021-05573-6
HOMA2-B enhances assessment of type 1 diabetes risk among TrialNet Pathway to Prevention participants
Abstract
Aims/hypothesis: Methods to identify individuals at highest risk for type 1 diabetes are essential for the successful implementation of disease-modifying interventions. Simple metabolic measures are needed to help stratify autoantibody-positive (Aab+) individuals who are at risk of developing type 1 diabetes. HOMA2-B is a validated mathematical tool commonly used to estimate beta cell function in type 2 diabetes using fasting glucose and insulin. The utility of HOMA2-B in association with type 1 diabetes progression has not been tested.
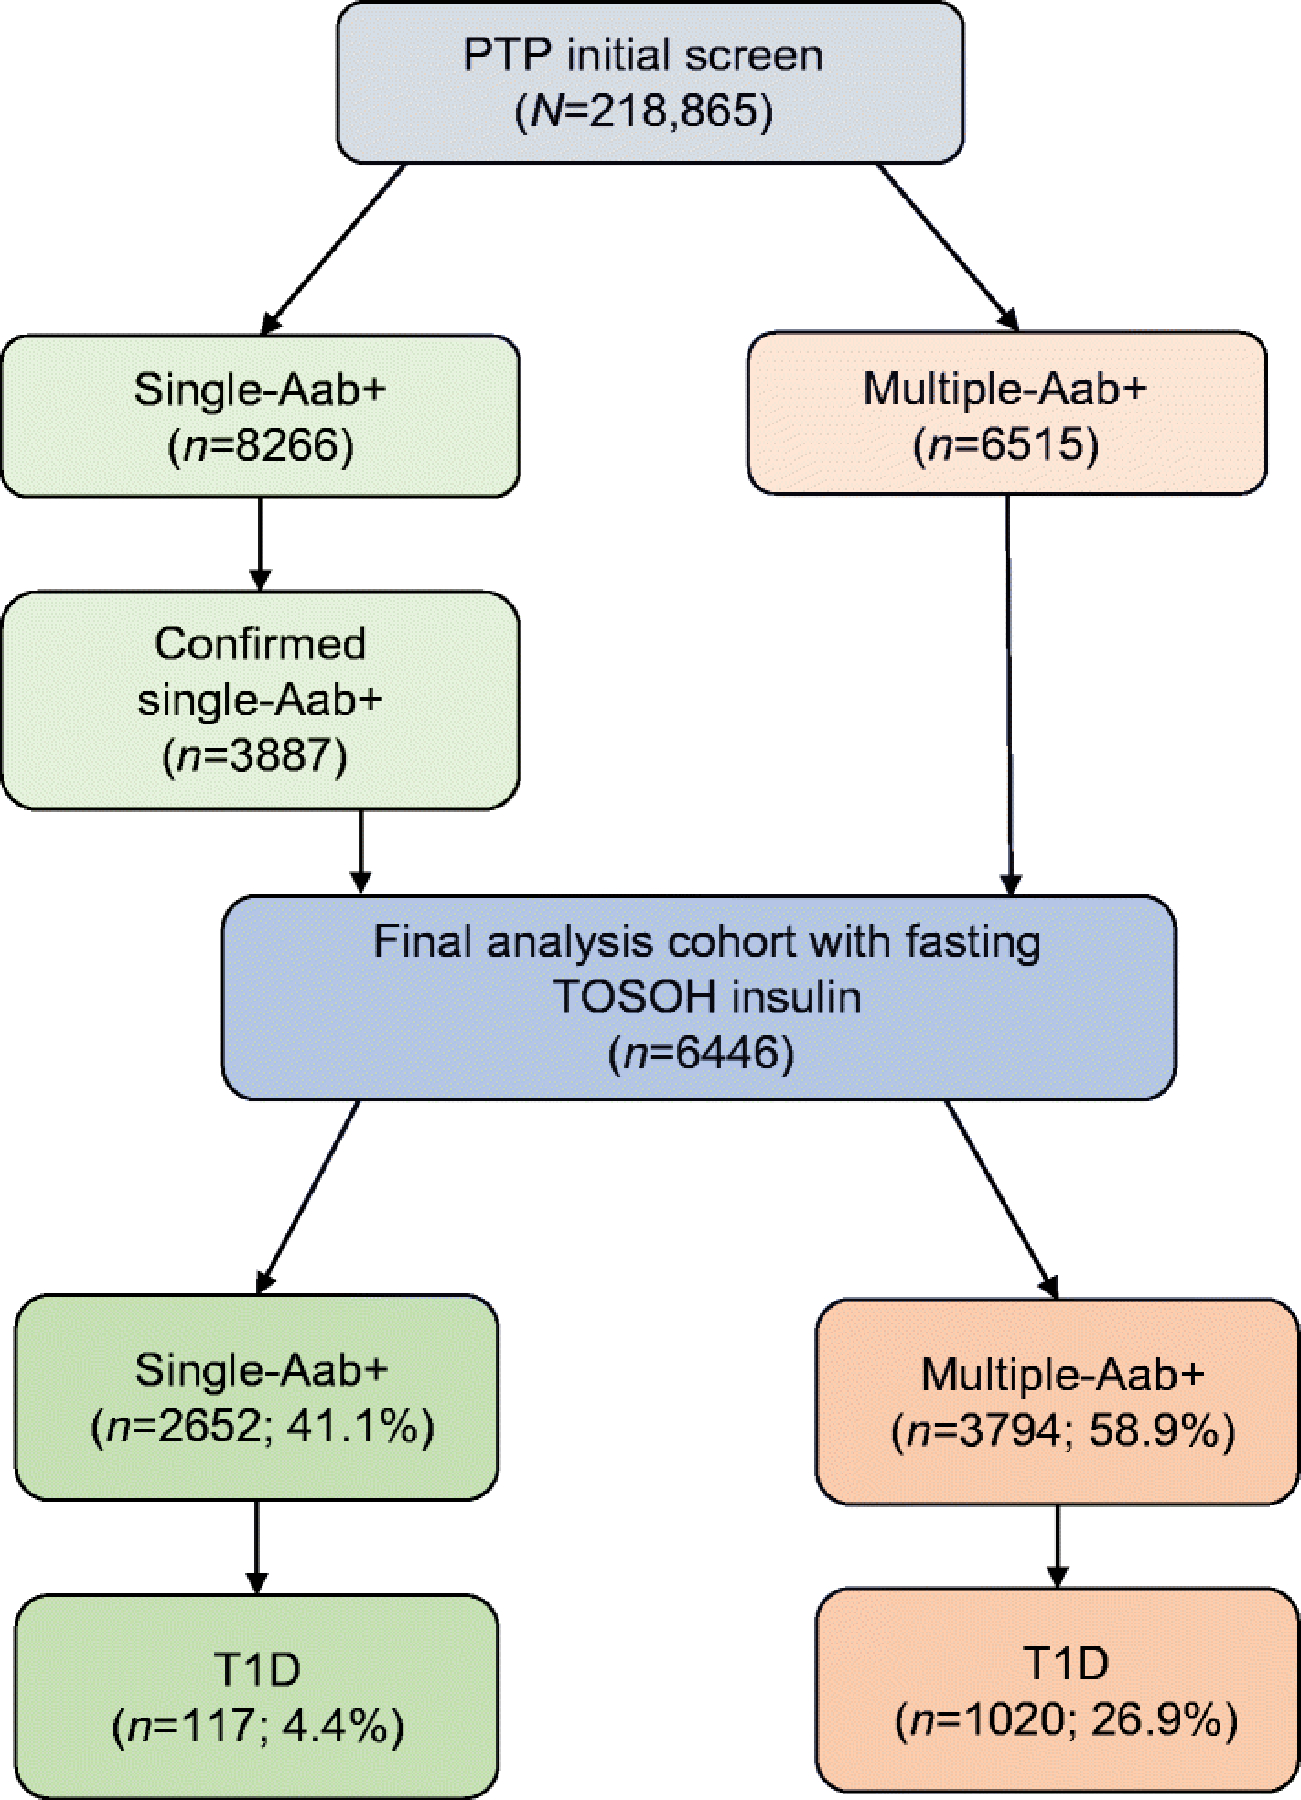
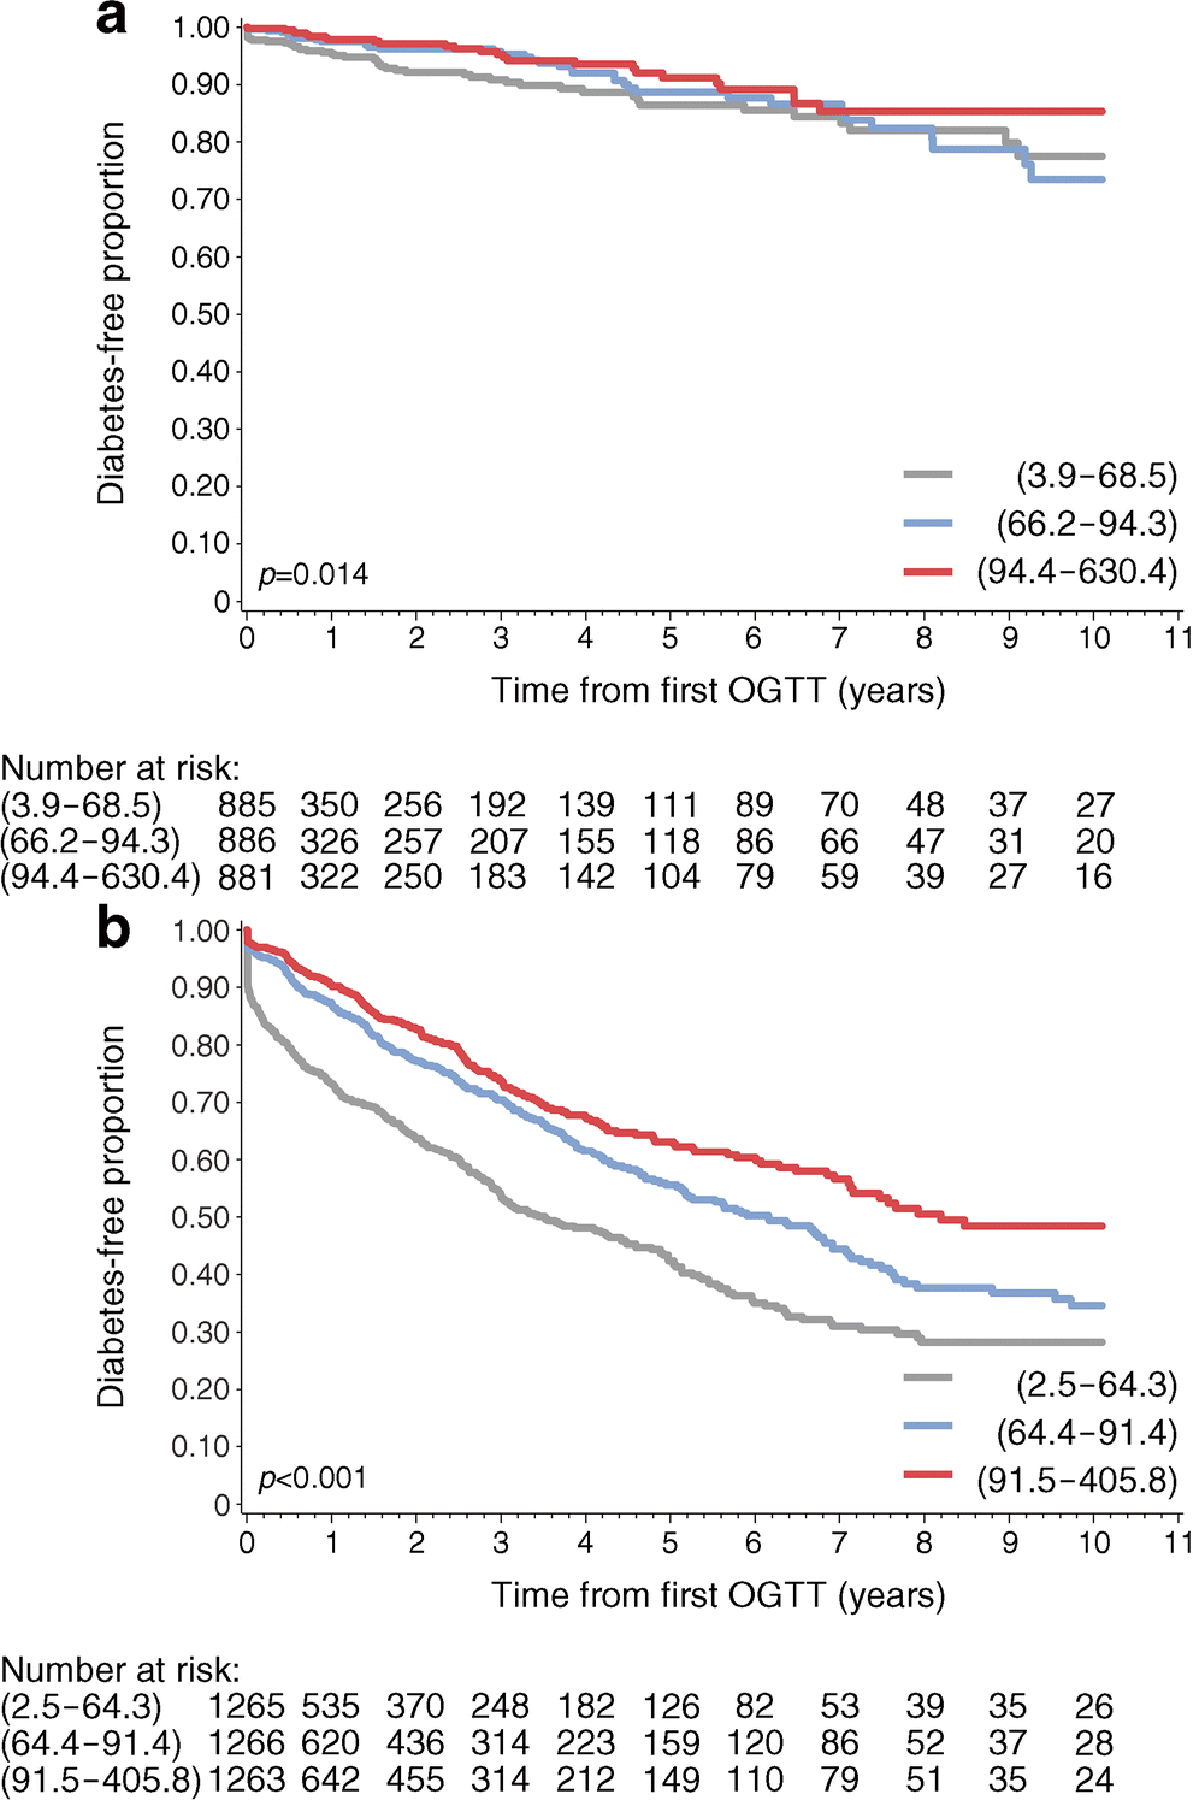
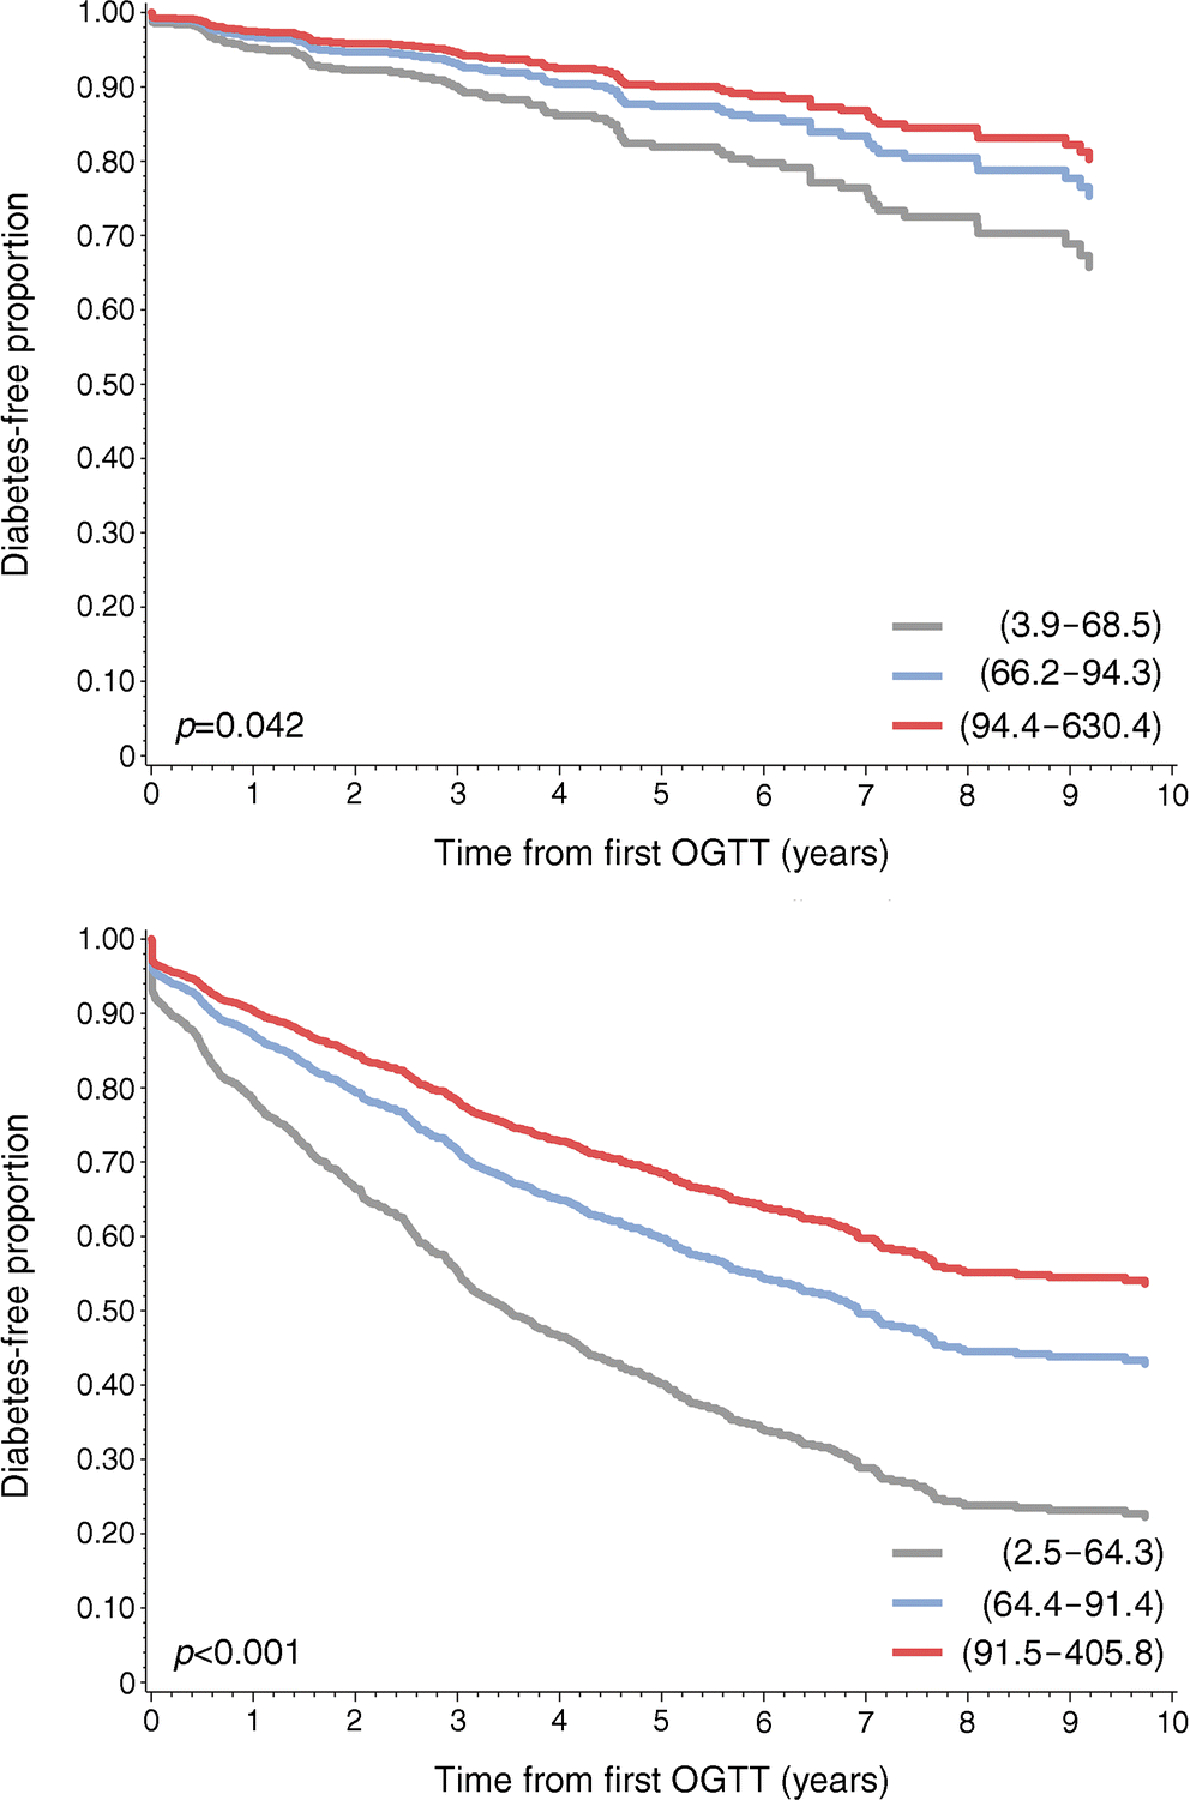
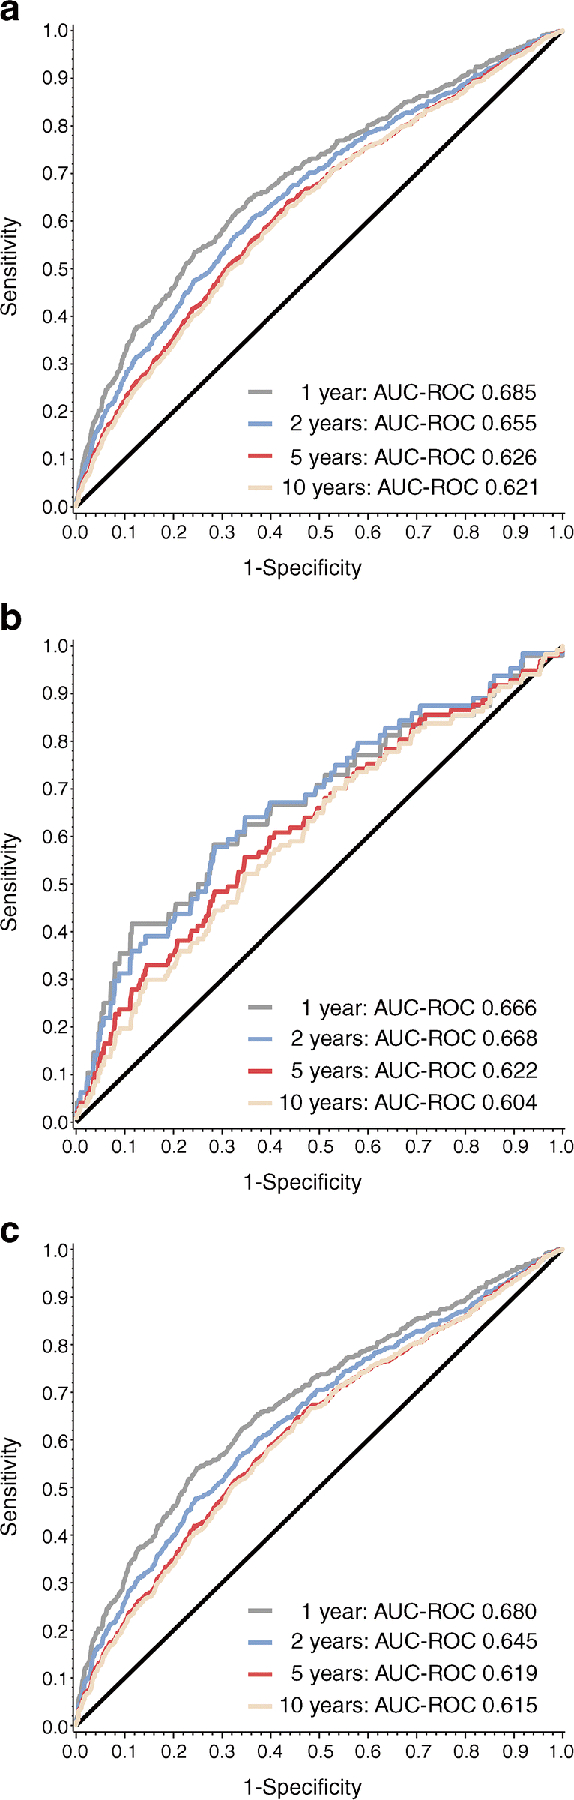
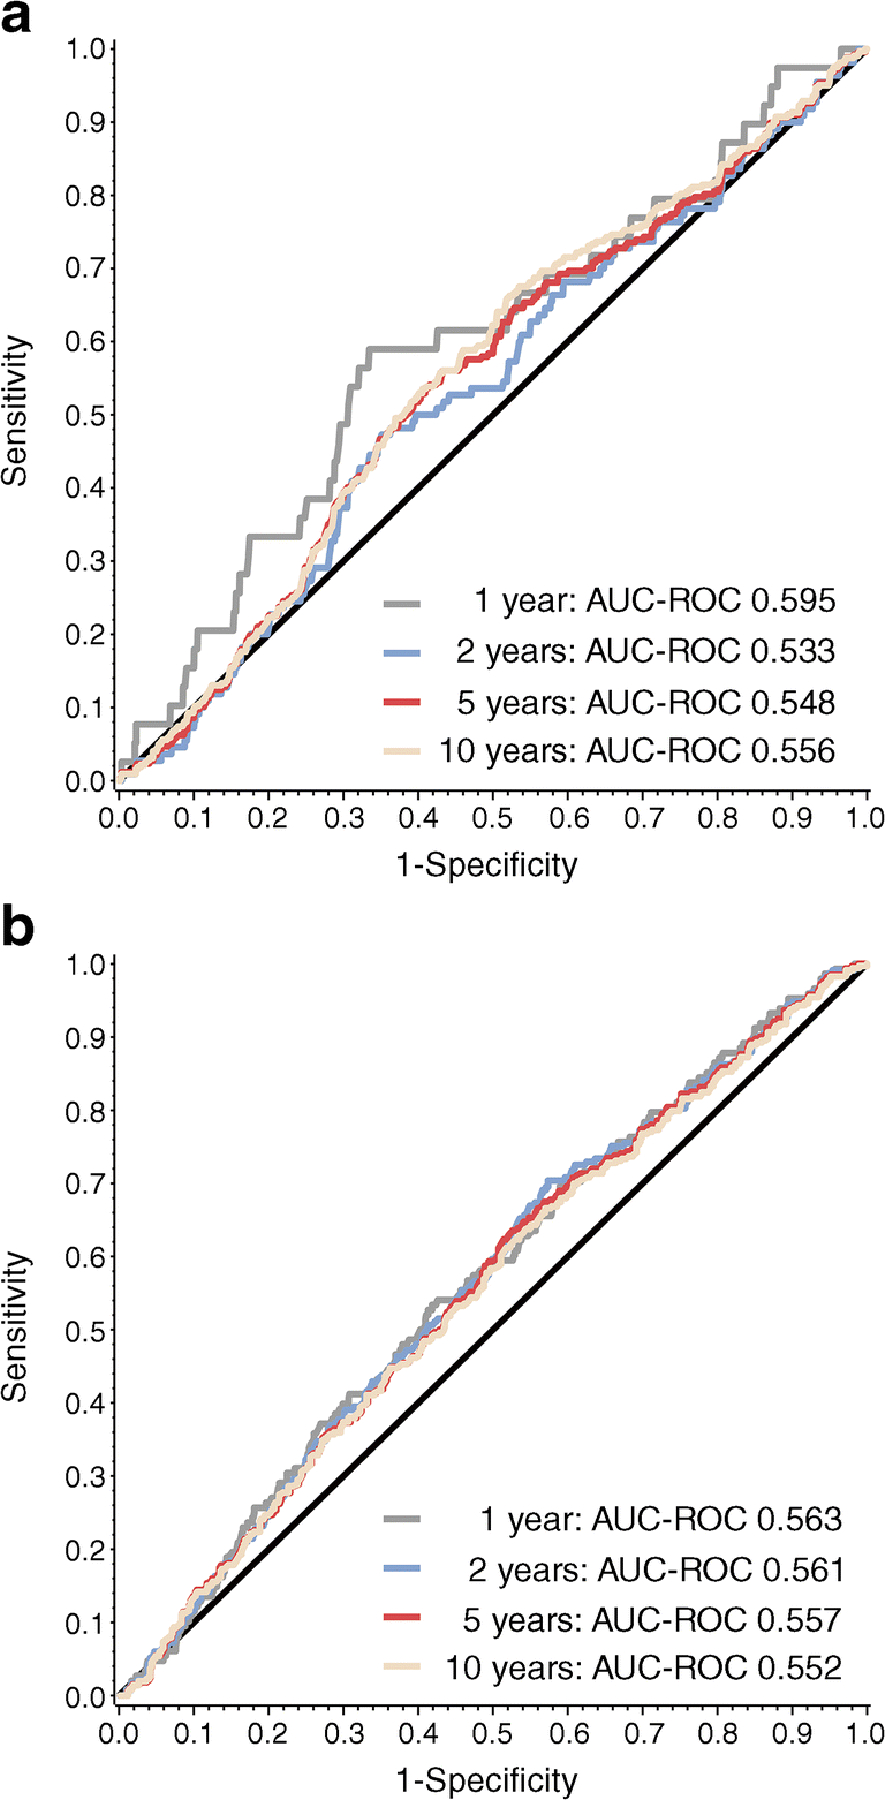
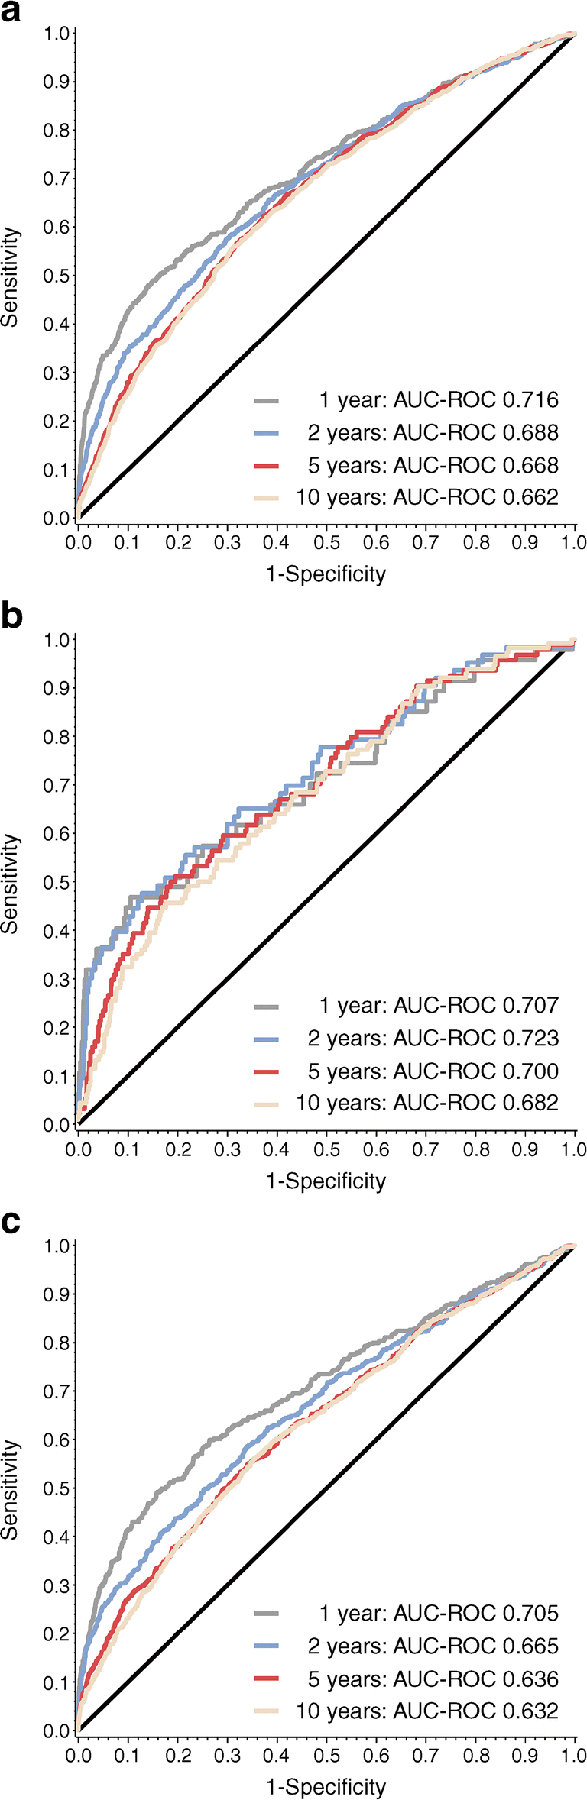
Methods: Baseline HOMA2-B values from single-Aab+ (n = 2652; mean age, 21.1 ± 14.0 years) and multiple-Aab+ (n = 3794; mean age, 14.5 ± 11.2 years) individuals enrolled in the TrialNet Pathway to Prevention study were compared. Cox proportional hazard models were used to determine associations between HOMA2-B tertiles and time to progression to type 1 diabetes, with adjustments for age, sex, HLA status and BMI z score. Receiver operating characteristic (ROC) analysis was used to test the association of HOMA2-B with type 1 diabetes development in 1, 2, 5 and 10 years.
Results: At study entry, HOMA2-B values were higher in single- compared with multiple-Aab+ Pathway to Prevention participants (91.1 ± 44.5 vs 83.9 ± 38.9; p < 0.001). Single- and multiple-Aab+ individuals in the lowest HOMA2-B tertile had a higher risk and faster rate of progression to type 1 diabetes. For progression to type 1 diabetes within 1 year, area under the ROC curve (AUC-ROC) was 0.685, 0.666 and 0.680 for all Aab+, single-Aab+ and multiple-Aab+ individuals, respectively. When correlation between HOMA2-B and type 1 diabetes risk was assessed in combination with additional factors known to influence type 1 diabetes progression (insulin sensitivity, age and HLA status), AUC-ROC was highest for the single-Aab+ group's risk of progression at 2 years (AUC-ROC 0.723 [95% CI 0.652, 0.794]).
Conclusions/interpretation: These data suggest that HOMA2-B may have utility as a single-time-point measurement to stratify risk of type 1 diabetes development in Aab+ individuals.
Keywords: Autoantibody; Biomarker; HOMA2-B; Risk prediction; TrialNet Pathway to Prevention; Type 1 diabetes.
© 2021. The Author(s), under exclusive licence to Springer-Verlag GmbH Germany, part of Springer Nature.
Figures
Similar articles
-
The relationship between BMI and insulin resistance and progression from single to multiple autoantibody positivity and type 1 diabetes among TrialNet Pathway to Prevention participants.Diabetologia. 2016 Jun;59(6):1186-95. doi: 10.1007/s00125-016-3924-5. Epub 2016 Mar 19. Diabetologia. 2016. PMID: 26995649 Free PMC article.
-
Simplifying prediction of disease progression in pre-symptomatic type 1 diabetes using a single blood sample.Diabetologia. 2021 Nov;64(11):2432-2444. doi: 10.1007/s00125-021-05523-2. Epub 2021 Aug 2. Diabetologia. 2021. PMID: 34338806 Free PMC article.
-
β Cell dysfunction exists more than 5 years before type 1 diabetes diagnosis.JCI Insight. 2018 Aug 9;3(15):e120877. doi: 10.1172/jci.insight.120877. eCollection 2018 Aug 9. JCI Insight. 2018. PMID: 30089716 Free PMC article.
-
Beta cell function in type 1 diabetes determined from clinical and fasting biochemical variables.Diabetologia. 2019 Jan;62(1):33-40. doi: 10.1007/s00125-018-4722-z. Epub 2018 Aug 30. Diabetologia. 2019. PMID: 30167735 Free PMC article. Review.
-
The development, validation, and utility of the Diabetes Prevention Trial-Type 1 Risk Score (DPTRS).Curr Diab Rep. 2015 Aug;15(8):49. doi: 10.1007/s11892-015-0626-1. Curr Diab Rep. 2015. PMID: 26077017 Free PMC article. Review.
Cited by
-
Metabolic, genetic and immunological features of relatives of type 1 diabetes patients with elevated insulin resistance.J Endocrinol Invest. 2025 Mar;48(3):765-775. doi: 10.1007/s40618-024-02497-x. Epub 2024 Dec 10. J Endocrinol Invest. 2025. PMID: 39656436 Free PMC article.
-
Beyond Stages: Predicting Individual Time Dependent Risk for Type 1 Diabetes.J Clin Endocrinol Metab. 2024 Nov 18;109(12):3211-3219. doi: 10.1210/clinem/dgae292. J Clin Endocrinol Metab. 2024. PMID: 38712386 Free PMC article.
-
Time to reframe the disease staging system for type 1 diabetes.Lancet Diabetes Endocrinol. 2024 Dec;12(12):924-933. doi: 10.1016/S2213-8587(24)00239-0. Lancet Diabetes Endocrinol. 2024. PMID: 39608963 Review.
References
Publication types
MeSH terms
Substances
Grants and funding
- U01 DK085476/DK/NIDDK NIH HHS/United States
- U01 DK085453/DK/NIDDK NIH HHS/United States
- I01 BX001733/BX/BLRD VA/United States
- U01 DK106993/DK/NIDDK NIH HHS/United States
- U01 DK103282/DK/NIDDK NIH HHS/United States
- UC4 DK106993/DK/NIDDK NIH HHS/United States
- U01 DK061042/DK/NIDDK NIH HHS/United States
- U01 DK085509/DK/NIDDK NIH HHS/United States
- UC4 DK117009/DK/NIDDK NIH HHS/United States
- R01 DK093954/DK/NIDDK NIH HHS/United States
- R01 DK127308/DK/NIDDK NIH HHS/United States
- UC4 DK104166/DK/NIDDK NIH HHS/United States
- R21 DK119800/DK/NIDDK NIH HHS/United States
- U01 DK061010/DK/NIDDK NIH HHS/United States
- U01 DK127786/DK/NIDDK NIH HHS/United States
- U01 DK085466/DK/NIDDK NIH HHS/United States
- U01 DK103153/DK/NIDDK NIH HHS/United States
- U01 DK061058/DK/NIDDK NIH HHS/United States
- U01 DK106984/DK/NIDDK NIH HHS/United States
- U01 DK085499/DK/NIDDK NIH HHS/United States
- U01 DK107013/DK/NIDDK NIH HHS/United States
- U01 DK103266/DK/NIDDK NIH HHS/United States
- R01 DK127236/DK/NIDDK NIH HHS/United States
- U01 DK127382/DK/NIDDK NIH HHS/United States
- P30 DK097512/DK/NIDDK NIH HHS/United States
- U01 DK107014/DK/NIDDK NIH HHS/United States
- U01 DK106994/DK/NIDDK NIH HHS/United States
- U01 DK061034/DK/NIDDK NIH HHS/United States
- U01 DK085461/DK/NIDDK NIH HHS/United States
- U01 DK103180/DK/NIDDK NIH HHS/United States
- U01 DK085465/DK/NIDDK NIH HHS/United States
- U01 DK085504/DK/NIDDK NIH HHS/United States
LinkOut - more resources
Full Text Sources
Medical
Research Materials
