. 2022 May;35(3):236-244.
doi: 10.1111/sdi.13026. Epub 2021 Oct 12.

Development and validation of a risk score to prioritize patients for evaluation of access stenosis

Affiliations

Development and validation of a risk score to prioritize patients for evaluation of access stenosis

Brad C Astor et al. Semin Dial. 2022 May.

Abstract

Background: Access flow dysfunction, often associated with stenosis, is a common problem in hemodialysis access and may result in progression to thrombosis. Timely identification of accesses in need of evaluation is critical to preserving a functioning access. We hypothesized that a risk score using measurements obtained from the Vasc-Alert surveillance device could be used to predict subsequent interventions.

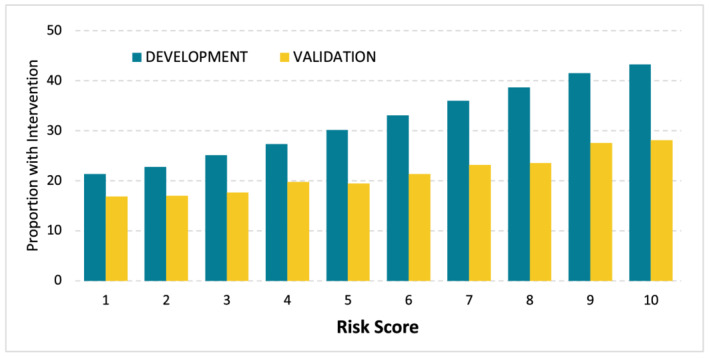
Methods: Measurement of five factors over the preceding 28 days from 1.46 million hemodialysis treatments (6163 patients) were used to develop a score associated with interventions over the subsequent 60 days. The score was validated in a separate dataset of 298,620 treatments (2641 patients).

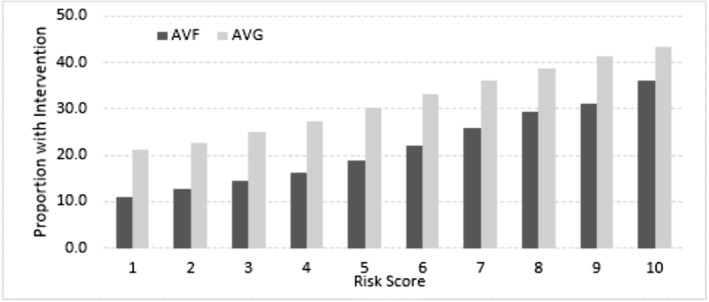
Results: Interventions in arteriovenous fistulae (AVF; n = 4125) were much more common in those with the highest score (36.2%) than in those with the lowest score (11.0). The score also was strongly associated with interventions in patients with an arteriovenous graft (AVG; n = 2,038; 43.2% vs. 21.1%). There was excellent agreement in the Validation datasets for AVF (OR = 2.67 comparing the highest to lowest score) and good agreement for AVG (OR = 1.92).

Conclusions: This simple risk score based on surveillance data may be useful for prioritizing patients for physical examination and potentially early referral for intervention.


Figures

FIGURE 1
FIGURE 1
Graphic is displaying 6 months of venous access pressure ratio results, which can be summarized mathematically by breaking the graph down into its core components, that is, amount of pressure (severity, height of the bars), number of alerts (density, number of red bars), and the rate change over time (slope) [Color figure can be viewed at wileyonlinelibrary.com]
FIGURE 2
FIGURE 2
Association of individual metrics with probability of a subsequent intervention in the next 60 days among those with an arteriovenous graft. Gray columns represent the distribution of measurements across all observations. (A) Mean venous access pressure ratio (VAPR). (B) Slope of VAPR. (C) arterial access pressure ratio (AAPR). (D) Number of VAPR alerts in the previous 28 days; (E) number of treatments with low blood flow rate in the previous 28 days
FIGURE 3
FIGURE 3
Association of individual metrics with probability of a subsequent intervention in the next 60 days among those with an arteriovenous fistula. Gray columns represent the distribution of measurements across all observations. (A) Mean venous access pressure ratio (VAPR). (B) Slope of VAPR; (C) arterial access pressure ratio (AAPR); (D) number of VAPR alerts in the previous 28 days; (E) number of treatments with low blood flow rate in the previous 28 days
FIGURE 4
FIGURE 4
The chart is displaying the proportion of dialysis treatments by their access risk score (1 to 10) associated with an intervention (angioplasty or thrombectomy) in the subsequent 60 days for patients with an arteriovenous (AV) fistula or graft [Color figure can be viewed at wileyonlinelibrary.com]
FIGURE 5
FIGURE 5
This chart indicates the agreement between the results in the Development and Validation datasets as measured by the association of each treatment by access risk score with an intervention in the subsequent 60 days for patients using an arteriovenous fistulae (AVF) [Color figure can be viewed at wileyonlinelibrary.com]
FIGURE 6
FIGURE 6
This chart indicates the agreement between the results in the Development and Validation datasets as measured by the association of each treatment by access risk score with an intervention in the subsequent 60 days for patients using an arteriovenous fistulae (AVF) [Color figure can be viewed at wileyonlinelibrary.com]

References

    1. Riella MC, Roy‐Chaudhury P. Vascular access in haemodialysis: strengthening the Achilles' heel. Nat Rev Nephrol. 2013;9(6):348‐357. - PubMed
    1. Thamer M, Lee TC, Wasse H, et al. Medicare Costs Associated With Arteriovenous Fistulas Among US Hemodialysis Patients. Am J Kidney Dis. 2018. Jul;72(1):10‐18. - PubMed
    1. Manns B, Tonelli M, Yilmaz S, et al. Establishment and maintenance of vascular access in incident hemodialysis patients: a prospective cost analysis. JASN. 2005;16(1):201‐209. - PubMed
    1. Sands JJ. Vascular access monitoring improves outcomes. Blood Purif. 2005;23(1):45‐49. - PubMed
    1. Brahmbhatt A, Misra S. The biology of hemodialysis vascular access failure. Semin Intervent Radiol. 2016;33(1):15‐20. - PMC - PubMed

Publication types

MeSH terms