. 2021 Oct 31;9(2):e0108921.
doi: 10.1128/Spectrum.01089-21. Epub 2021 Oct 13.

Routine, Cost-Effective SARS-CoV-2 Surveillance Testing Using Pooled Saliva Limits Viral Spread on a Residential College Campus

Affiliations

Routine, Cost-Effective SARS-CoV-2 Surveillance Testing Using Pooled Saliva Limits Viral Spread on a Residential College Campus

Nicole A Vander Schaaf et al. Microbiol Spectr. .

Abstract

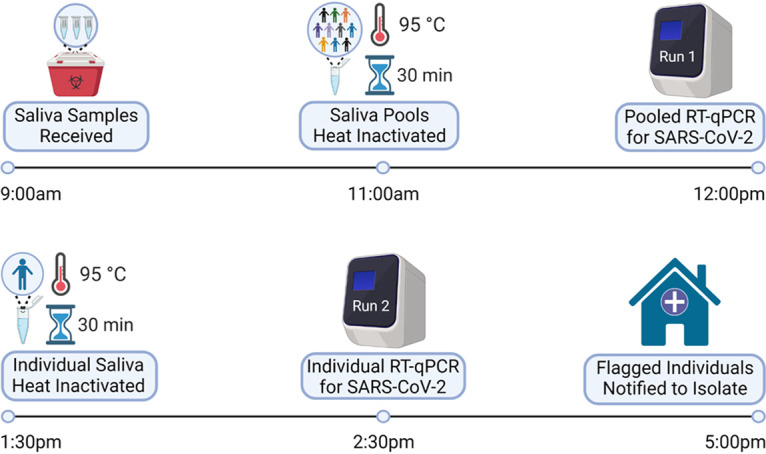
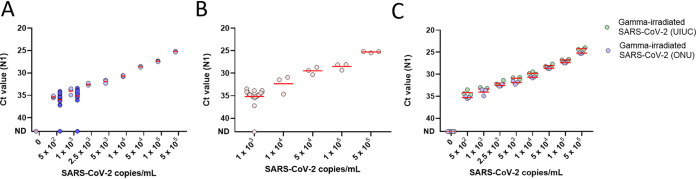
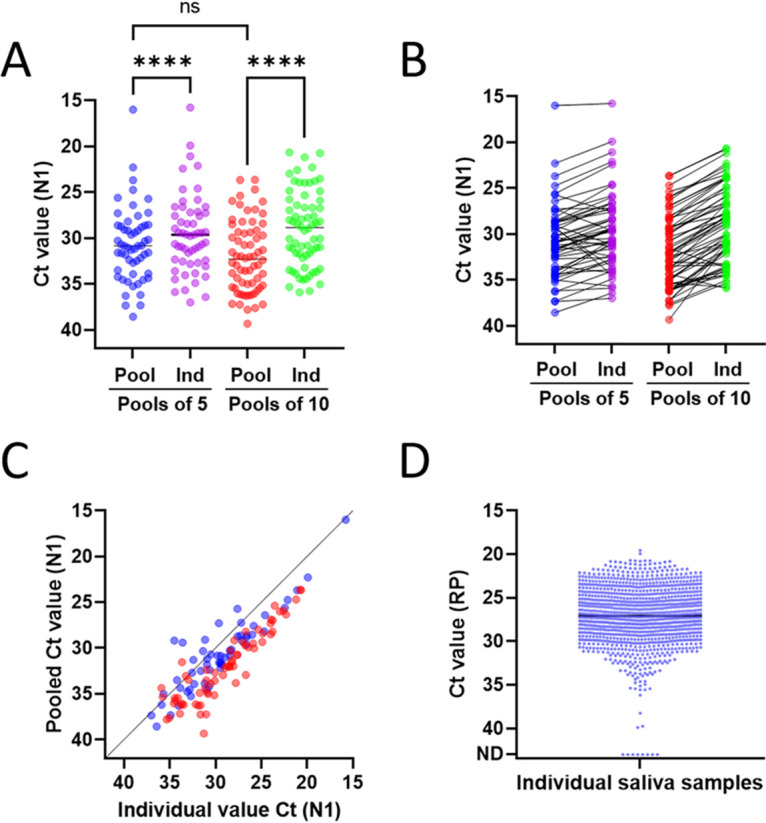
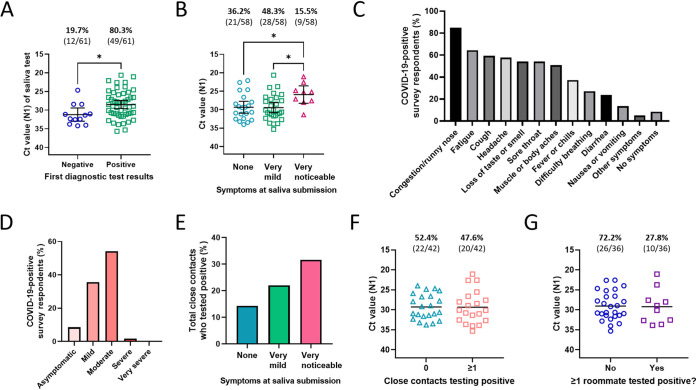
Routine testing for SARS-CoV-2 is rare for institutes of higher education due to prohibitive costs and supply chain delays. During spring 2021, we routinely tested all residential students 1 to 2 times per week using pooled, RNA-extraction-free, reverse transcription quantitative PCR (RT-qPCR) testing of saliva at a cost of $0.43/sample with same-day results. The limit of detection was 500 copies/ml on individual samples, and analysis indicates 1,000 and 2,500 copies/ml in pools of 5 and 10, respectively, which is orders of magnitude more sensitive than rapid antigen tests. Importantly, saliva testing flagged 83% of semester positives (43,884 tests administered) and was 95.6% concordant with nasopharyngeal diagnostic results (69.0% concordant on the first test when the nucleocapsid gene (N1) cycle threshold (CT) value was >30). Moreover, testing reduced weekly cases by 59.9% in the spring despite far looser restrictions, allowing for more normalcy while eliminating outbreaks. We also coupled our testing with a survey to clarify symptoms and transmissibility among college-age students. While only 8.5% remained asymptomatic throughout, symptoms were disparate and often cold-like (e.g., only 37.3% developed a fever), highlighting the difficulty with relying on symptom monitoring among this demographic. Based on reported symptom progression, we estimate that we removed 348 days of infectious individuals by routine testing. Interestingly, viral load (CT value) at the time of testing did not affect transmissibility (R2 = 0.0085), though those experiencing noticeable symptoms at the time of testing were more likely to spread the virus to close contacts (31.6% versus 14.3%). Together, our findings support routine testing for reducing the spread of SARS-CoV-2. Implementation of cost- and resource-efficient approaches should receive strong consideration in communities that lack herd immunity. IMPORTANCE This study highlights the utility of routine testing for SARS-CoV-2 using pooled saliva while maintaining high sensitivity of detection (under 2,500 copies/ml) and rapid turnaround of high volume (up to 930 samples in 8 h by two technicians and one quantitative PCR [qPCR] machine). This pooled approach allowed us to test all residential students 1 to 2 times per week on our college campus during the spring of 2021 and flagged 83% of our semester positives. Most students were asymptomatic or presented with symptoms mirroring common colds at the time of testing, allowing for removal of infectious individuals before they otherwise would have sought testing. To our knowledge, the total per-sample consumable cost of $0.43 is the lowest to date. With many communities still lagging in vaccination rates, routine testing that is cost-efficient highlights the capacity of the laboratory's role in controlling the spread of SARS-CoV-2.

Keywords: COVID-19; RT-qPCR; SARS-CoV-2; pooled; residential living; saliva; surveillance; surveillance studies.


Figures

FIG 1
FIG 1
Daily workflow for SARS-CoV-2 surveillance testing. Saliva samples were deposited by students into drop boxes around campus as early as 2 p.m. the day before their assigned test and collected at 9 a.m. each testing day. After the barcodes of each sample were scanned, saliva was pooled in groups of 5 or 10 individuals and heat-inactivated. Processed saliva was then mixed with assay reagents for detection of SARS-CoV-2 on a QuantStudio 5 qPCR machine. Flagged pools from the initial run were rerun on a second run as individual samples. Individuals associated with flagged barcodes were notified by 5 p.m. to begin isolation and to follow up with Health Services for diagnostic confirmation. This image was created by BioRender.com.
FIG 2
FIG 2
Limit of SARS-CoV-2 detection. (A) Gamma-irradiated SARS-CoV-2 was spiked into saliva from a pool of negative individuals. After the initial serial dilution was run in triplicate (light circles), the limit of detection (LOD) was confirmed by testing 20 samples near the suspected LOD (dark circles, 19/20 detected at both 500 and 1,000 copies/ml). The red lines indicate the mean. ND indicates that the SARS-CoV-2 nucleocapsid gene region 1 (N1) was not detected. (B) We tested 30 additional contrived saliva specimens—20 at 2× the LOD and the rest spanning the range of the assay. Each contrived sample contained gamma-irradiated SARS-CoV-2 spiked into a unique, negative saliva sample. The red lines indicate the mean of replicates. (C) Our LOD compares favorably to the UIUC protocol. ONU’s saliva protocol was compared with the UIUC protocol, which first dilutes saliva one-to-one with 2× TBE and then adds 0.5% Tween 20 after heat inactivation. The UIUC protocol uses 1.3× saliva sample per reaction compared to ONU’s protocol. Red lines indicate the mean of three replicates.
FIG 3
FIG 3
Pooled and individual detection of SARS-CoV-2 in human saliva. (A to C) Comparison of N1 CT values for saliva samples from pools of 5 and 10 in which SARS-CoV-2 was detected versus the deconvoluted, individually flagged sample(s) from each pool. (A) Mean and (B) paired samples over the assay range. Pools of 5 had a mean CT value difference from individuals of 1.18 (95% CI [0.69, 1.68]). Pools of 10 had a mean CT value difference from individuals of 3.05 (95% CI [2.63, 3.47]). (C) Pooled versus individual CT values for N1 demonstrate consistency of signal detection over the assay range. Pools of 5 are shown in blue, and pools of 10 are shown in red. Pools of 5, Pearson’s r(55) = 0.9038, P < 0.0001. Pools of 10, Pearson’s r(66) = 0.9108, P < 0.0001. (D) RP CT values for one replicate of each individual saliva sample analyzed on the deconvolution runs throughout the semester; this includes N1-negative individuals, which were the majority of deconvoluted samples. ****, P ≤ 0.0001; ns, not significant as determined using a Holm-Šídák multiple-comparison test.
FIG 4
FIG 4
Diagnostic outcomes, symptoms, and contagiousness of COVID-19-positive survey respondents. (A) Comparison of N1 CT values of COVID-positive survey respondents whose first diagnostic test result was negative versus positive. Error bars represent the mean with 95% confidence interval (CI). *, = P ≤ 0.05 by a two-tailed, unpaired t test. (B) Comparison of N1 CT values of students reporting various degrees of symptoms at the time of their flagged saliva test. Error bars represent the mean with 95% CI. *, P ≤ 0.05 in post hoc Tukey’s multiple-comparisons tests. (C) Symptoms experienced by COVID-19-positive survey respondents in the 1 to 2 weeks after their flagged saliva test. “Other symptoms” reported included rash, dizziness, and bruising. (D) Severity of COVID-19 symptoms for survey respondents during the 1 to 2 weeks after the flagged saliva test. Mild symptoms were defined as minor discomfort such as loss of taste/smell or like a common cold; moderate symptoms were defined as flu-like symptoms that were managed at home; severe symptoms required treatment from a doctor; and very severe symptoms required hospitalization. (E) Total (collective) percentage of close contacts who tested positive within 1 to 2 weeks after exposure to a survey respondent, categorized by symptom status of the survey respondents at the time of the flagged sample submission. The number of COVID-19-positive close contacts out of total close contacts reported are as follows: 7/49 reported by respondents without symptoms, 18/82 by those with very mild symptoms, and 6/19 by those with very noticeable symptoms. (F) Comparison of N1 CT values of survey respondents who had no or at least one close contact test positive in the 1 to 2 weeks after the respondent’s saliva was flagged. Black lines represent the mean. (G) Comparison of N1 CT values of survey respondents who did or did not have at least one roommate test positive for COVID-19 in the 1 to 2 weeks after the respondent’s saliva was flagged. Black lines represent the mean.

Similar articles

Cited by

References

    1. CDC. COVID data tracker. 2020. https://covid.cdc.gov/covid-data-tracker.
    1. Denny TN, Andrews L, Bonsignori M, Cavanaugh K, Datto MB, Deckard A, DeMarco CT, DeNaeyer N, Epling CA, Gurley T, Haase SB, Hallberg C, Harer J, Kneifel CL, Lee MJ, Louzao R, Moody MA, Moore Z, Polage CR, Puglin J, Spotts PH, Vaughn JA, Wolfe CR. 2020. Implementation of a pooled surveillance testing program for asymptomatic SARS-CoV-2 infections on a college campus: Duke University, Durham, North Carolina, August 2–October 11, 2020. MMWR Morb Mortal Wkly Rep 69:1743–1747. doi:10.15585/mmwr.mm6946e1. - DOI - PMC - PubMed
    1. Rennert L, McMahan C, Kalbaugh CA, Yang Y, Lumsden B, Dean D, Pekarek L, Colenda CC. 2021. Surveillance-based informative testing for detection and containment of SARS-CoV-2 outbreaks on a public university campus: an observational and modelling study. Lancet Child Adolesc Health 5:428–436. doi:10.1016/S2352-4642(21)00060-2. - DOI - PMC - PubMed
    1. Paltiel AD, Zheng A, Walensky RP. 2020. Assessment of SARS-CoV-2 screening strategies to permit the safe reopening of college campuses in the United States. JAMA Netw Open 3:e2016818. doi:10.1001/jamanetworkopen.2020.16818. - DOI - PMC - PubMed
    1. Losina E, Leifer V, Millham L, Panella C, Hyle EP, Mohareb AM, Neilan AM, Ciaranello AL, Kazemian P, Freedberg KA. 2021. College campuses and COVID-19 mitigation: clinical and economic value. Ann Intern Med 174:472–483. doi:10.7326/M20-6558. - DOI - PMC - PubMed

Publication types

Substances

Grants and funding