. 2021 Oct 4;62(13):7.
doi: 10.1167/iovs.62.13.7.

Neutrophil-Derived Proteases Contribute to the Pathogenesis of Early Diabetic Retinopathy

Affiliations

Neutrophil-Derived Proteases Contribute to the Pathogenesis of Early Diabetic Retinopathy

Emma M Lessieur et al. Invest Ophthalmol Vis Sci. .

Abstract

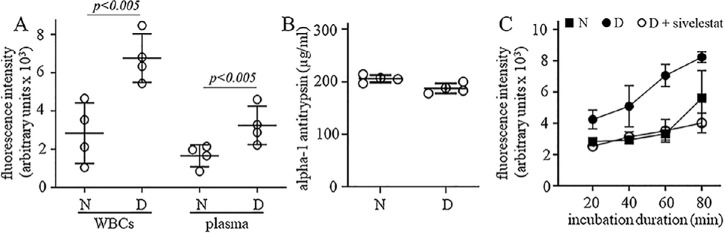
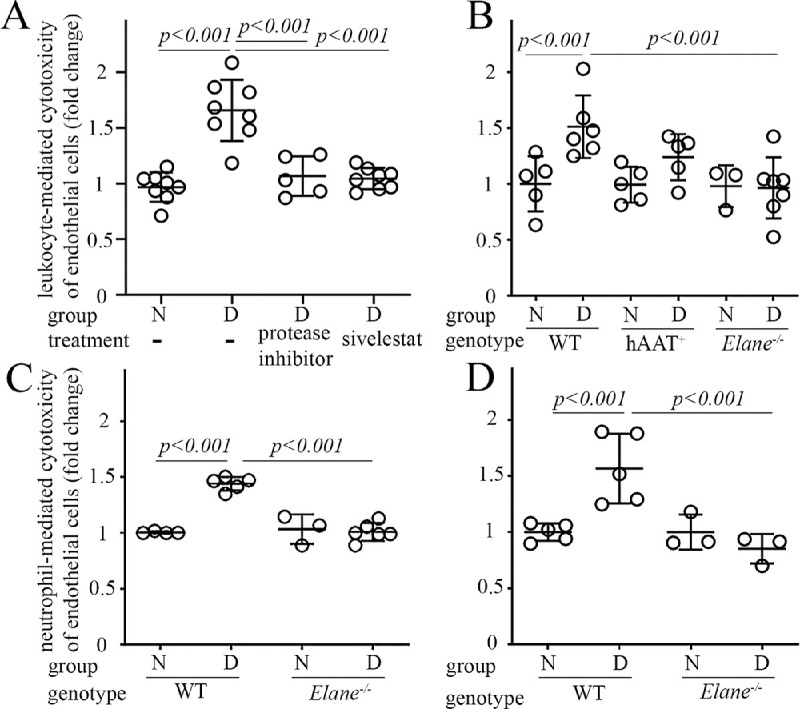
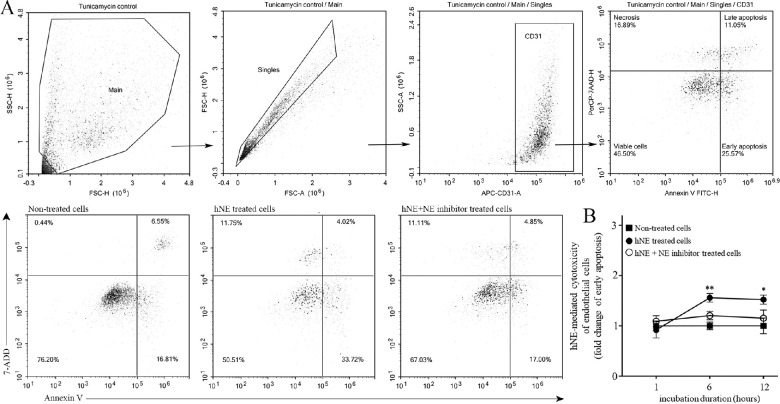
Purpose: Previous studies indicate that leukocytes, notably neutrophils, play a causal role in the capillary degeneration observed in diabetic retinopathy (DR), however, the mechanism by which they cause such degeneration is unknown. Neutrophil elastase (NE) is a protease released by neutrophils which participates in a variety of inflammatory diseases. In the present work, we investigated the potential involvement of NE in the development of early DR.

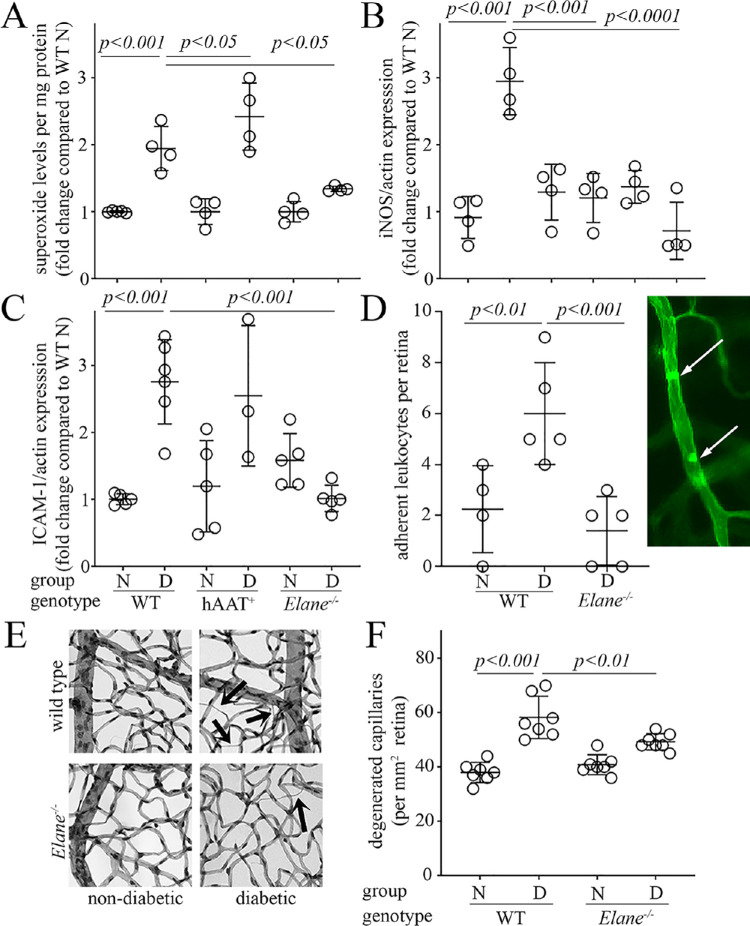
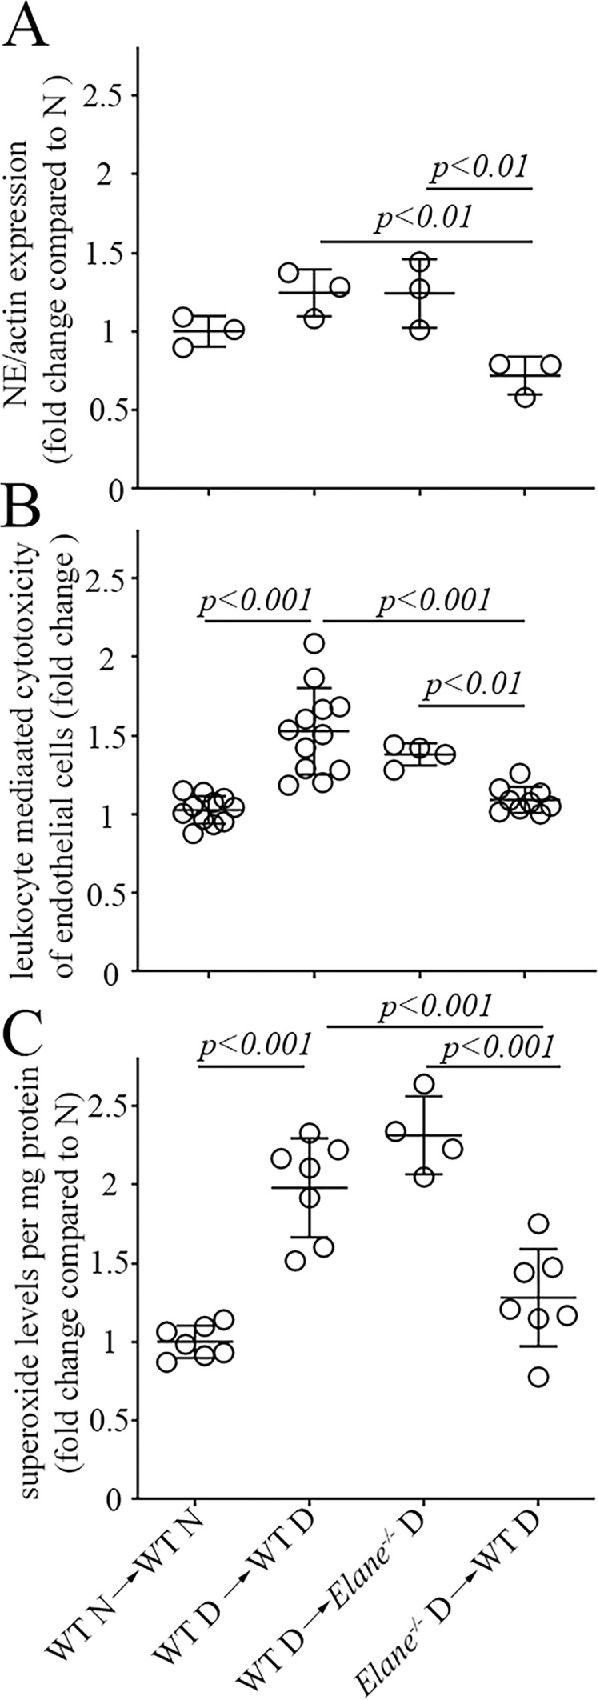
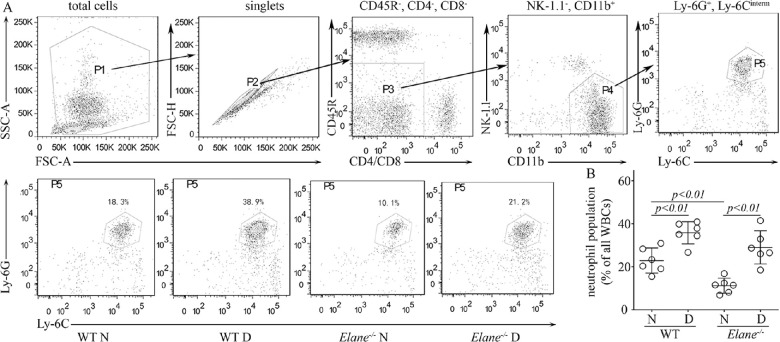
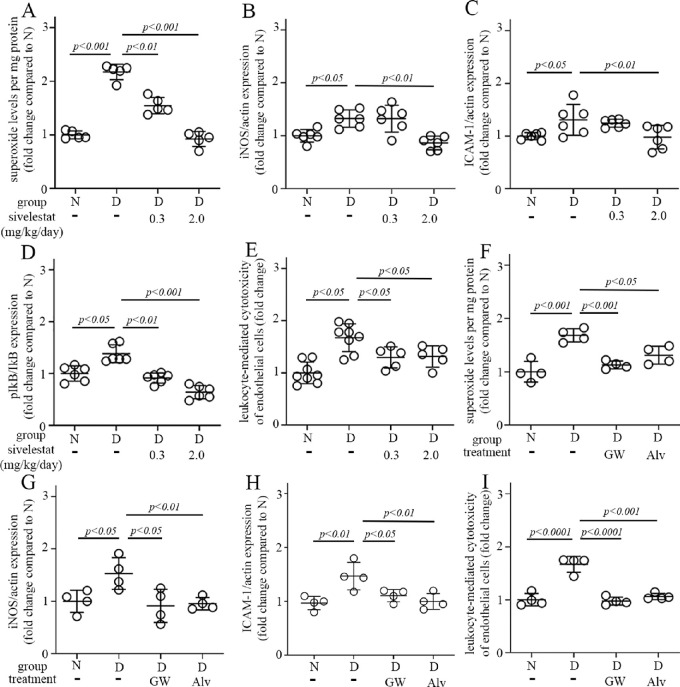
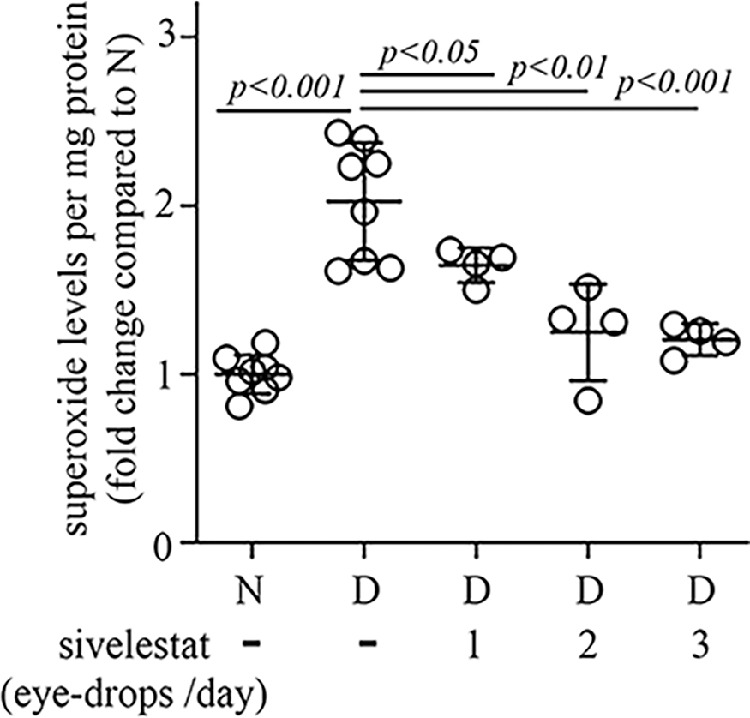
Methods: Experimental diabetes was induced in NE-deficient mice (Elane-/-), in mice treated daily with the NE inhibitor, sivelestat, and in mice overexpressing human alpha-1 antitrypsin (hAAT+). Mice were assessed for diabetes-induced retinal superoxide generation, inflammation, leukostasis, and capillary degeneration.

Results: In mice diabetic for 2 months, deletion of NE or selective inhibition of NE inhibited diabetes-induced retinal superoxide levels and inflammation, and inhibited leukocyte-mediated cytotoxicity of retinal endothelial cells. In mice diabetic for 8 months, genetic deletion of NE significantly inhibited diabetes-induced retinal capillary degeneration.

Conclusions: These results suggest that a protease released from neutrophils contributes to the development of DR, and that blocking NE activity could be a novel therapy to inhibit DR.


Conflict of interest statement

Disclosure: E.M. Lessieur, None; H. Liu, None; A. Saadane, None; Y. Du, None; J. Tang, None; J. Kiser, None; T.S. Kern, None

Figures

Figure 1.
Figure 1.
Protease activity in diabetes. Protease activity was increased in (A) leukocytes and plasma of mice diabetic for 2 months. The increase (B) could not be attributed to a change in plasma hAAT level, but (C) could be inhibited in vitro by sivelestat (100 µM). The protease activity in WBCs and plasma was determined using the EnzCheck Elastase Assay Kit, and the amount of AAT in plasma was determined by ELISA. N, non-diabetic; D, diabetic. Data are expressed as mean ± SD. Graphs represent the combined results of 2 to 3 experiments; n = 4 to 6 per group; P < 0.05 is significant.
Figure 2.
Figure 2.
The diabetes-induced increase in cytotoxicity of leukocytes (A, B) or neutrophils (C, D) against retinal endothelial cells is mitigated by inhibition of proteases or NE in vitro for 6 hours or deletion of NE (Elane/). Damage to retinal endothelial cells was determined by flow cytometry. The duration of diabetes was 2 months in panels A to C or 8 months in panel D. The Y-axis legend in A and C applies for B and D graphs. N, nondiabetic; D, diabetic. Data are normalized to N and expressed as mean ± SD. Graphs represent the combined results of 2 to 3 experiments; n = 6–12 per group; P < 0.05 is significant.
Figure 3.
Figure 3.
Effect of human NE on mRECs apoptosis. (A) Plots along with gating strategies to determine early and late apoptosis in endothelial cells are depicted. Top panels – tunicamycin (10 µg/mL) was used as positive control to define the quadrants. FSC-H versus SSC-H dot plot (Main) are gated to eliminate debris and then singlet cell (Singles) was selected on FSC-A versus FSC-H. Endothelial cells were gated on CD31 to confirm cell population. Annexin V was used to determine apoptosis and 7-ADD was used to determine cell viability. Bottom panels – Representative flow dot plots from non-treated, hNE treated cells (50 nmol/L) and hNE plus GW311616A inhibitor (GW 150 µMol/L) with quadrants representing endothelial cells in various stages. (B) Early apoptosis is summarized in the graph. All conditions were performed in triplicates. Results are the combination of two experiments. Data are normalized to non-treated cells and expressed as mean ± SD, n = 6 per condition; *P < 0.05, **P < 0.01.
Figure 4.
Figure 4.
Effects of Elane deletion, and overexpression of hAAT on diabetes-induced increases in superoxide and inflammatory markers in the retina, leukostasis within the retinal vasculature, and degeneration of retinal capillaries. Retinal superoxide (A) was detected by lucigenin luminescence using freshly isolated retinas, and expression of iNOS and ICAM-1 (B, C) were evaluated by Western blots. X-axis legend in panel C applies also to panels A and B. Leukostasis in retinal microvessels (D) was assessed by injection of fluorescein-coupled concanavalin A lectin, followed by perfusion to remove unbound blood cells, and then quantitation of adherent cells via fluorescence microscopy. A representative image of leukostasis from diabetic animals is shown as an inset panel in D (white arrows). (E, F) Show the effects of diabetes and Elane/ on retinal vascular pathology, with representative micrographs of retinal vasculature for each group. Black arrows indicate typical degenerated capillaries. (F) summarizes the numbers of degenerated (acellular) capillaries in the various groups at 8 months of diabetes (10 months of age). Duration of diabetes was 2 months for panels A to D, and 8 months for panels E and F. N, nondiabetic; D, diabetic. Data are expressed as mean ± SD. Graphs represent the combined results of 2 to 3 experiments; n = 4 to 7 per group; P < 0.05 is significant.
Figure 5.
Figure 5.
Chimeric animals constructed to lack Elane only in bone marrow-derived cells successfully reduced expression of NE in leukocytes (A) and inhibited the diabetes-induced increase in leukocyte-mediated endothelial cell cytotoxicity (B) and in retinal superoxide (C). None of these changes were detected when only marrow-derived cells still expressed NE. The expression of NE was determined by Western blotting, leukocyte-mediated cytotoxicity toward endothelial cells was quantitated by flow cytometry, and retinal superoxide was determined by lucigenin luminescence. WT N → WT N indicates nondiabetic WT controls in which WT marrow is injected into irradiated WT N animals. WT D → WT D indicates diabetic WT controls in which WT marrow is injected into irradiated WT D animals. WT D → Elane/ D indicates mice in which marrow from WT diabetic mice is injected into irradiated diabetic Elane/ mice. Elane/ D → WT D indicates mice in which marrow from diabetic Elane/ mice is injected into irradiated WT diabetic mice. The legend for the X axis in C applies also to A and B. Duration of diabetes was 3 months (duration after irradiation 2–3 months). Data are normalized to WT N → WT N and expressed as mean ± SD; n = 4 to 12 per group; P < 0.05 is significant.
Figure 6.
Figure 6.
Peripheral blood phenotyping by flow cytometry. (A) Plots along with gating strategies for neutrophils in the blood of WT and Elane/ mice are depicted. Top panels – FSC-A versus SSC-A dot plot (P1) are gated to eliminate debris and then singlet cell (P2) was selected on FSC-A versus FSC-H. Non-lymphocyte population was gated on CD11b+ (P3 and P4) to eliminate T cells (CD4+ and CD8+), B cells (CD45R+), and NK cells (NK1.1+), then Ly6G and Ly6C antibodies were used to define the neutrophil (Ly6G+Ly6Cinterm) where classical monocytes (Ly6GLy6Chigh) and nonclassical monocytes (Ly6GLy6Clow) were eliminated. Bottom panels – Flow dot plots represent neutrophils in various groups. (B) Graph summarizes the neutrophil population per genotype. Mice are 8 months of diabetes; n = 6 per group.
Figure 7.
Figure 7.
Pharmacologic inhibition of NE mitigates diabetes-induced abnormalities in retinal superoxide (A) and expression of pro-inflammatory proteins (B–D), as well as leukocyte-mediated cytotoxicity to retinal endothelial cells (E). Sivelestat was administered IP daily at a dosage of 0.3 or 2.0 mg/kg/day. Similar results were shown in diabetic mice treated with other two NE inhibitors – GW311616A (GW) at a dosage of 4 mg/kg/injection twice a week and alvelestat (Alv) at a dosage of 2 mg/kg/day (F–I). Total duration of diabetes was 10 weeks, drug treatment was 8 weeks. Data are expressed as mean ± SD. Graphs represent the combined results of 2 to 3 experiments; n = 4 to 8 per group; P < 0.05 is significant.
Figure 8.
Figure 8.
Retinal superoxide was inhibited in diabetic mice receiving daily treatment with 3% sivelestat eye drops (once, twice, or 3 times per day) compared to nontreated diabetic mice. Total duration of diabetes was 10 weeks, drug treatment was 8 weeks. Data are expressed as mean ± SD; n = 4 to 8 per group; P < 0.05 is significant.

References

    1. Ogurtsova K, da Rocha Fernandes JD, Huang Y, et al. .. IDF Diabetes Atlas: Global estimates for the prevalence of diabetes for 2015 and 2040. Diabetes Res Clin Pract. 2017; 128: 40–50. - PubMed
    1. Lee R, Wong TY, Sabanayagam C. Epidemiology of diabetic retinopathy, diabetic macular edema and related vision loss. Eye Vis (Lond). 2015; 2: 17. - PMC - PubMed
    1. Joussen AM, Poulaki V, Le ML, et al. .. A central role for inflammation in the pathogenesis of diabetic retinopathy. FASEB J. 2004; 18: 1450–1452. - PubMed
    1. Kern TS. Contributions of inflammatory processes to the development of the early stages of diabetic retinopathy. Exp Diabetes Res. 2007; 2007: 95103. - PMC - PubMed
    1. Pavlovic D, Leteux C, Ovchinnikova T, Tsvetkov Y, Nifant'ev N, Feizi T. Chemically synthesized solid phase oligosaccharide probes for carbohydrate-binding receptors. Interactions of the E-, L- and P-selectins with sialyl-Le(x) and O-sulphated forms linked to biotin or to polyacrylamide. J Immunologic Methods. 2002; 264: 53–58. - PubMed

Publication types

Substances