. 2021 Oct 15;7(42):eabh4394.
doi: 10.1126/sciadv.abh4394. Epub 2021 Oct 13.

Positronium imaging with the novel multiphoton PET scanner

Affiliations

Positronium imaging with the novel multiphoton PET scanner

Paweł Moskal et al. Sci Adv. .

Abstract

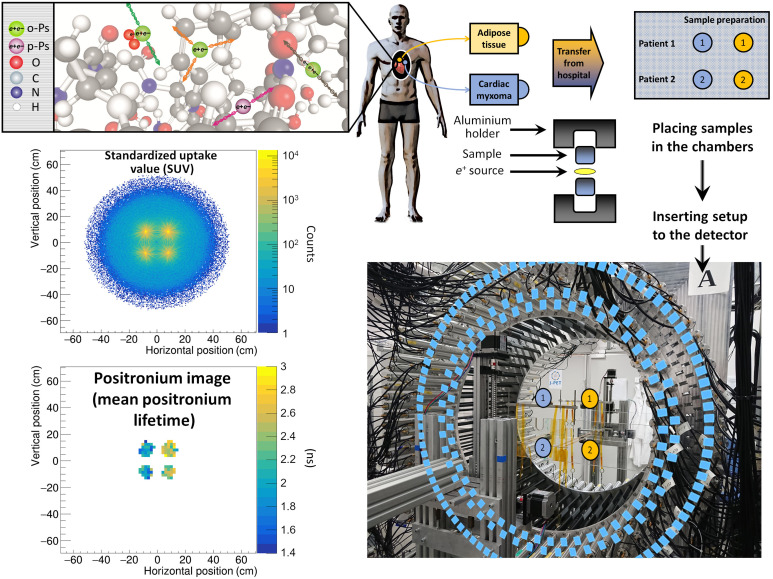
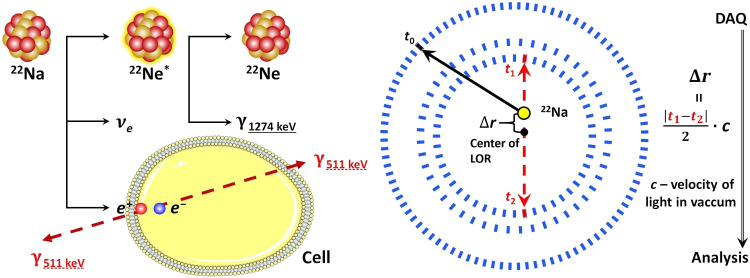
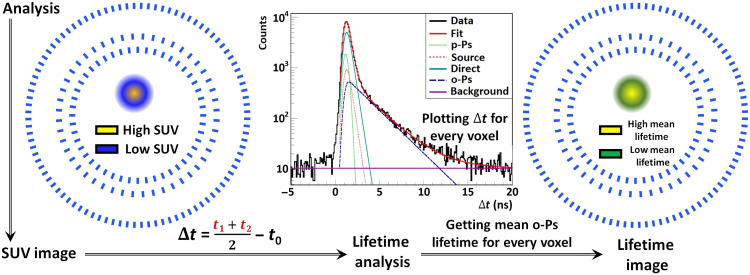
In vivo assessment of cancer and precise location of altered tissues at initial stages of molecular disorders are important diagnostic challenges. Positronium is copiously formed in the free molecular spaces in the patient’s body during positron emission tomography (PET). The positronium properties vary according to the size of inter- and intramolecular voids and the concentration of molecules in them such as, e.g., molecular oxygen, O2; therefore, positronium imaging may provide information about disease progression during the initial stages of molecular alterations. Current PET systems do not allow acquisition of positronium images. This study presents a new method that enables positronium imaging by simultaneous registration of annihilation photons and deexcitation photons from pharmaceuticals labeled with radionuclides. The first positronium imaging of a phantom built from cardiac myxoma and adipose tissue is demonstrated. It is anticipated that positronium imaging will substantially enhance the specificity of PET diagnostics.


Figures

Fig. 1.
Fig. 1.. The measurement scheme and the determined SUV and positronium images.
The top left panel illustrates a part of a hemoglobin molecule with superimposed schemes, indicating decays of o-Ps (green circles) and parapositronium (p-Ps) (violet circle). o-Ps may undergo self-annihilation (pink arrows), pickoff process (gray arrows), or conversion to parapositronium, e.g., by interacting with oxygen molecule (green arrows). The top right panel shows the first part of the experimental workflow. Four samples from two patients were collected and divided into two classes: cardiac myxoma and adipose tissue. Each sample was inserted into a holder with the radioactive 22Na source, which was inserted into the J-PET detector. The blue and yellow circles show the locations of the samples during the measurement. Methods to reconstruct the image analogs to that of the SUV image (annihilation rate distribution) and positronium lifetime image are described in Methods. Reconstructed mean o-Ps lifetime in cardiac myxoma (1.9 ns) differs from the mean o-Ps lifetime in adipose tissue (2.6 ns). More comprehensive studies confirming the differences in the o-Ps mean lifetime in the healthy adipose tissue and cardiac myxoma tumor are described in the article to be submitted elsewhere (44). Photo credit: Kamil Dulski, Jagiellonian University.
Fig. 2.
Fig. 2.. Experiment workflow.
The 22Na radionuclide emitting positron and prompt gamma is used as a source of positrons. They can annihilate with the electrons from the molecules of the cell. The annihilation photons and prompt gamma interact in the scintillator strips (blue rectangles) of the J-PET detector; this results in the production of signals that are sampled by the front-end electronics (41), digitized, and collected by a data acquisition (DAQ) system (43). A single event of interest comprises the information of the position and time (xi, yi, zi, ti) for each registered photon. The events, in which the detector registers two annihilation photons and one prompt gamma, are selected for further analysis. The reconstructed positions of the annihilation photons, (x1,y1,z1) and (x2,y2,z2), enable the reconstruction of the so-called line of response (LOR), indicated by the red dashed line, which comprises the point of annihilation (yellow circle). Analysis part of the experiment is given in Fig. 3.
Fig. 3.
Fig. 3.. Analysis of the experiment.
Experiment conducted as in Fig. 2 was analyzed by the following procedure. The distribution of the reconstructed positions of the annihilations constitutes the SUV image [a pictorial example of this image is shown in (left)]. The photons resulting from the deexcitation of the 22Ne* can be used to calculate the positron annihilation lifetime (Δt) distribution for every voxel in the SUV image. The decomposition of the Δt distribution [an example distribution for cardiac myxoma tissue is shown in (middle)] allows us to distinguish components coming from the parapositronium (light green dashed line) and o-Ps (dark blue dashed line). It also distinguishes processes such as direct annihilation of the positron and the electron without producing positronium (direct; turquoise line) and from the annihilations in the source material (source; red dashed line). In addition, the signal from accidental coincidences is visible (background; violet line). The positronium image [shown pictorially in (right)] has each voxel filled with the value of the mean o-Ps lifetime, and it is obtained from the decomposition of the Δt distribution.
Fig. 4.
Fig. 4.. Event selection procedure.
The top left panel (A) represents the distribution of the multiplicity of the hits. In this analysis, only the events with three hits (signals registered in three scintillator strips) were taken into account. The top middle panel (B) describes the signal sampling method. The dots represent the crossing of signals with the preset voltage threshold. Each dot corresponds to the measurement of the time (time stamp) that is digitized and collected by the electronic readouts and DAQ system. The area of the signal is approximated by the weighted mean of the TOT values. In the analysis, as the TOT characterizes the energy loss (62), the sum of the TOT values measured at both sides (side A and B) of the scintillator strip is used. The top right panel (C) represents the TOT distribution. The Compton edges for 511- and 1275-keV photons are visible at 18 and 33 ns, respectively. The red and gray regions indicate the TOT range used for the identification of the annihilation and prompt photons, respectively. (D and E) The example of possible background events where one of the annihilation photons was not registered; instead, another annihilation photon (D) (dashed red arrow) or a prompt photon (E) (solid black arrow) was scattered twice. The bottom left panel (F) shows the distribution of δtij for a given pair of hits (i,j). The events corresponding to the scatterings in the detector are suppressed by the selection of the δt values in the range indicated in red.
Fig. 5.
Fig. 5.. Positron annihilation lifetime spectra.
The middle panel shows the SUV image (as in Fig. 1) in the range from −30 to 30 cm. On the left and right sides of the SUV image, the exemplary positron lifetime spectra (Δt) are shown for the regions that are marked as blue and yellow circles. The positron annihilation components were estimated by fitting these spectra with the PALS Avalanche software program (51, 52), which is dedicated for the J-PET detector. The exponential tail is similar for the samples on the right (o-Ps crossing background line near 12 ns) and on the left (o-Ps crossing the background line near 10 ns) separately. The model function is given by Fit(Δt), which is a convolution of the exponential and Gaussian functions. Fits are in a very good agreement with the data confirmed by the values of the resulting adjusted R2 = 0.999 for all of the fits and reduced χ2 values: (top left) 0.999, (bottom left) 1.067, (top right) 1.039, and (bottom right) 1.253. The resulting fitted parameters of each component for each sample are shown in Table 2. The amplitudes of the individual components for the same type of the samples (myxoma or adipose) differ by only 7% relative value. The mean o-Ps lifetimes for the cardiac myxoma samples are equal to (top left) 1.950 (19) ns and (bottom left) 1.874 (20) ns with an intensity of (top left) 21.39 (47)% and (bottom left) 23.27 (45)%. For the adipose tissue, the mean o-Ps lifetimes are equal to (top right) 2.645 (27) ns and (bottom right) 2.581 (30) ns with an intensity of (top right) 21.49 (41)% and (bottom right) 21.56 (54)%.

References

    1. Moskal P., Stępień E. Ł., Prospects and clinical perspectives of total-body PET imaging using plastic scintillators. PET Clin. 15, 439–452 (2020). - PubMed
    1. Schmall J. P., Karp J. S., Alavi A., The potential role of total body pet imaging in assessment of atherosclerosis. PET Clin. 14, 245–250 (2019). - PubMed
    1. McKenney-Drake M. L., Moghbel M. C., Paydary K., Alloosh M., Houshmand S., Moe S., Salavati A., Sturek J. M., Territo P. R., Weaver C., Werner T. J., Høilund-Carlsen P. M., Sturek M., Alavi A., 18 f-naf and 18 f-fdg as molecular probes in the evaluation of atherosclerosis. Eur. J. Nucl. Med. Mol. Imaging 45, 2190–2200 (2018). - PMC - PubMed
    1. Badawi R. D., Shi H., Hu P., Chen S., Xu T., Price P. M., Ding Y., Spencer B. A., Nardo L., Liu W., Bao J., Jones T., Li H., Cherry S. R., First human imaging studies with the EXPLORER total-body PET scanner. J. Nucl. Med. 60, 299–303 (2019). - PMC - PubMed
    1. Karp J. S., Viswanath V., Geagan M. J., Muehllehner G., Pantel A. R., Parma M. J., Perkins A. E., Schmall J. P., Werner M. E., Daube-Witherspoon M. E., PennPET explorer: Design and preliminary performance of a whole-body imager. J. Nucl. Med. 61, 136–143 (2020). - PMC - PubMed

LinkOut - more resources