. 2021 Oct 13;13(615):eabf7860.
doi: 10.1126/scitranslmed.abf7860. Epub 2021 Oct 13.

Epigenetically defined therapeutic targeting in H3.3G34R/V high-grade gliomas

Affiliations

Epigenetically defined therapeutic targeting in H3.3G34R/V high-grade gliomas

Stefan R Sweha et al. Sci Transl Med. .

Abstract

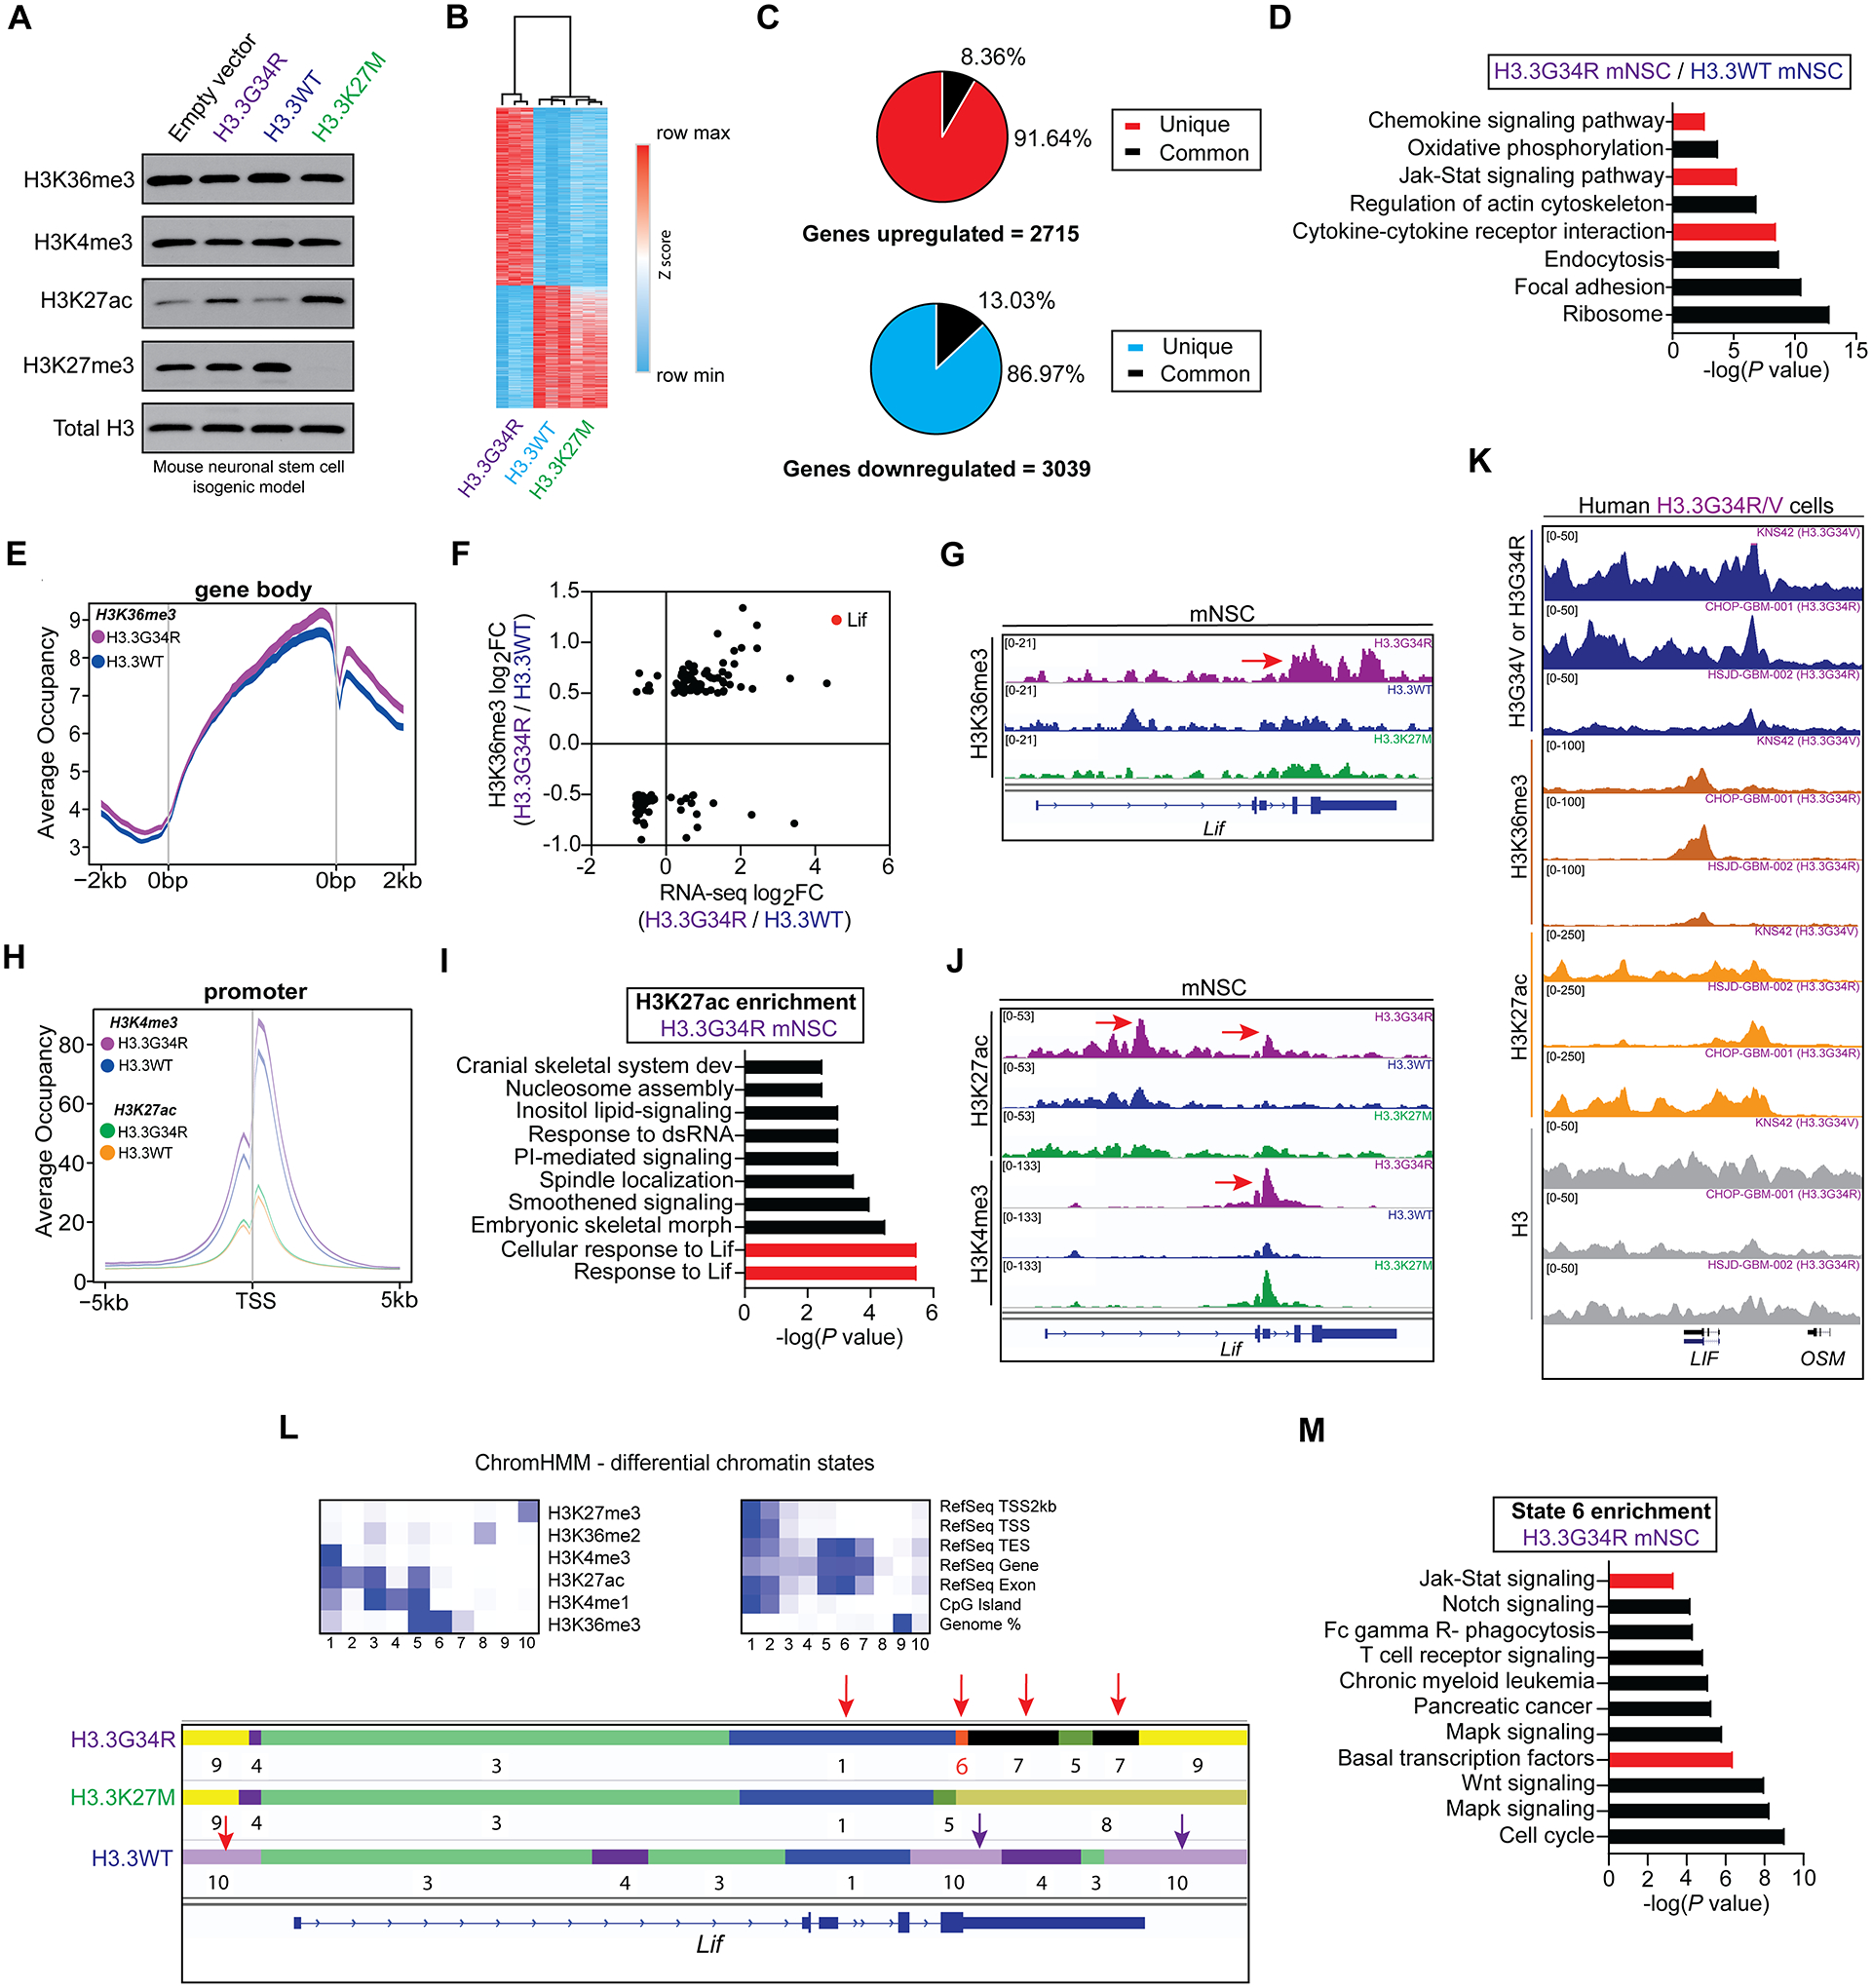
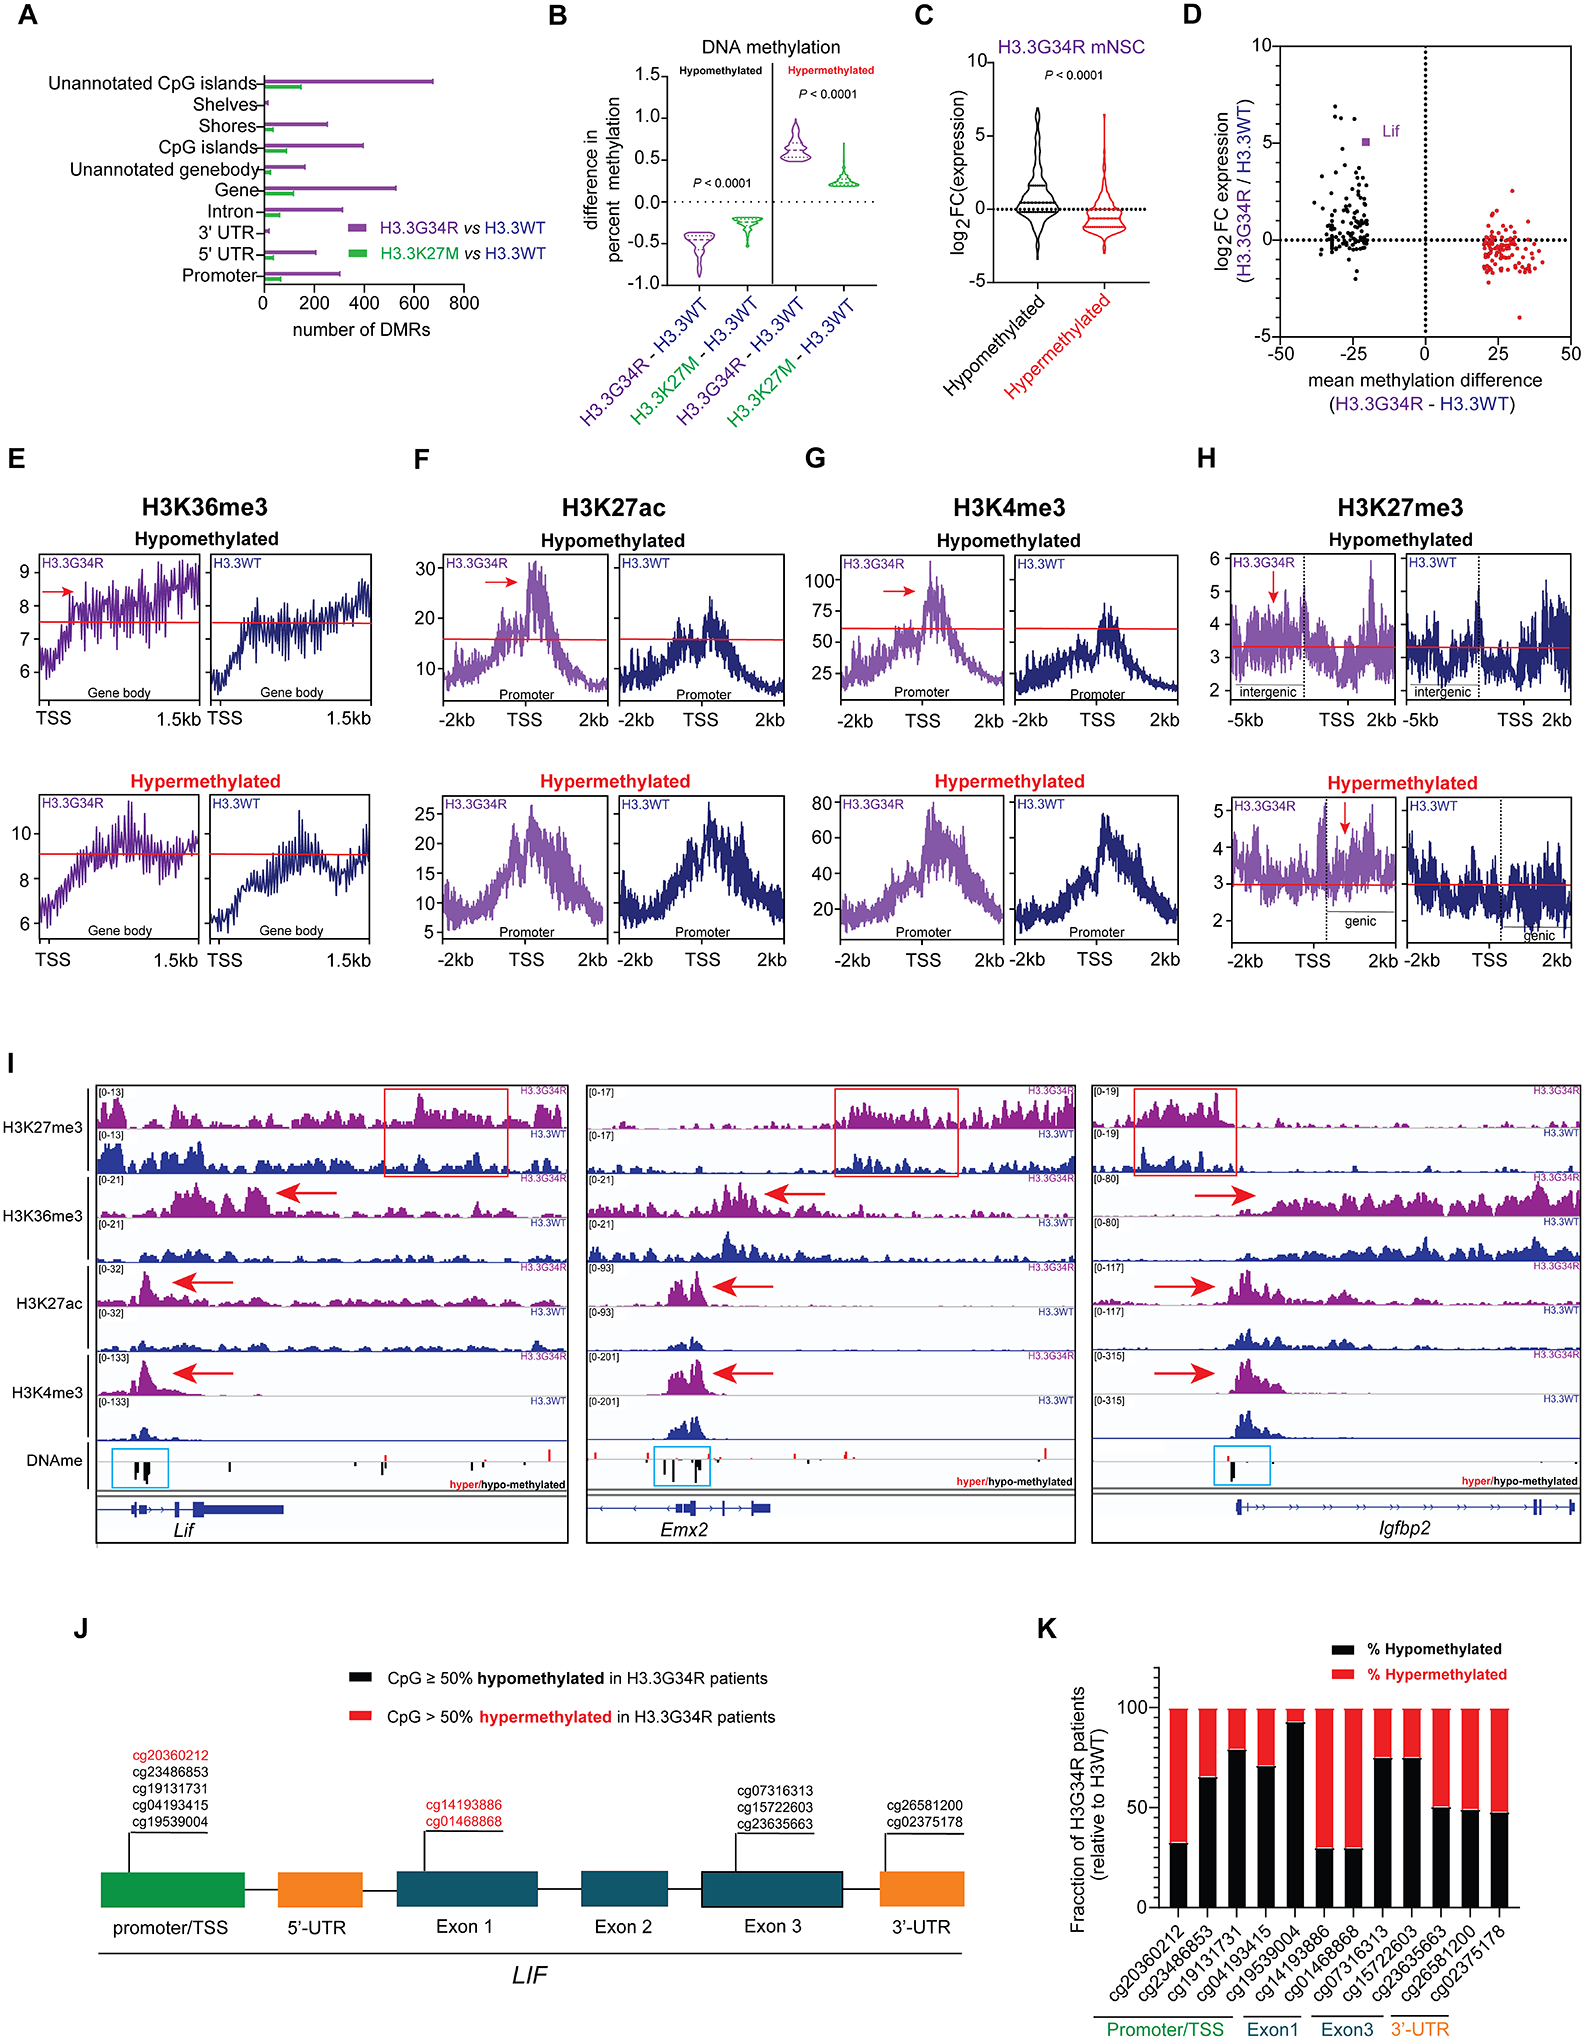
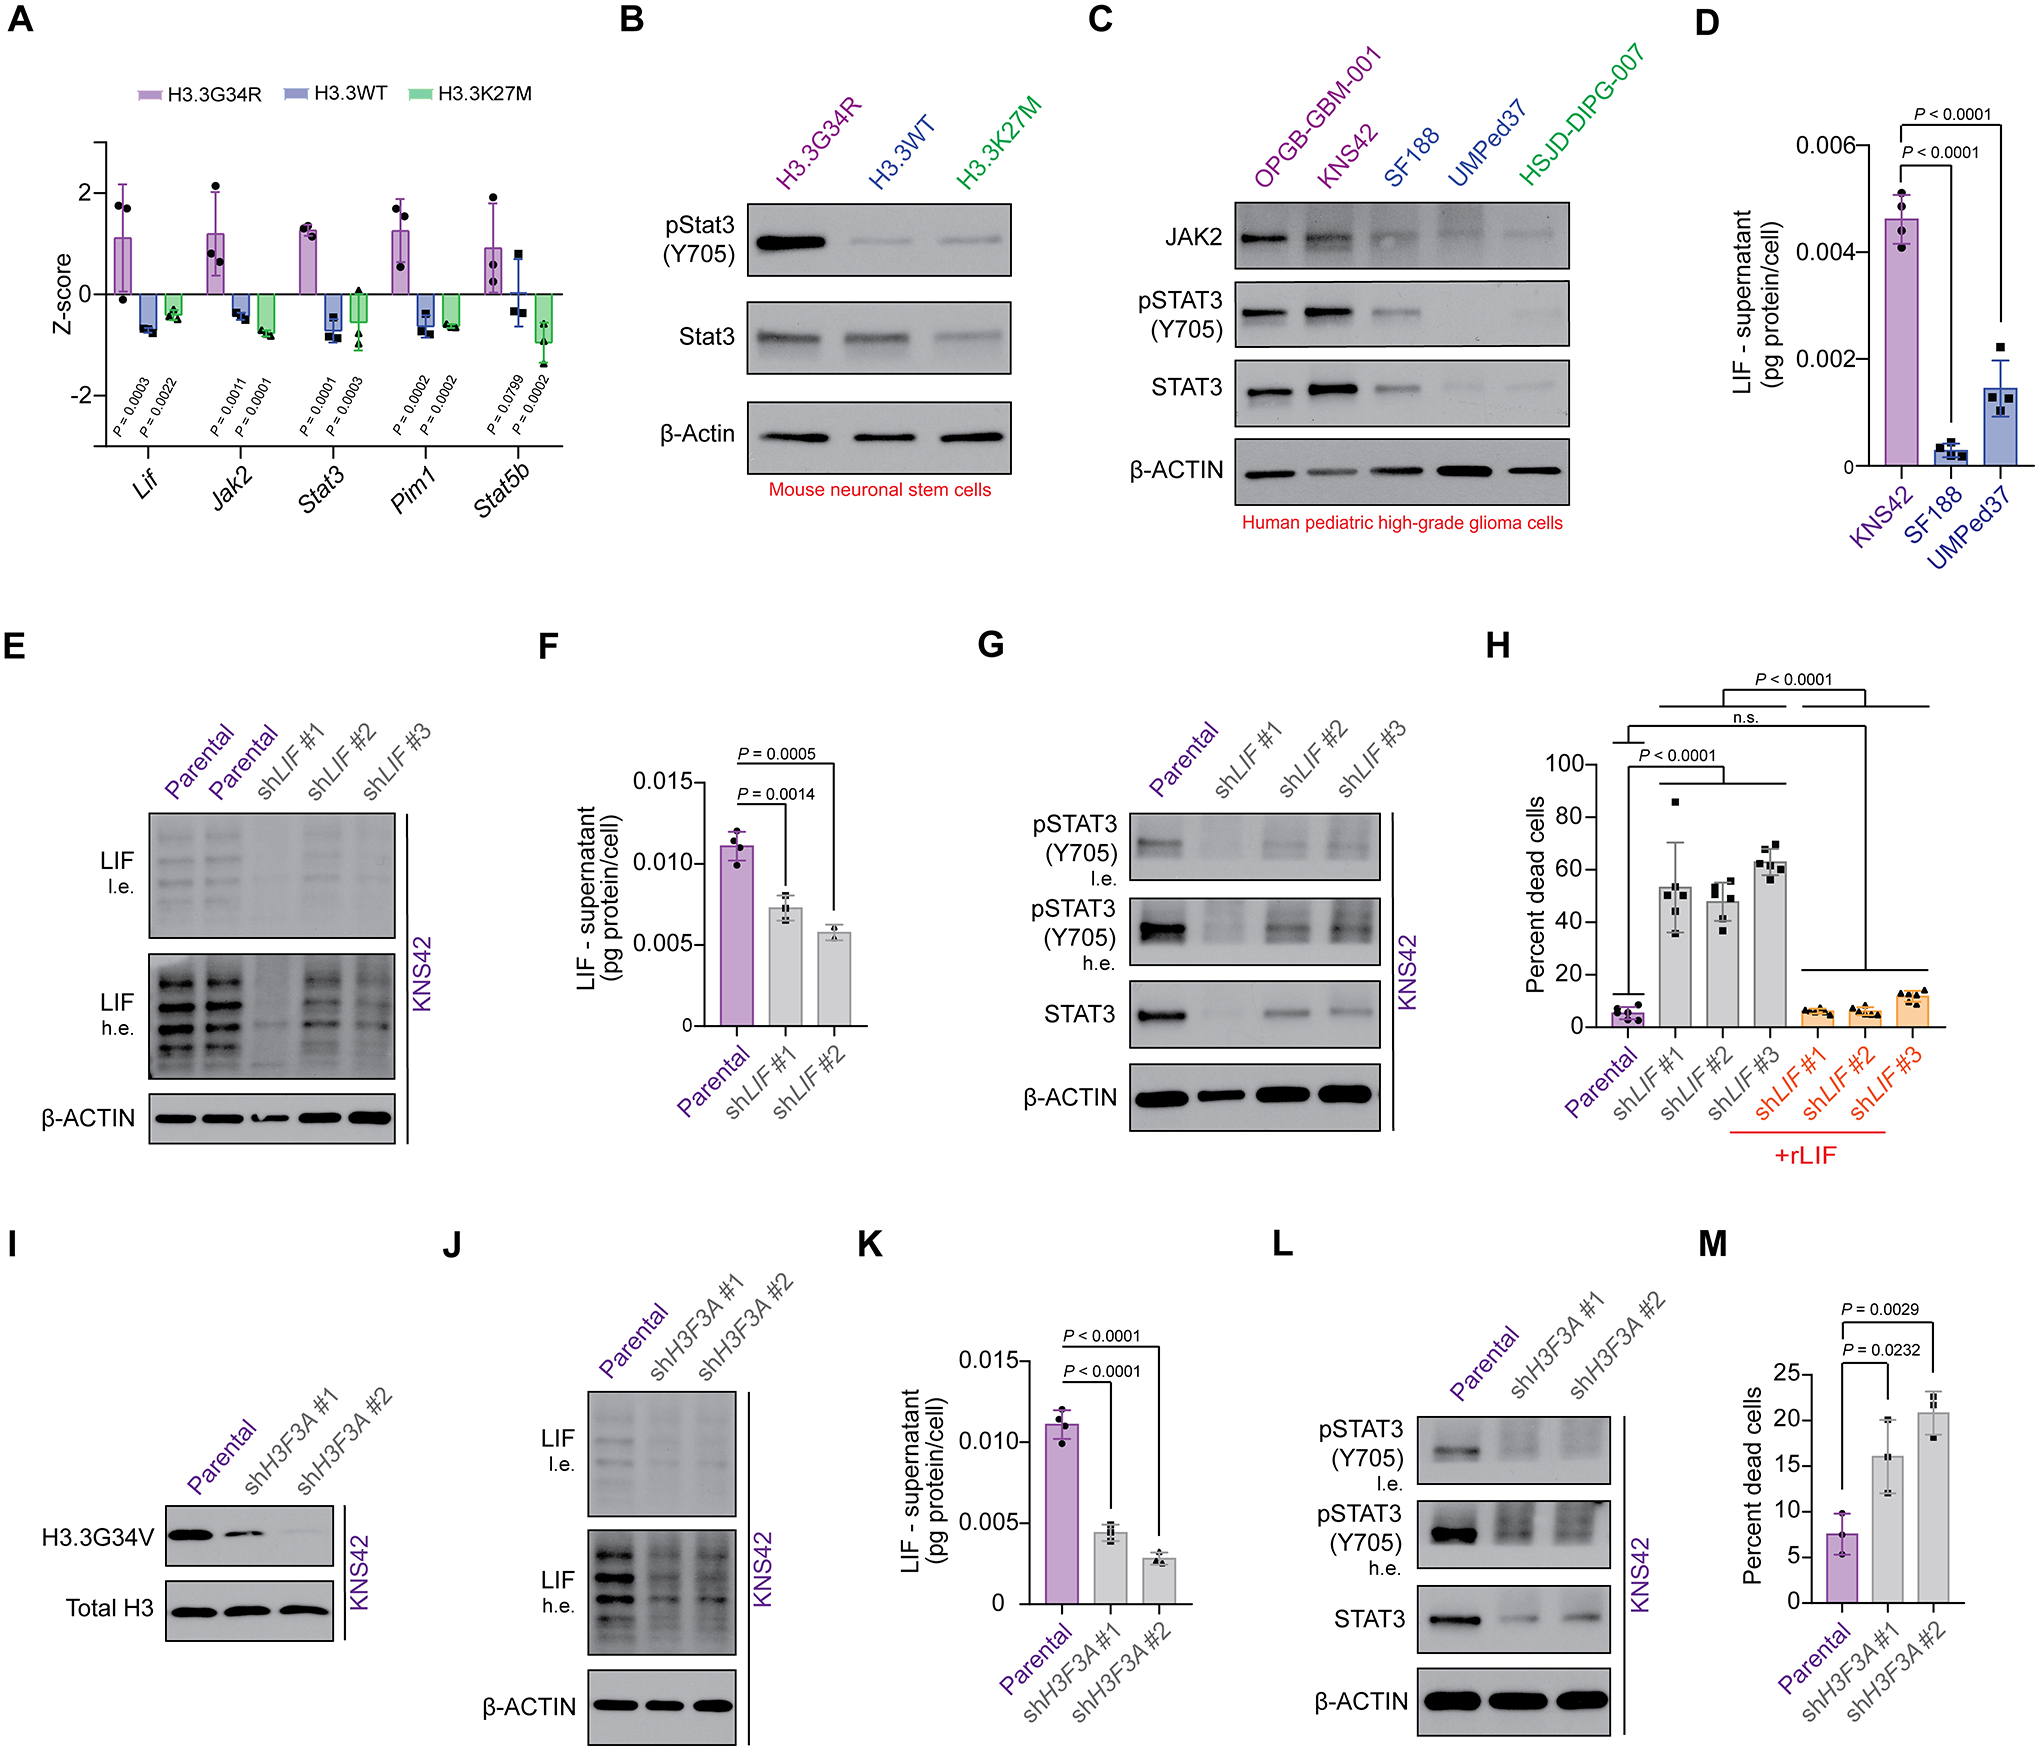
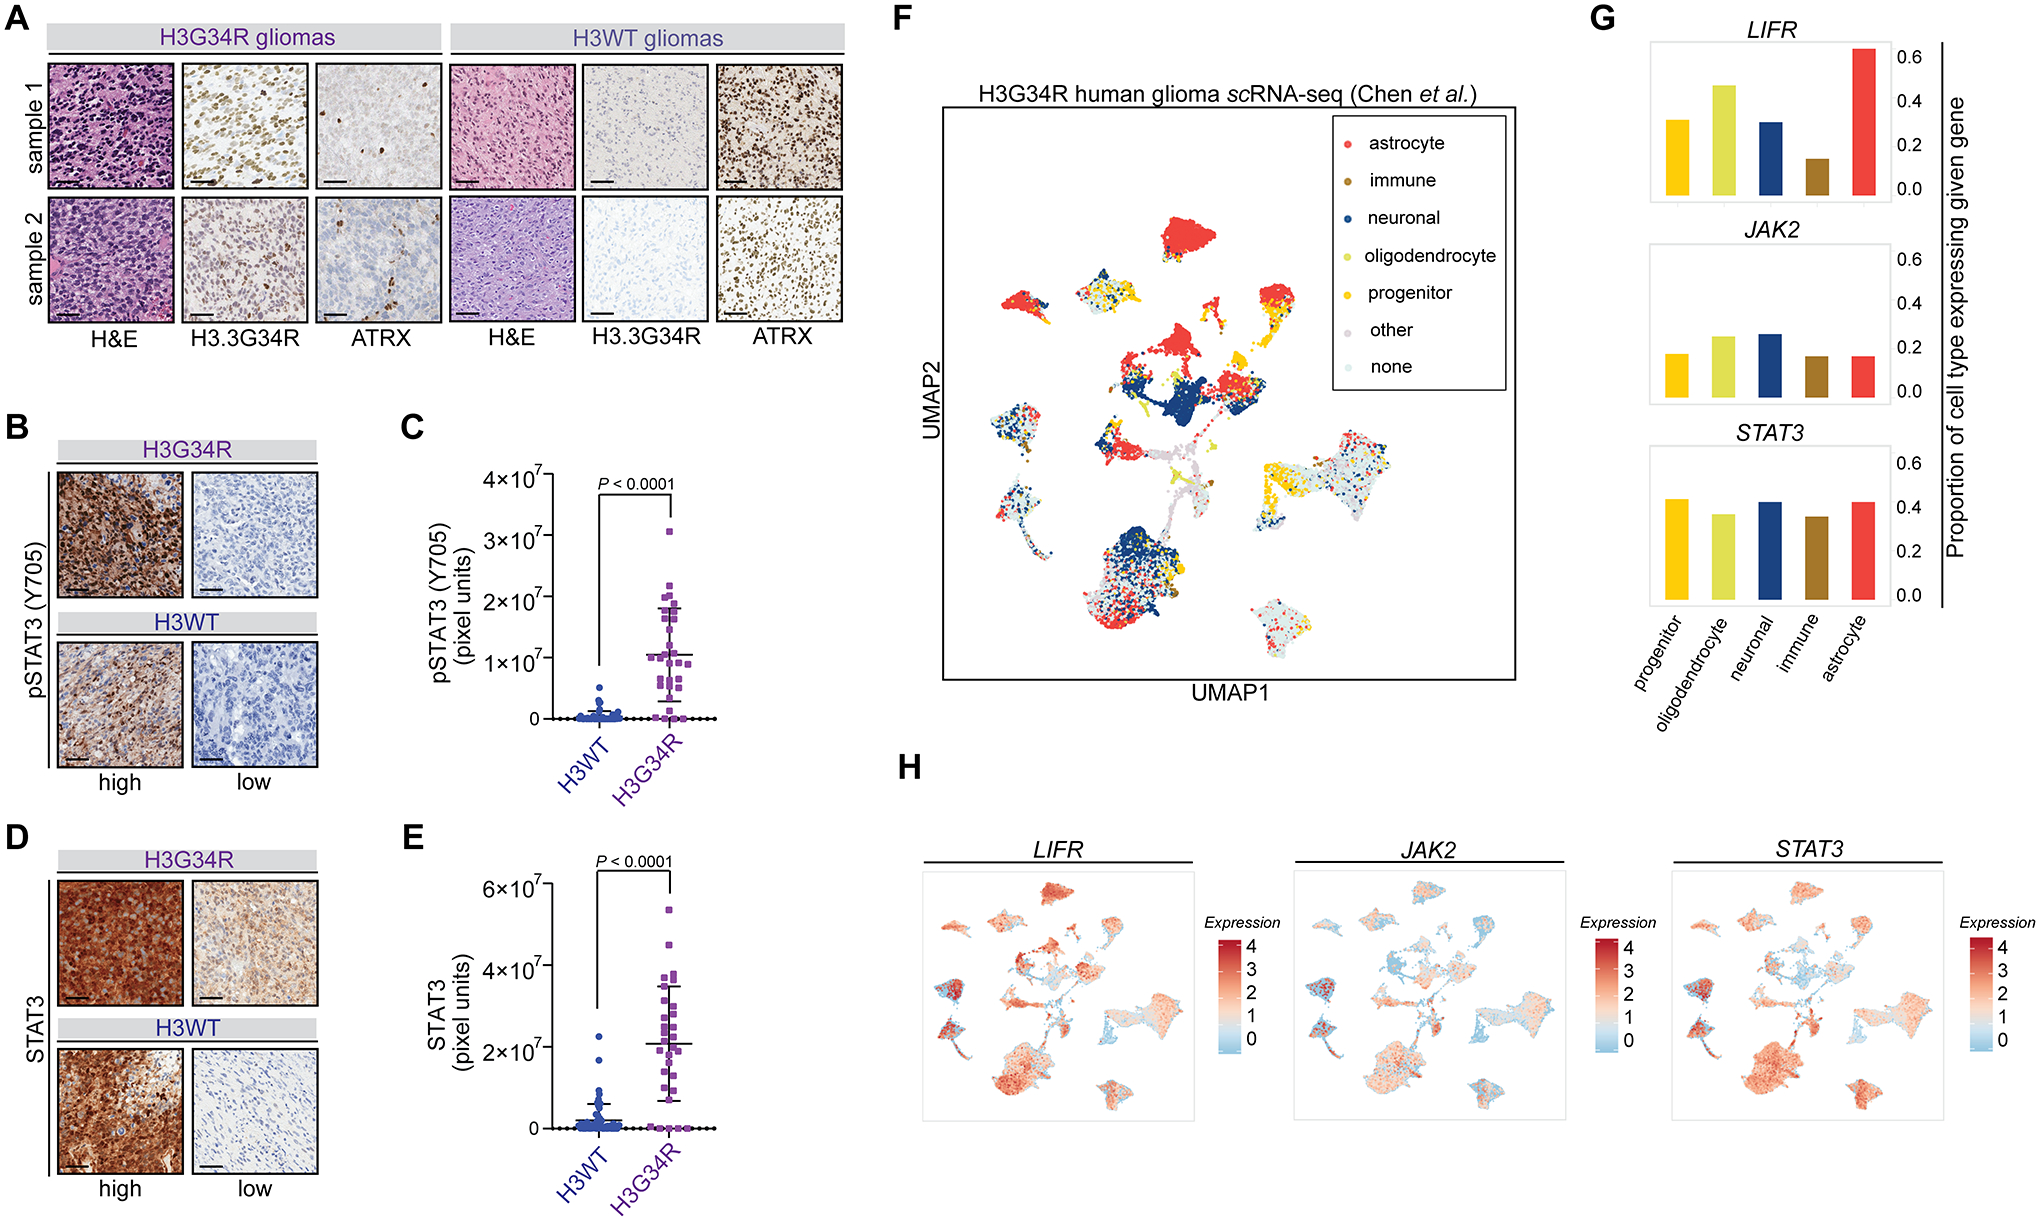
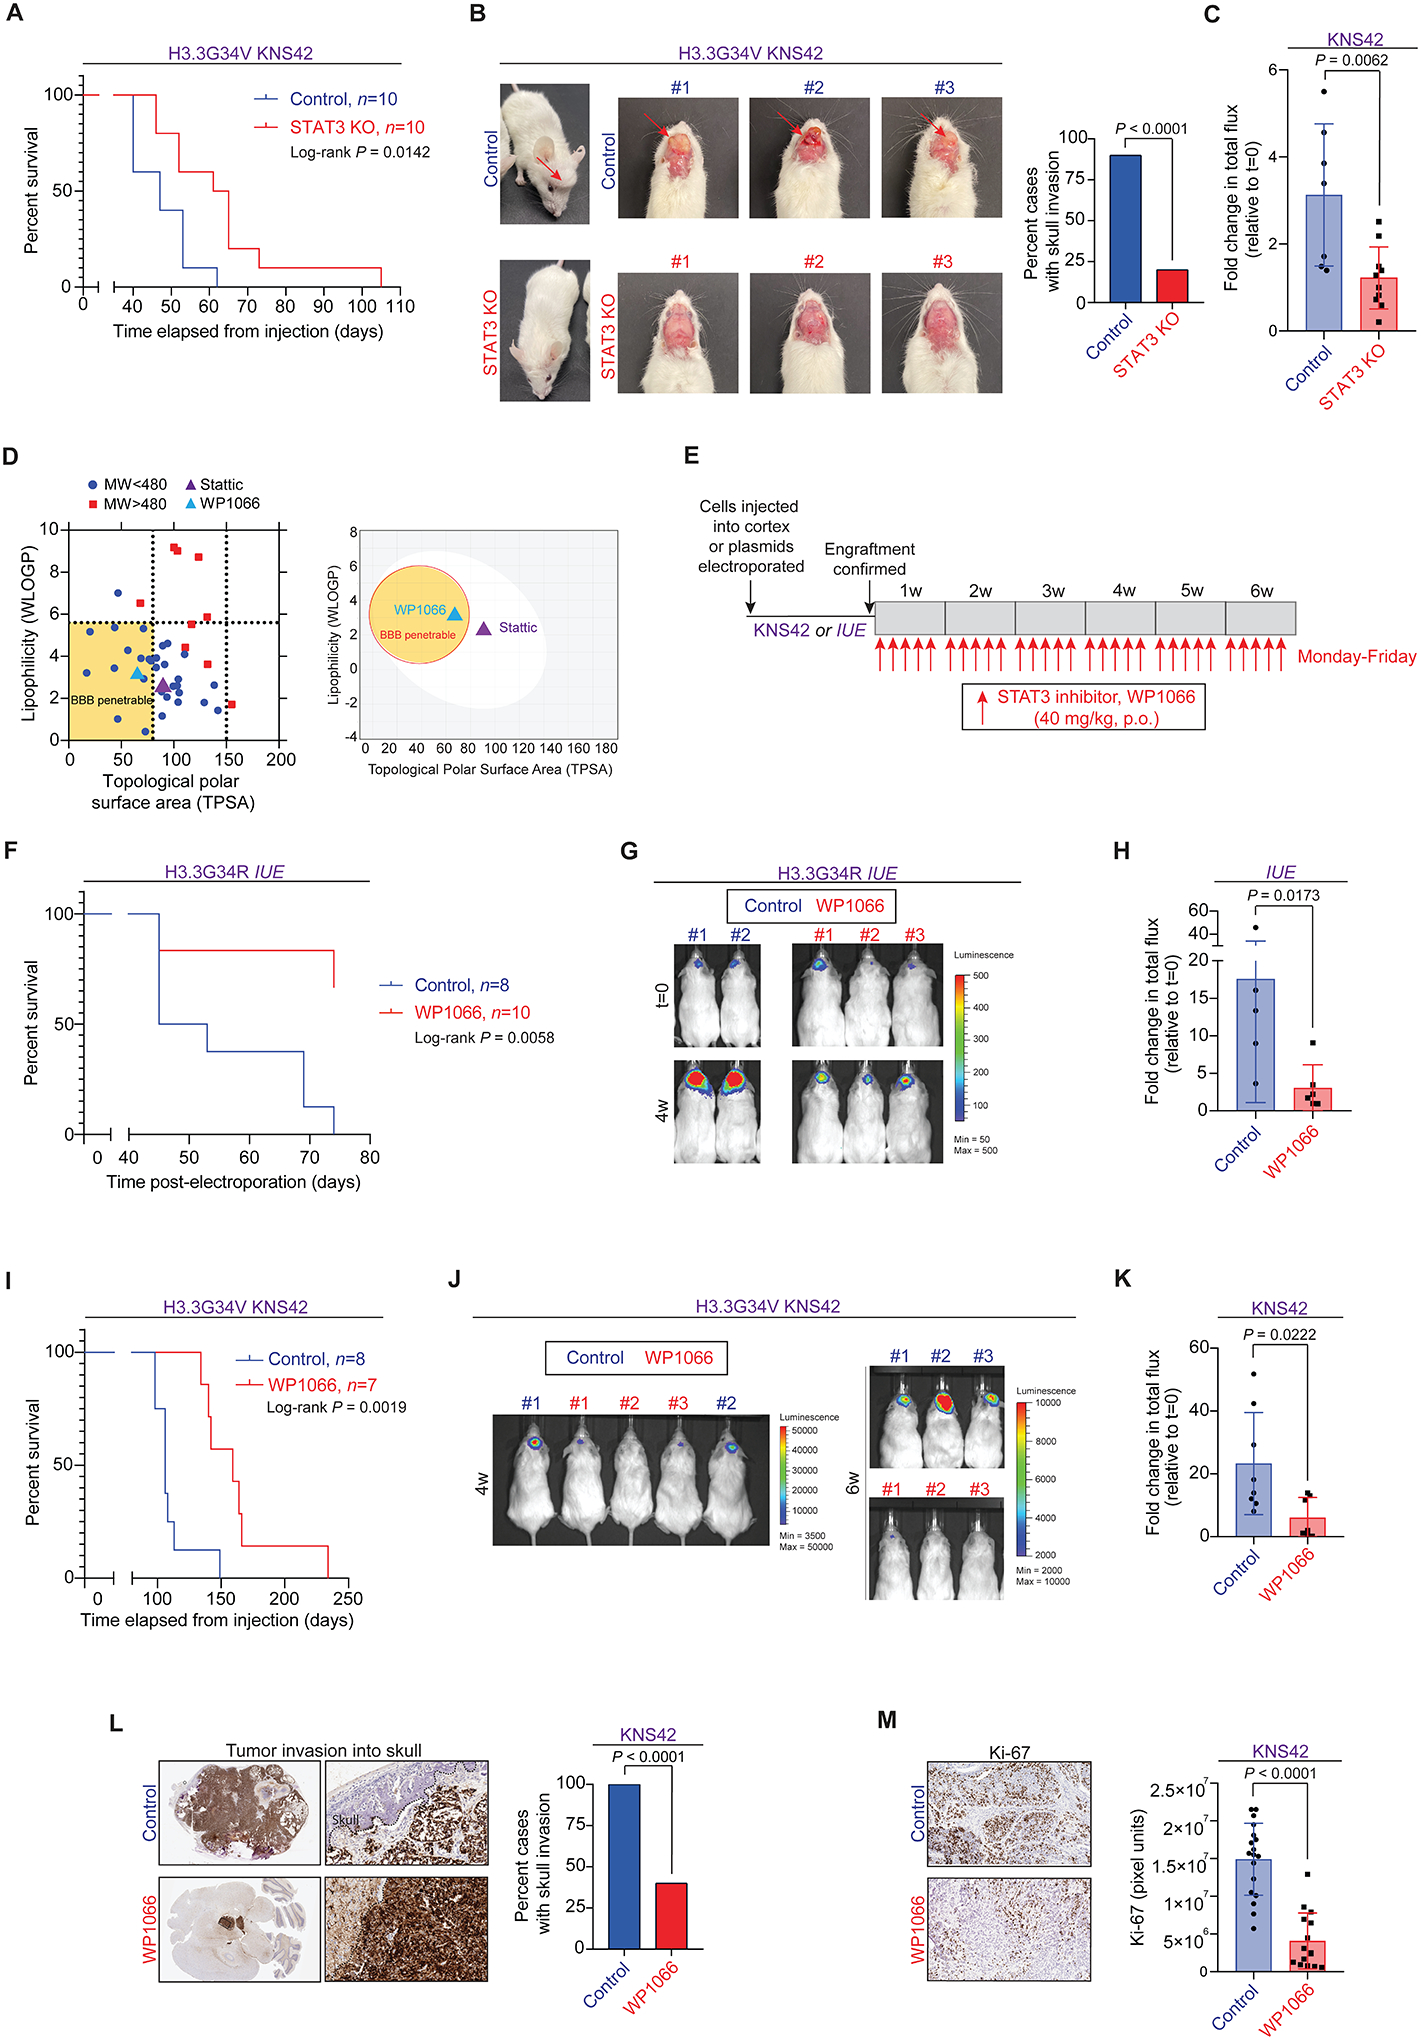
High-grade gliomas with arginine or valine substitutions of the histone H3.3 glycine-34 residue (H3.3G34R/V) carry a dismal prognosis, and current treatments, including radiotherapy and chemotherapy, are not curative. Because H3.3G34R/V mutations reprogram epigenetic modifications, we undertook a comprehensive epigenetic approach using ChIP sequencing and ChromHMM computational analysis to define therapeutic dependencies in H3.3G34R/V gliomas. Our analyses revealed a convergence of epigenetic alterations, including (i) activating epigenetic modifications on histone H3 lysine (K) residues such as H3K36 trimethylation (H3K36me3), H3K27 acetylation (H3K27ac), and H3K4 trimethylation (H3K4me3); (ii) DNA promoter hypomethylation; and (iii) redistribution of repressive histone H3K27 trimethylation (H3K27me3) to intergenic regions at the leukemia inhibitory factor (LIF) locus to drive increased LIF abundance and secretion by H3.3G34R/V cells. LIF activated signal transducer and activator of transcription 3 (STAT3) signaling in an autocrine/paracrine manner to promote survival of H3.3G34R/V glioma cells. Moreover, immunohistochemistry and single-cell RNA sequencing from H3.3G34R/V patient tumors revealed high STAT3 protein and RNA expression, respectively, in tumor cells with both inter- and intratumor heterogeneity. We targeted STAT3 using a blood-brain barrier–penetrable small-molecule inhibitor, WP1066, currently in clinical trials for adult gliomas. WP1066 treatment resulted in H3.3G34R/V tumor cell toxicity in vitro and tumor suppression in preclinical mouse models established with KNS42 cells, SJ-HGGx42-c cells, or in utero electroporation techniques. Our studies identify the LIF/STAT3 pathway as a key epigenetically driven and druggable vulnerability in H3.3G34R/V gliomas. This finding could inform development of targeted, combination therapies for these lethal brain tumors.


Conflict of interest statement

Competing interests: DRW has received consulting fees from Agios Inc. He is an inventor on a patent (pending) related to methods of determining optimal treatment for brain tumor patients. AR serves as Member for Voxel Analytics, LLC and consulting relationship with Genophyll, LLC. The other authors declare no competing interests.

Figures

Figure 1.
Figure 1.. H3.3G34R/V cells exhibit transcriptomic and epigenetic alterations converging on the LIF/JAK/STAT3 axis.
(A) Western blots of parental mNSCs stably transduced with HA-tagged H3.3G34R, H3.3WT, and H3.3K27M expression plasmids for H3K36me3, H3K4me3, H3K27ac, H3K27me3, and total H3. (B) Heatmap of differentially expressed genes determined by RNA-seq in H3.3G34R, H3.3WT, and H3.3K27M mNSCs. (C) RNA-seq analysis comparing H3.3G34R/H3.3WT and H3.3K27M/H3.3WT mNSCs demonstrating upregulated/downregulated genes unique to H3.3G34R and shared with H3.3K27M mNSCs. (D) Gene set enrichment analysis (GSEA) for genes upregulated in H3.3G34R mNSCs compared to H3.3WT mNSCs. (E) Average H3K36me3 occupancy (Y-axis) at gene bodies in H3.3G34R and H3.3WT mNSCs. (F) H3K36me3 enrichment in H3.3G34R/H3.3WT mNSCs (log2 fold-change, Y-axis plotted against H3.3G34R/H3.3WT gene expression (log2 fold-change, X-axis) for genes with differential H3K36me3. (G) Integrated Genomics Viewer (IGV) snapshot of H3K36me3 enrichment at the Lif gene body in H3.3G34R (purple), H3.3WT (blue), and H3.3K27M (green) mNSCs. Red arrow demonstrates enrichment in H3.3G34R mNSCs. (H) Average H3K27ac and H3K4me3 occupancy (Y-axis) at gene promoters (defined as +/− 5kb from TSS, X-axis) in H3.3G34R and H3.3WT mNSCs. (I) Pathway analysis for genes with differential deposition of H3K27ac in H3.3G34R mNSCs versus H3.3WT mNSCs. P values are indicated from PANTHER-GO analysis of promoter H3K27ac-enriched genes. (J) IGV snapshot of H3K27ac and H3K4me3 enrichment at the Lif promoter in H3.3G34R (purple), H3.3WT (blue), and H3.3K27M (green) mNSCs. Red arrow demonstrates enrichment in H3.3G34R mNSCs. (K) IGV snapshot of H3.3G34R or H3.3G34V (blue), H3K36me3 (brown), H3K27ac (orange), and total H3 (gray) enrichment at LIF in H3.3G34V (KNS42) and H3.3G34R (CHOP-GBM-001 and HSJD-GBM-002) cells. (L) ChromHMM heatmaps illustrating combinatorial patterns of histone epigenetic modifications, H3K36me3, H3K4me1, H3K27ac, H3K4me3, H3K36me2, and H3K27me3, used to assign 10 distinct chromatin states (top left). Chromatin states are related to each genomic region (CpG islands, exons, transcription start sites) such that each region is associated with its most representative state (top right). Defined chromHMM states assigned to regions of the Lif locus (bottom) in H3.3G34R, H3.3WT, and H3.3K27M mNSCs. Note that State 6 (orange) is present only in H3.3G34R cells, State 10 (light purple) is present exclusively in H3.3WT mNSCs, and State 1 (blue) is more widely represented in H3.3G34R mNSCs versus both H3.3WT and H3.3K27M mNSCs. Red arrows indicate enrichment of H3K36me3-containing chromHMM states in H3.3G34R mNSCs. Purple arrows indicate regions with repressive H3K27me3-containing chromHMM state 10 in H3.3WT mNSCs. (M) Pathway analysis for genes demonstrating chromHMM state 6 enrichment in H3.3G34R mNSCs when compared to the same genomic regions in H3.3WT mNSCs. P values are indicated from gene set enrichment analysis (GSEA) of genes with specific State 6 enrichment in H3.3G34R mNSCs.
Figure 2.
Figure 2.. H3.3G34R/V alters DNA methylation and H3K27me3 at the LIF locus.
(A) Comparison of differentially methylated genomic regions (DMRs) in H3.3G34R versus H3.3WT mNSCs. (B) Violin plots depicting the difference in percent methylation for the 500 most hypomethylated or hypermethylated CpG sites within promoters in H3.3G34R (purple) versus H3.3WT and H3.3K27M (green) versus H3.3WT mNSCs. (C) Violin plot depicting associated log2 fold-change in mRNA expression of the 500 most hypomethylated and hypermethylated promoter CpG sites in H3.3G34R mNSCs. (D) X-Y plot for log2 fold-change in mRNA expression (Y-axis) and mean methylation difference (X-axis) in H3.3G34R versus H3.3WT mNSCs. (E-H) Average H3K36me3 occupancy at gene bodies (E); H3K27ac (F) and H3K4me3 (G) enrichment at promoter regions; and H3K27me3 (H) occupancy at promoter and flanking region in H3.3G34R mNSCs for gene loci with promoter hypomethylation (top) or hypermethylation (bottom) in H3.3G34R (purple) versus H3.3WT (blue) mNSCs. Red arrows indicate enrichment of the histone modification. Black bars denote intergenic and genic regions. (I) Integrated Genomics Viewer snapshot of H3K27me3, H3K36me3, H3K27ac, and H3K4me3 ChIPseq signals plotted with DNA methylation (relative to H3.3WT mNSCs; black, hypomethylated; red, hypermethylated) at Lif, Emx2, and Igfbp2 in H3.3G34R (purple) and H3.3WT (blue) mNSCs. Red boxes indicate gain of H3K27me3 in intergenic regions. Red arrows indicate gain of activating epigenetic marks at gene promoters and gene bodies. Blue boxes indicate DNA hypomethylation at the gene promoter. (J) Schematic of human LIF structure indicating CpG site genomic locations. Sites indicated in black and red indicate greater than 50 percent of H3.3G3R patients with hypomethylated or hypermethylation, respectively, of the CpG site relative to H3.3WT glioma patients. (K) Bar graphs showing the proportion of H3.3G34R glioma patients (n=73) with hypomethylation (black) or hypermethylation (red) of CpG sites within LIF relative to H3.3WT (n=1306) glioma patients. Data in (B) and (C) analyzed by parametric, 2-sided, unpaired, Student’s t test.
Figure 3.
Figure 3.. H3.3G34R/V mutations drive STAT3 signaling via elevated LIF secretion.
(A) Bar plot of differentially expressed genes (Z-score, Y-axis) Lif, Jak2, Stat3, Pim1, and Stat5b assessed by RNA sequencing in H3.3G34R (purple), H3.3WT (blue), and H3.3K27M (green) mNSCs; n=3 biological replicates. (B) Representative Western blots of cell lysates from mNSCs stably transduced with H3.3G34R, H3.3WT, and H3.3K27M transgenes for pStat3(Y705), Stat3, and β-Actin. (C) Representative Western blots on cell lysates from pHGG cell lines OPGB-GBM-001 (H3.3G34R), KNS42 (H3.3G34V), SF188 (H3.3WT), UMPed37 (H3.3WT), and HSJD-DIPG-007 (H3.3K27M) for JAK2, pSTAT3(Y705), STAT3, and β-ACTIN. (D) ELISA for human LIF protein (pg protein/cell, Y-axis) in cell supernatants in H3.3G34V KNS42 cells compared to H3.3WT SF188 and UMPed37 cells after 4 days in culture; n=4 technical replicates. (E) Representative Western blots for LIF and β-ACTIN in KNS42 stably transduced with non-targeted (NT) or three independent LIF shRNAs; l.e. = low exposure, h.e. = high exposure. (F) ELISA of human LIF protein (pg protein/cell, Y-axis) in cell supernatants in KNS42 cells from (E) with or without LIF knockdown; n=3–4 technical replicates. (G) Representative Western blots of KNS42 cells stably transduced with three independent LIF shRNAs for pSTAT3(Y705), STAT3, and β-ACTIN; l.e. = low exposure, h.e. = high exposure. (H) Percent dead cells (Y-axis) in KNS42 parental cells (purple bar), LIF-knockdown cells from (G) (gray bars), or knockdown cells in the presence of recombinant human LIF (rLIF, 50 ng/mL, orange bars); n=6 technical replicates. (I) Representative Western blots for mutant specific-H3.3G34V and total H3 in KNS42 stably transduced with two independent H3F3A shRNAs. (J) Representative Western blots for LIF and β-ACTIN in cells from (I); l.e. = low exposure, h.e. = high exposure. (K) ELISA for human LIF protein (pg protein/cell, Y axis) in KNS42 cells from (I) with or without H3F3A knockdown; n=3–4 technical replicates. (L) Representative Western blots of KNS42 cells stably transduced with two independent H3F3A shRNAs for pSTAT3(Y705), STAT3, and β-ACTIN; l.e. = low exposure, h.e. = high exposure. (M) Percent dead cells (Y-axis) in KNS42 cells with or without H3F3A knockdown from (L); n=3 technical replicates. Data in (A), (D), (F), (H), (K), and (M) are plotted as mean +/− S.D. Data in (A) are analyzed by two-way ANOVA with Dunnett’s multiple comparisons test. Data in (D), (F), (H), (K), and (M) are analyzed by one-way ANOVA with Dunnett’s multiple comparisons test.
Figure 4.
Figure 4.. H3.3G34R/V patient-derived tumor cells and tissues exhibit robust STAT3 expression and pathway activation.
(A) Representative IHC images of two H3.3G34R (purple, left) and two H3WT (blue, right) human high-grade glioma tumors stained with Hematoxylin and eosin (H&E), mutant-specific H3.3G34R, or ATRX. Scale bar, 60 μm. (B) Representative IHC images from human H3.3G34R (top) or H3WT (bottom) gliomas for pSTAT3(Y705). IHC images demonstrating the highest and lowest pSTAT3(Y705) staining within each cohort were selected. Scale bar, 60 μm. (C) Blinded quantification (pixel units, Y-axis) of pSTAT3(Y705) staining in H3WT (blue) and H3.3G34R (purple) human glioma samples. H3.3G34R, n=6 samples; H3WT, n=12 samples. Five randomly selected regions were imaged per sample. Each dot represents the quantification of a single image from each tumor within each cohort. (D) Representative IHC images from human H3.3G34R (top) or H3WT (bottom) gliomas for total STAT3. IHC images demonstrating the highest and lowest STAT3 staining within each cohort were selected. Scale bar, 60 μm. (E) Blinded quantification (pixel units, Y-axis) of STAT3 staining in H3WT (blue) and H3.3G34R (purple) human glioma samples. H3.3G34R, n=6 samples; H3WT, n=12 samples. Five randomly selected regions were imaged per sample. Each dot represents the quantification of a single image from each tumor within each cohort. (F) Uniform manifold approximation and projection (UMAP) embedding of scRNA-seq data from malignant H3.3G34R/V cells originating from sixteen patient samples (14 patients, two primary-recurrence pairs) analyzed in Chen et al. (2020). Cells are colored by most similar normal brain cell type. (G) Bar plots illustrating the proportion of each cell type aggregated from all tumors (progenitor, yellow; oligodendrocyte, green; neuronal, blue; immune, brown; astrocyte, red) expressing the given JAK/STAT pathway genes LIFR (top), JAK2 (center), and STAT3 (bottom). (H) UMAP embedding of scRNA-seq data of malignant H3.3G34R/V cells as in (F), with cells colored by expression of LIFR, JAK2, or STAT3. Data in (C) and (E) are plotted as mean +/− S.D. and analyzed by parametric, 2-sided, unpaired, Student’s t test.
Figure 5.
Figure 5.. STAT3 inhibition demonstrates greater toxicity in H3.3G34R/V compared to H3.3WT glioma cells in vitro.
(A-B) Representative Western blots (A) and bright field images (B) of H3.3G34V KNS42 cells with or without CRISPR-mediated STAT3 knockout. (C) Cell counts (percentage of living cells, Y-axis; cell line condition, X-axis) in H3.3G34V KNS42 cells with or without STAT3 knockout from (B) after 6 days in culture; n=6 technical replicates. (D) Heatmap and GSEA of differentially expressed genes determined by RNA-seq in H3.3G34V KNS42 cells with or without STAT3 knockout; n=3 technical replicates. (E-F) Cell counts (percentage of living cells, Y-axis; drug concentrations, X-axis) of H3.3G34R (purple) and H3.3WT (blue) mNSCs (E); and H3.3G34V KNS42 (purple), H3.3WT SF188 (blue), H3.3WT TS543 (lavender) and H3.3K27M HSJD-DIPG-007 (green) patient-derived pHGG cells (F) treated with STAT3 inhibitor, Stattic, for 96 hours at indicated concentrations. n=4 technical replicates. (G) Cell counts (percentage of living cells, Y-axis; drug concentrations, X-axis) of H3.3G34R SJ-HGGx42-c (purple), H3.3G34R SJ-HGGx6-c (pink), and H3.3WT SJ-HGGx39-c patient-derived pHGG cells treated with Stattic for 96 hours at indicated concentrations. n=3 technical replicates. (H) Representative Western blots for pSTAT3(Y705), STAT3, and β-ACTIN in H3.3G34V KNS42 cells treated with Stattic for 24 hours at indicated concentrations. (I) Cell counts (percentage of bioluminescence signal, Y-axis; drug concentrations, X-axis) of H3.3G34R (purple) and H3.3WT (blue) mNSCs treated with STAT3 inhibitor, WP1066, for 96 hours at indicated concentrations. n=4 technical replicates. (J) Cell counts (percentage of living cells, Y-axis; drug concentrations, X-axis) of H3.3G34V KNS42 (purple), H3.3WT SF188 (blue), H3.3WT TS543 (lavender) and H3.3K27M HSJD-DIPG-007 (green) patient-derived pHGG cells treated with STAT3 inhibitor, WP1066, for 96 hours at indicated concentrations. n=4 technical replicates. (K) Cell counts (percentage of living cells, Y-axis; drug concentrations, X-axis) of H3.3G34R SJ-HGGx42-c (purple), H3.3G34R SJ-HGGx6-c (pink), H3.3WT SJ-HGGx39-c (blue), and H3.3K27M SJ-DIPGx37-c (green) human patient-derived pHGG cells treated with WP1066 for 96 hours at indicated concentrations; n=3–4 technical replicates. (L) Representative Western blot for pSTAT3(Y705), STAT3, and β-ACTIN in KNS42 cells treated with WP1066 for 48 hours at indicated concentrations. Responses of each cell line in (C), (E), (F), (G), (I), (J), and (K) are plotted as percent of living cells relative to corresponding untreated control. Data in (C), (E), (F), (G), (I), (J), and (K) are plotted as mean +/− S.D. and analyzed by parametric, 2-sided, unpaired, Student’s t test.
Figure 6.
Figure 6.. Inhibition of STAT3 activity is therapeutic in H3.3G34R/V glioma models in vivo.
(A) Kaplan-Meier analysis of mice harboring H3.3G34V KNS42 tumors with and without STAT3 genetic knockout (STAT3 KO) as a function of time post-implantation. Control, blue, n=10; STAT3 KO animals, red, n=10. (B) Representative images of tumor invasion into the skull (red arrows) in mice bearing KNS42 tumors with or without STAT3 KO (left). Bar graph illustrates percent of mice within control and STAT3 KO cohorts with observable tumor invasion into the skull (right). Control, blue, n=5; STAT3 KO, red, n=10. (C) Bioluminescent signal quantification (Y-axis) of animals from (A) at week 5 post-implantation. Fold change in total flux was calculated by normalizing bioluminescent signal at the given time point by the corresponding baseline signal for each mouse. Each symbol represents one mouse. Control, blue, n=7; STAT3 KO animals, red, n=10. (D) X-Y plot illustrating relative molecular weight (MW < 480 g/mol, dark blue; MW > 480 g/mol, red), lipophilicity (WLOGP value, Y-axis), and topological polar surface area (TPSA, X-axis) characteristics of available STAT3 inhibitors (left). The SwissADME model developed by the Swiss Institute of Bioinformatics was utilized to generate the pharmacokinetic and ADME properties illustrated on the plot (32). Shaded yellow area represents chemical properties associated with predicted BBB penetrability; WP1066 (light blue triangle) and Stattic (purple triangle) are indicated. A BOILED-Egg X-Y plot demonstrating the lipophilicity (WLOGP, Y-axis) and topological polar surface area (TPSA, X-axis) of STAT3 inhibitors Stattic (purple triangle) and WP1066 (blue triangle) (right). Yellow area defines the range of WLOGP and TPSA properties for inhibitors with predicted BBB penetrability and white area defines the range of WLOGP and TPSA properties associated with predicted gastrointestinal absorption. (E) WP1066 treatment paradigm for animals (1) orthotopically implanted with H3.3G34V KNS42 cells or (2) animals bearing H3.3G34R tumors established via in-utero electroporation (IUE). H3.3G34R IUE tumors were established in CD-1 mice with expression plasmids for dominant-negative Tp53, mutant Pdgfra-D842V, and mutant H3.3G34R H3f3a. Red arrows indicate WP1066 administration via oral gavage over a six-week period. (F) Kaplan-Meier analysis of H3.3G34R IUE tumor-bearing mice treated with WP1066 as a function of time post-electroporation. Control, blue, n=8; WP1066-treated animals, red, n=10. (G) Representative bioluminescent images from H3.3G34R IUE control and WP1066-treated mice before (t=0) and after four (4w) weeks WP1066 treatment. (H) Bioluminescent signal quantification of H3.3G34R IUE tumor-bearing mice receiving WP1066 or vehicle in (F). Fold change in total flux (Y-axis) is calculated by normalizing bioluminescent signal at treatment time point by corresponding baseline signal before treatment for each mouse. Each symbol represents one mouse. Control, blue, n=5; WP1066-treated animals, red, n=6. (I) Kaplan-Meier analysis of mice harboring H3.3G34V KNS42 tumors treated with WP1066 as a function of time post-implantation. Control, blue, n=8; WP1066-treated animals, red, n=7. (J) Representative bioluminescence images from animals implanted with H3.3G34V KNS42 cells in the cortex following four (4w) and six (6w) weeks of WP1066 treatment. (K) Bioluminescent signal quantification (Y-axis) of animals with H3.3G34V KNS42 tumors receiving WP1066 or vehicle in (I). Fold change in total flux is calculated by normalizing bioluminescent signal at treatment time point by the corresponding baseline signal before treatment for each mouse. Each symbol represents one mouse. Control, blue, n=8; WP1066-treated animals, red, n=7. (L) Representative IHC images of KNS42 cranial tumors stained for GFAP illustrating tumor invasion into the skull in mice (assessed in a blinded manner) with orthotopic H3.3G34V KNS42 tumors with or without WP1066 treatment (left). Bar graph illustrates percent of mice within control and treatment cohorts with observable tumor invasion into the skull (right). Note all control mice exhibit invasion. Control, blue, n=8; WP1066-treated animals, red, n=7. (M) Representative IHC images and blinded quantification of Ki-67 (pixel units, Y-axis) in mice with orthotopic KNS42 tumors with or without WP1066 treatment (left). Bar plot represents quantification (pixel units, Y-axis) of three randomly selected regions per mouse, per treatment condition (right). Control, blue, n=6; WP1066-treated animals, red, n=5. Data in (C), (H), (K), and (M) are plotted as mean +/− S.D., and data in (B), (C), (H), (K), (L), and (M) are analyzed by non-parametric, 2-sided, unpaired, Student’s t test. Log-rank test was utilized in (A), (F), and (I) for Kaplan-Meier analysis (P-values are indicated for comparison with control animals).

References

    1. Jones C, Karajannis MA, Jones DTW, Kieran MW, Monje M, Baker SJ, Becher OJ, Cho YJ, Gupta N, Hawkins C, Hargrave D, Haas-Kogan DA, Jabado N, Li XN, Mueller S, Nicolaides T, Packer RJ, Persson AI, Phillips JJ, Simonds EF, Stafford JM, Tang Y, Pfister SM, Weiss WA, Pediatric high-grade glioma: biologically and clinically in need of new thinking. Neuro Oncol 19, 153–161 (2017). - PMC - PubMed
    1. Louis DN, Perry A, Wesseling P, Brat DJ, Cree IA, Figarella-Branger D, Hawkins C, Ng HK, Pfister SM, Reifenberger G, Soffietti R, von Deimling A, Ellison DW, The 2021 WHO Classification of Tumors of the Central Nervous System: a summary. Neuro Oncol, (2021). - PMC - PubMed
    1. Khazaei S, De Jay N, Deshmukh S, Hendrikse LD, Jawhar W, Chen CC, Mikael LG, Faury D, Marchione DM, Lanoix J, Bonneil E, Ishii T, Jain SU, Rossokhata K, Sihota TS, Eveleigh R, Lisi V, Harutyunyan AS, Jung S, Karamchandani J, Dickson BC, Turcotte R, Wunder JS, Thibault P, Lewis PW, Garcia BA, Mack SC, Taylor MD, Garzia L, Kleinman CL, Jabado N, H3.3G34W promotes growth and impedes differentiation of osteoblast-like mesenchymal progenitors in Giant Cell Tumour of Bone. Cancer Discov, (2020). - PMC - PubMed
    1. Lewis PW, Muller MM, Koletsky MS, Cordero F, Lin S, Banaszynski LA, Garcia BA, Muir TW, Becher OJ, Allis CD, Inhibition of PRC2 activity by a gain-of-function H3 mutation found in pediatric glioblastoma. Science 340, 857–861 (2013). - PMC - PubMed
    1. Lu C, Jain SU, Hoelper D, Bechet D, Molden RC, Ran L, Murphy D, Venneti S, Hameed M, Pawel BR, Wunder JS, Dickson BC, Lundgren SM, Jani KS, De Jay N, Papillon-Cavanagh S, Andrulis IL, Sawyer SL, Grynspan D, Turcotte RE, Nadaf J, Fahiminiyah S, Muir TW, Majewski J, Thompson CB, Chi P, Garcia BA, Allis CD, Jabado N, Lewis PW, Histone H3K36 mutations promote sarcomagenesis through altered histone methylation landscape. Science 352, 844–849 (2016). - PMC - PubMed

Publication types