. 2021 Oct 13;17(10):e1009507.
doi: 10.1371/journal.pcbi.1009507. eCollection 2021 Oct.

Steady-state measures of visual suppression

Affiliations

Steady-state measures of visual suppression

Daniel H Baker et al. PLoS Comput Biol. .

Abstract

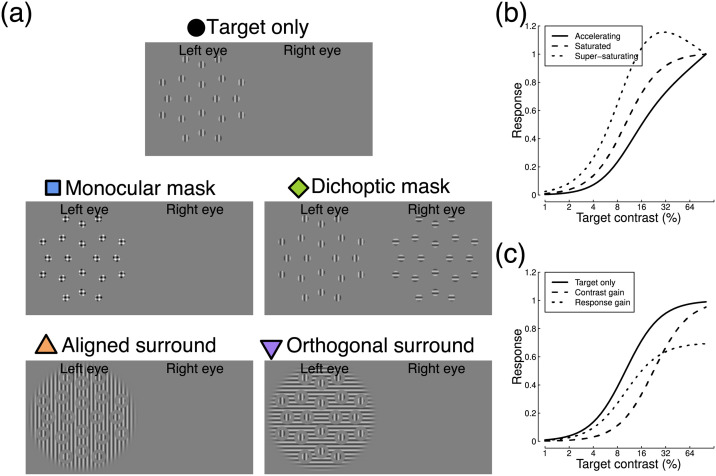
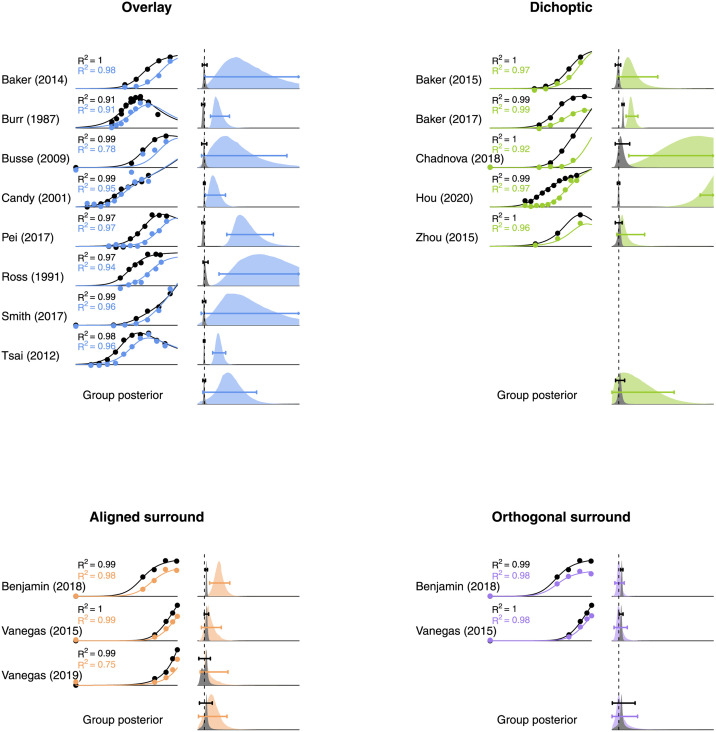
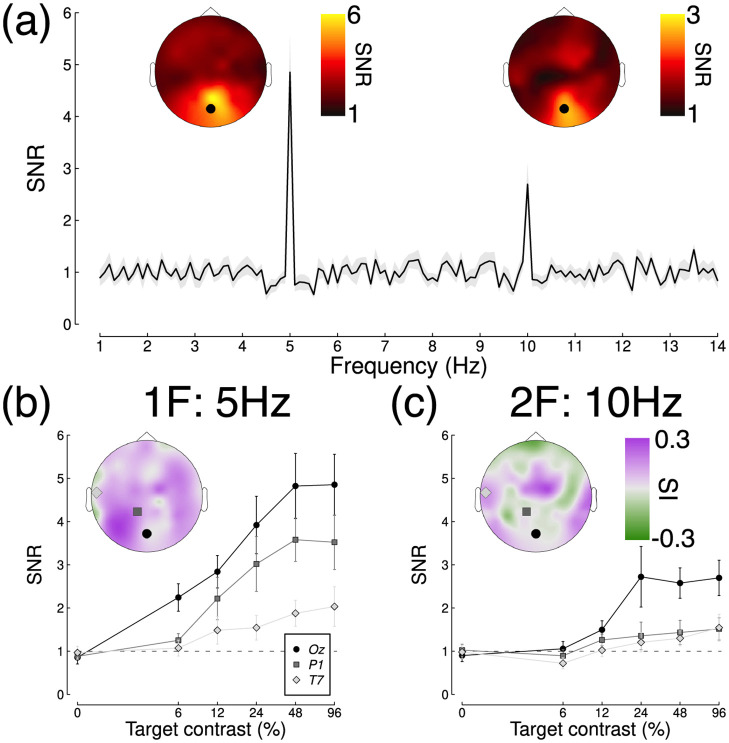
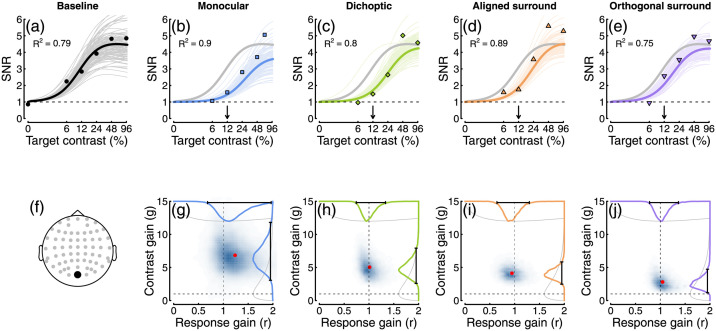
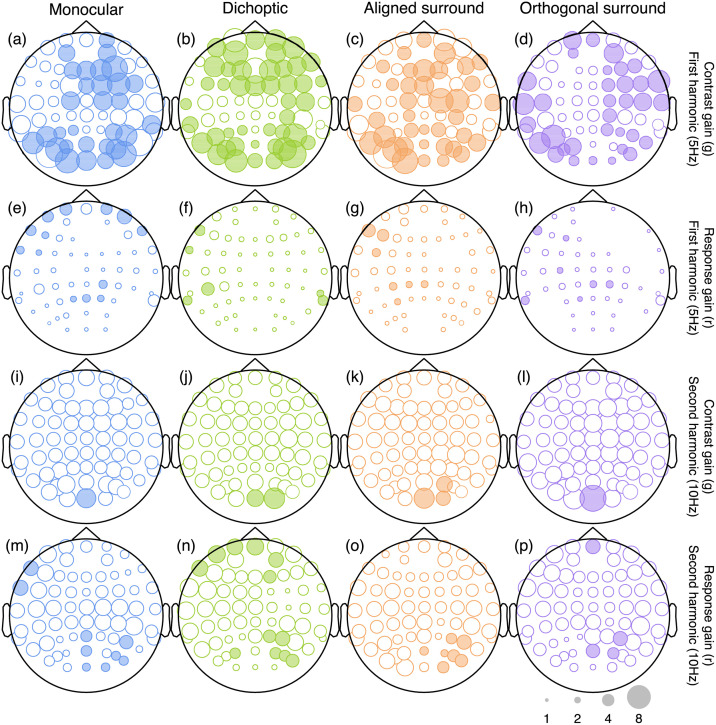
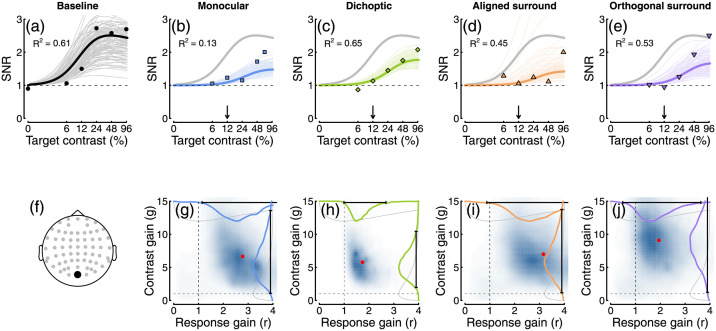
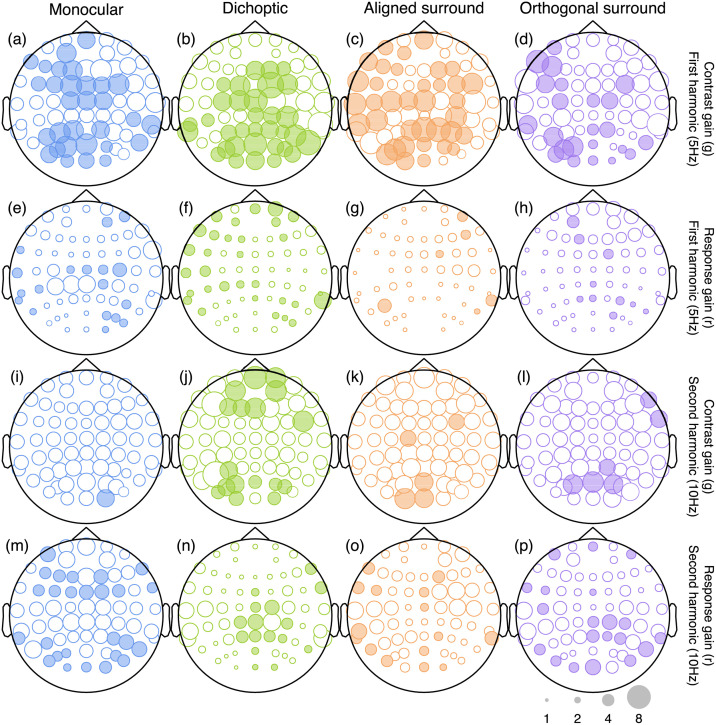
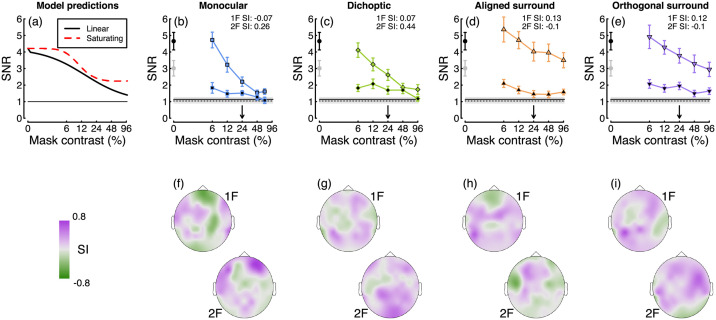
In the early visual system, suppression occurs between neurons representing different stimulus properties. This includes features such as orientation (cross-orientation suppression), eye-of-origin (interocular suppression) and spatial location (surround suppression), which are thought to involve distinct anatomical pathways. We asked if these separate routes to suppression can be differentiated by their pattern of gain control on the contrast response function measured in human participants using steady-state electroencephalography. Changes in contrast gain shift the contrast response function laterally, whereas changes in response gain scale the function vertically. We used a Bayesian hierarchical model to summarise the evidence for each type of gain control. A computational meta-analysis of 16 previous studies found the most evidence for contrast gain effects with overlaid masks, but no clear evidence favouring either response gain or contrast gain for other mask types. We then conducted two new experiments, comparing suppression from four mask types (monocular and dichoptic overlay masks, and aligned and orthogonal surround masks) on responses to sine wave grating patches flickering at 5Hz. At the occipital pole, there was strong evidence for contrast gain effects in all four mask types at the first harmonic frequency (5Hz). Suppression generally became stronger at more lateral electrode sites, but there was little evidence of response gain effects. At the second harmonic frequency (10Hz) suppression was stronger overall, and involved both contrast and response gain effects. Although suppression from different mask types involves distinct anatomical pathways, gain control processes appear to serve a common purpose, which we suggest might be to suppress less reliable inputs.


Conflict of interest statement

The authors have declared that no competing interests exist.

Figures

Fig 1
Fig 1. Example stimuli and illustration of contrast response functions.
Panel A shows five stimulus arrangements, illustrating how a vertical target pattern can be combined with four different mask types. Panel B shows three varieties of contrast response function, that either continue to accelerate (solid line), saturate (dashed line) or super-saturate (dotted line) across the range of displayable stimulus contrasts. Panel C illustrates a contrast gain (dashed line) and a response gain (dotted line) shift, relative to a baseline response (solid line).
Fig 2
Fig 2. Computational meta-analysis of 16 studies from the literature reporting SSVEP measures of suppression.
Each study is referred to by the first author surname—see text for full citations. Contrast response functions at baseline (black points) and with a mask present (coloured points) were fit using a two stage modelling procedure (curves). The posterior distributions (vertically rescaled for visibility) of parameter estimates for response gain (grey) and contrast gain (colours) are shown for each study and the group estimates. Vertical dashed lines indicate a parameter value of 1 (the axis extends to x = 15). Horizontal bars give the 95 percent highest density intervals for each parameter estimate. R2 values in each sub-panel indicate the coefficient of determination, calculated separately for the baseline (black text) and masked data (coloured text).
Fig 3
Fig 3. Averaged Fourier spectrum and example contrast response functions.
Panel A shows the spectrum for a high contrast target, with inset scalp plots showing SNRs at the first and second harmonic frequencies. The spectrum is taken from electrode Oz, indicated by the black points in the scalp plots. The shaded region and error bars indicate ±1 standard error. Panels B and C show example contrast response functions at the first and second harmonics at electrodes Oz, P1 and T7, averaged across participants (N = 12). The inset scalp plots show how the saturation index varies across the head.
Fig 4
Fig 4. Contrast response functions from electrode Oz, with example model fits and posterior parameter estimates.
Panel A shows the data from the baseline (no mask) condition (points), plotted alongside model curves for the mean posterior parameter estimates (thick curve), and random posterior samples (thin curves). Panels B-E show data for four types of mask in the same format (grey curves duplicate the mean fit from panel A), with the arrows indicating the mask contrast. The R2 values are derived from the fits to the individual participant data, rather than the group averaged data plotted here. Panel F shows the electrode location. Panels G-J show posterior density estimates for the response gain (x-axis) and contrast gain (y-axis) weight parameters. Red points show the means, dashed lines give the value expected in the case of no effect (a weight of 1), and distributions along the margins show the prior (grey) and posterior (coloured) distributions for each parameter. For all mask types, the contrast gain weight estimate was substantially greater than 1.
Fig 5
Fig 5. Scalp plots summarising the suppressive weights for contrast and response gain from the Bayesian hierarchical model, fitted to data from the low mask contrast experiment.
Symbols are filled white when the 95 percent highest density interval of the posterior parameter distribution includes 1 (implying no credible contribution from that type of suppression), and shaded when it exceeds 1 (implying credible evidence for suppression). Larger symbols correspond to stronger suppression (see the scale in lower right corner), but parameters implying facilitation (values <1) are not plotted.
Fig 6
Fig 6. Contrast response functions at the second harmonic frequency.
Plotting conventions mirror those in Fig 4. Note that the lower SNR at 10 Hz results in noisier data and less precise posterior estimates than at 5 Hz.
Fig 7
Fig 7. Scalp plots summarising the suppressive weights for contrast and response gain from the Bayesian hierarchical model, fitted to data from the high mask contrast experiment.
Plotting conventions are as for Fig 5.
Fig 8
Fig 8. Summary of the effects of varying mask contrast.
Panel A shows the predictions of a gain control model (Eq 1) for different levels of mask contrast. In the linear model (black), the suppressive signal is a linear function of mask contrast. In the nonlinear model (red), the suppressive signal has itself passed through a nonlinear transducer function before suppressing the target. Panels B-E show empirical data for four mask types, at the first and second harmonic frequencies (black borders and black fills, respectively). Error bars and shaded regions show ±1 standard error of the mean across N = 21 participants. Panels F-I show how the modified saturation index varies across the scalp.

References

    1. Carandini M, Heeger DJ. Normalization as a canonical neural computation. Nat Rev Neurosci. 2012;13(1):51–62. doi: 10.1038/nrn3136 - DOI - PMC - PubMed
    1. Heeger DJ. Normalization of cell responses in cat striate cortex. Vis Neurosci. 1992;9(2):181–97. doi: 10.1017/S0952523800009640 - DOI - PubMed
    1. Baker DH, Meese TS, Summers RJ. Psychophysical evidence for two routes to suppression before binocular summation of signals in human vision. Neuroscience. 2007;146(1):435–48. doi: 10.1016/j.neuroscience.2007.01.030 - DOI - PubMed
    1. Freeman TCB, Durand S, Kiper DC, Carandini M. Suppression without inhibition in visual cortex. Neuron. 2002;35(4):759–71. doi: 10.1016/S0896-6273(02)00819-X - DOI - PubMed
    1. Carandini M, Heeger DJ, Senn W. A synaptic explanation of suppression in visual cortex. J Neurosci. 2002;22(22):10053–65. doi: 10.1523/JNEUROSCI.22-22-10053.2002 - DOI - PMC - PubMed

Publication types