. 2021 Oct 28;184(22):5541-5558.e22.
doi: 10.1016/j.cell.2021.09.021. Epub 2021 Oct 12.

A mouse-specific retrotransposon drives a conserved Cdk2ap1 isoform essential for development

Affiliations

A mouse-specific retrotransposon drives a conserved Cdk2ap1 isoform essential for development

Andrew J Modzelewski et al. Cell. .

Abstract

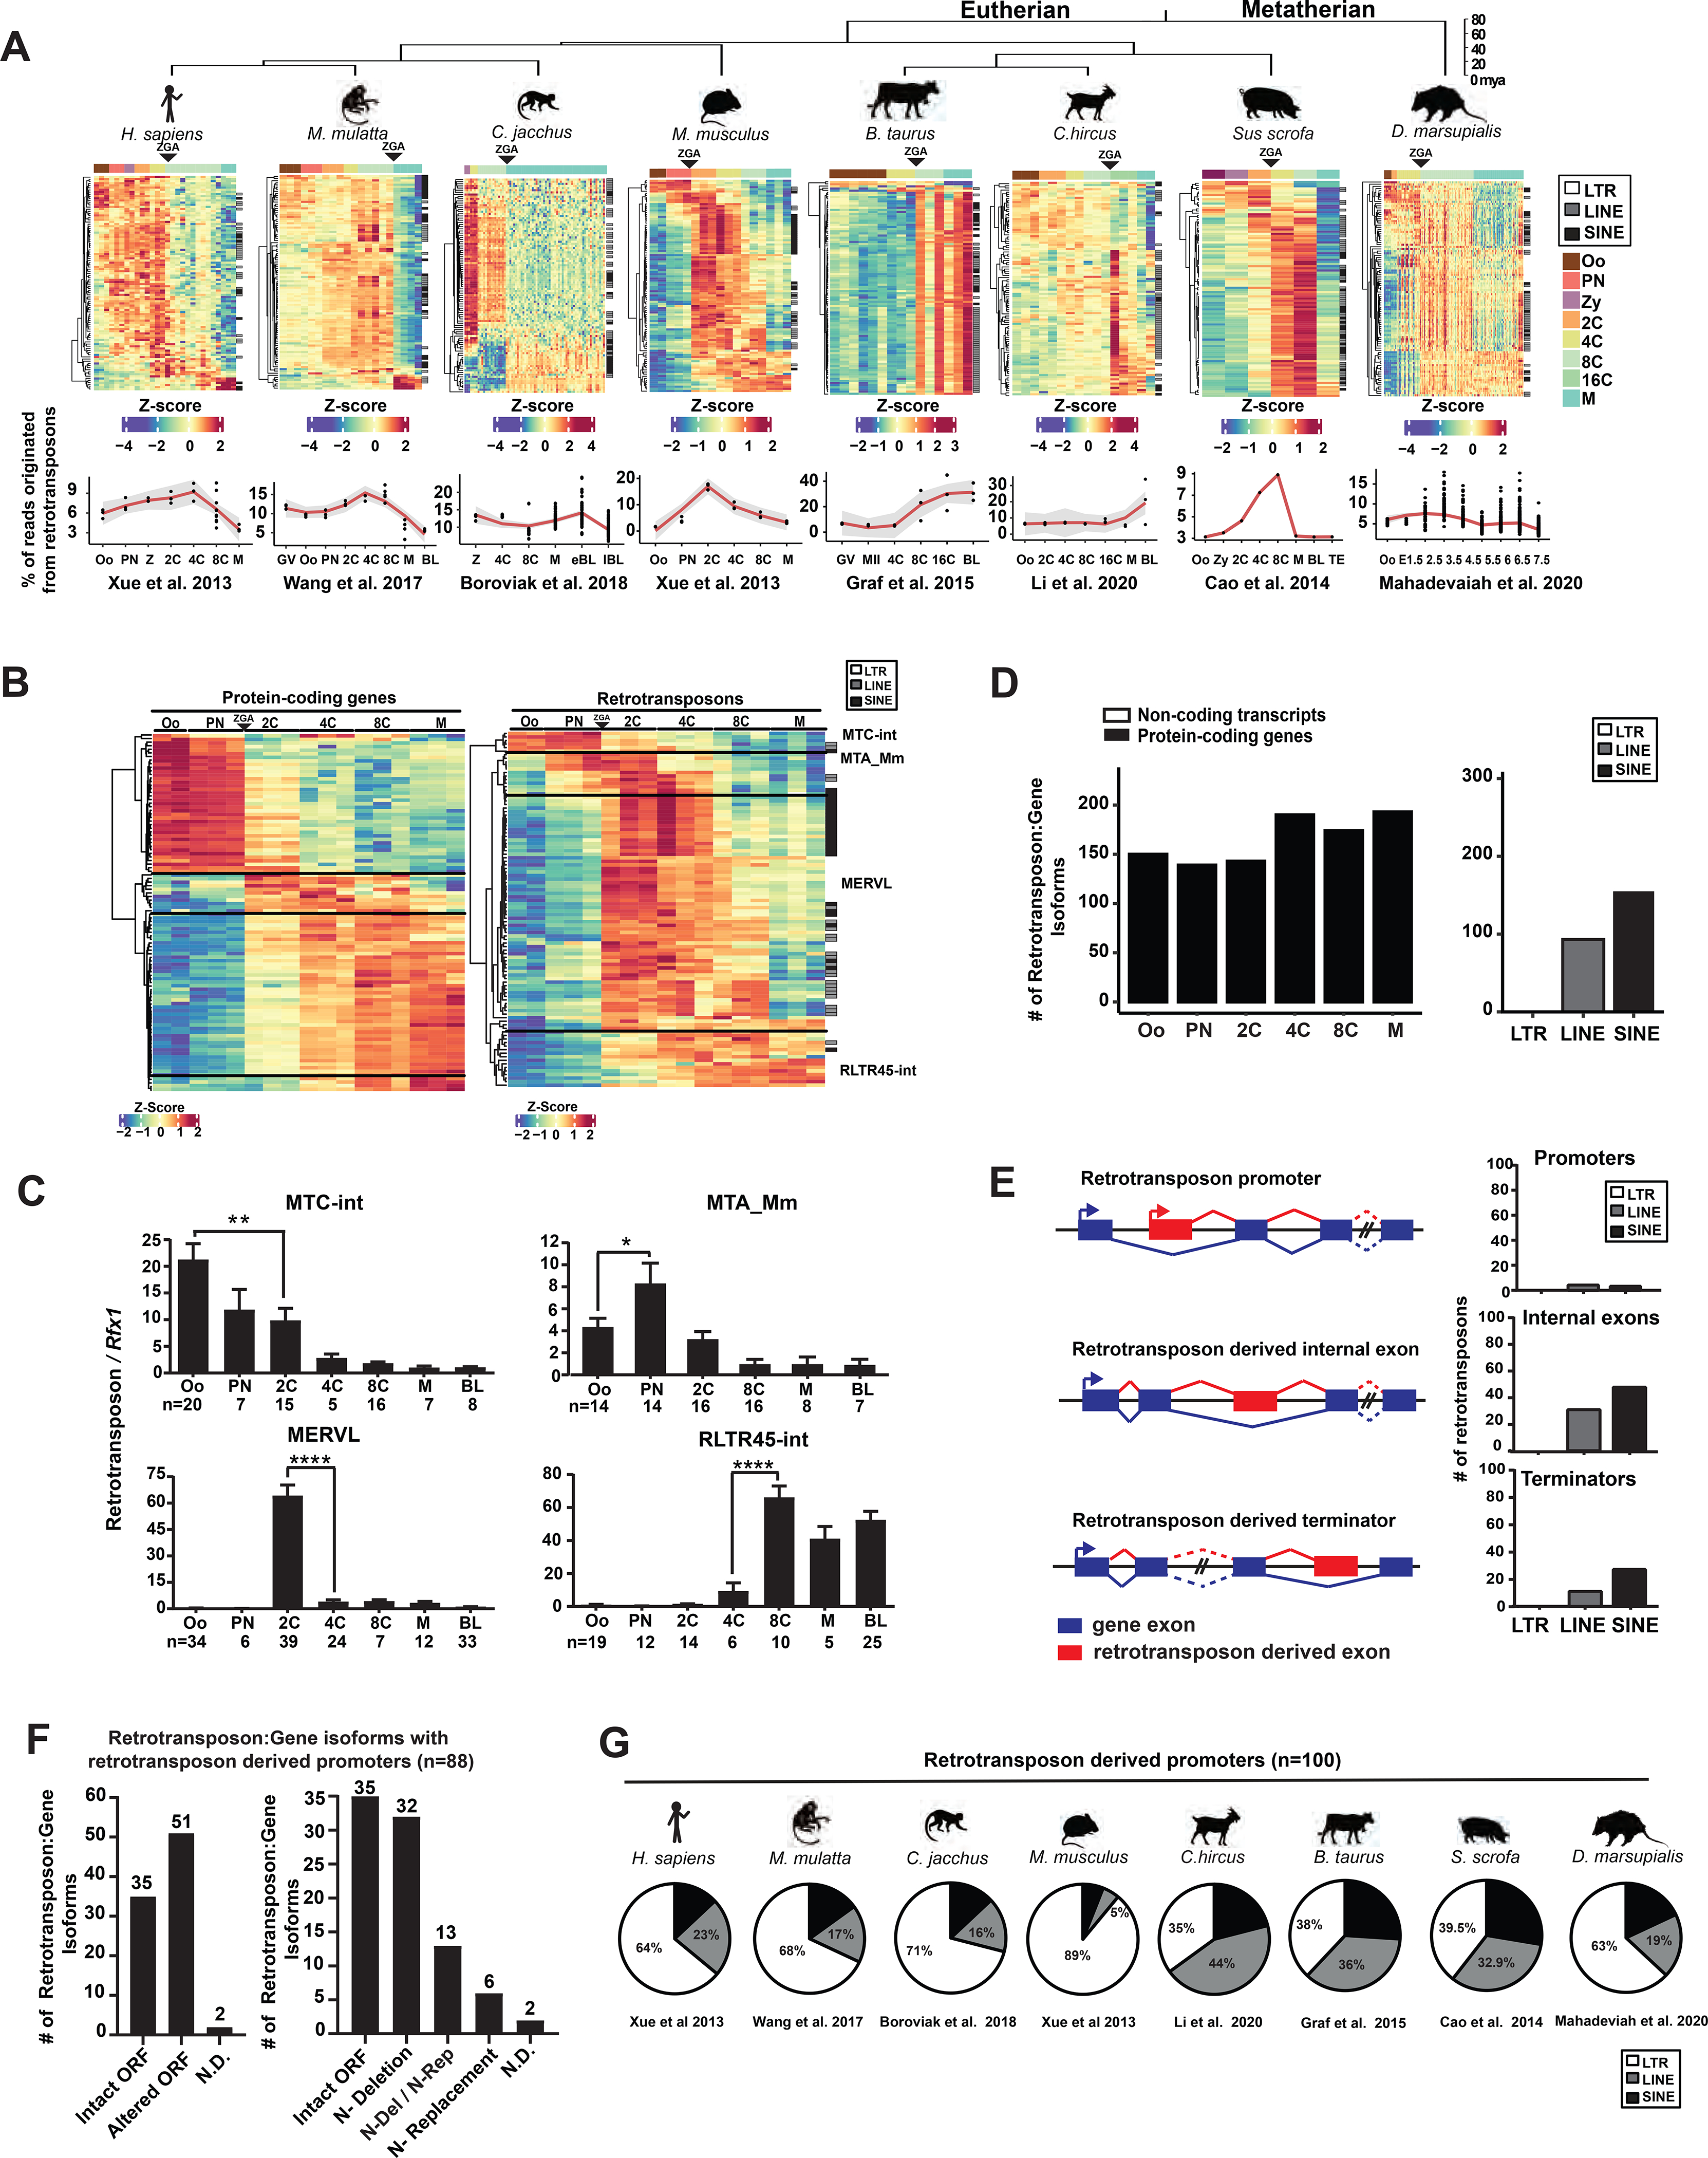
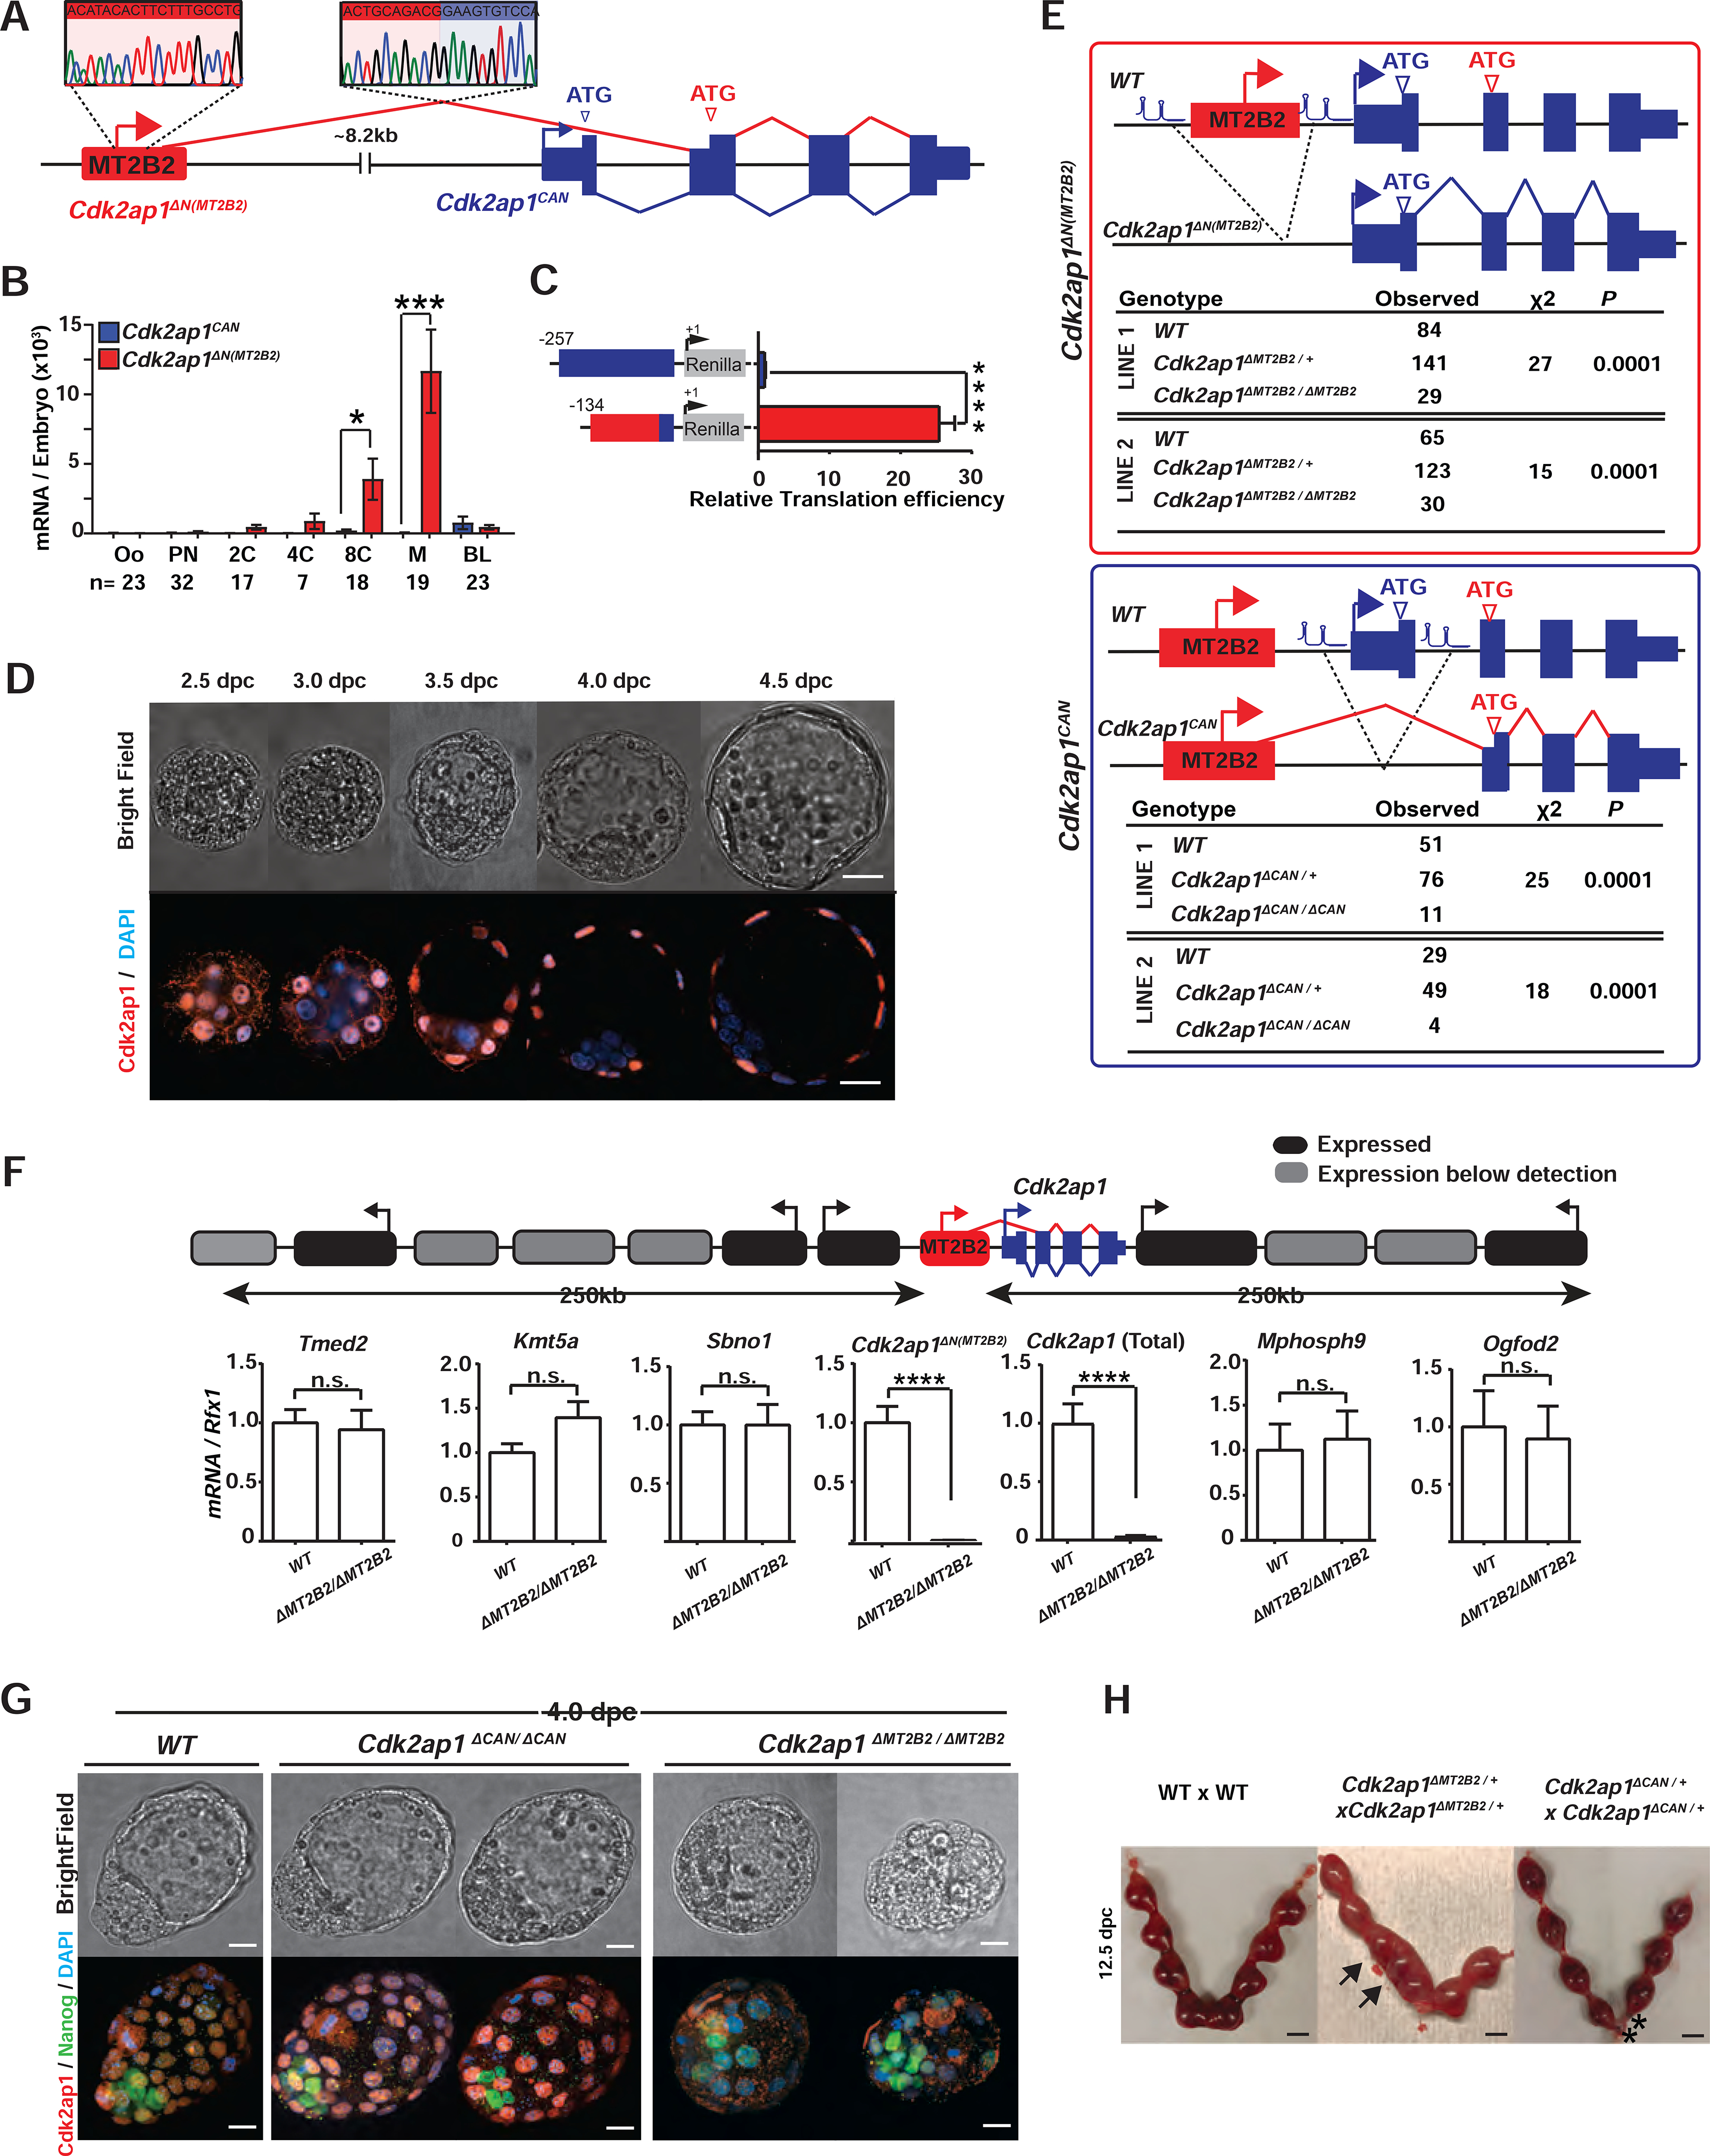
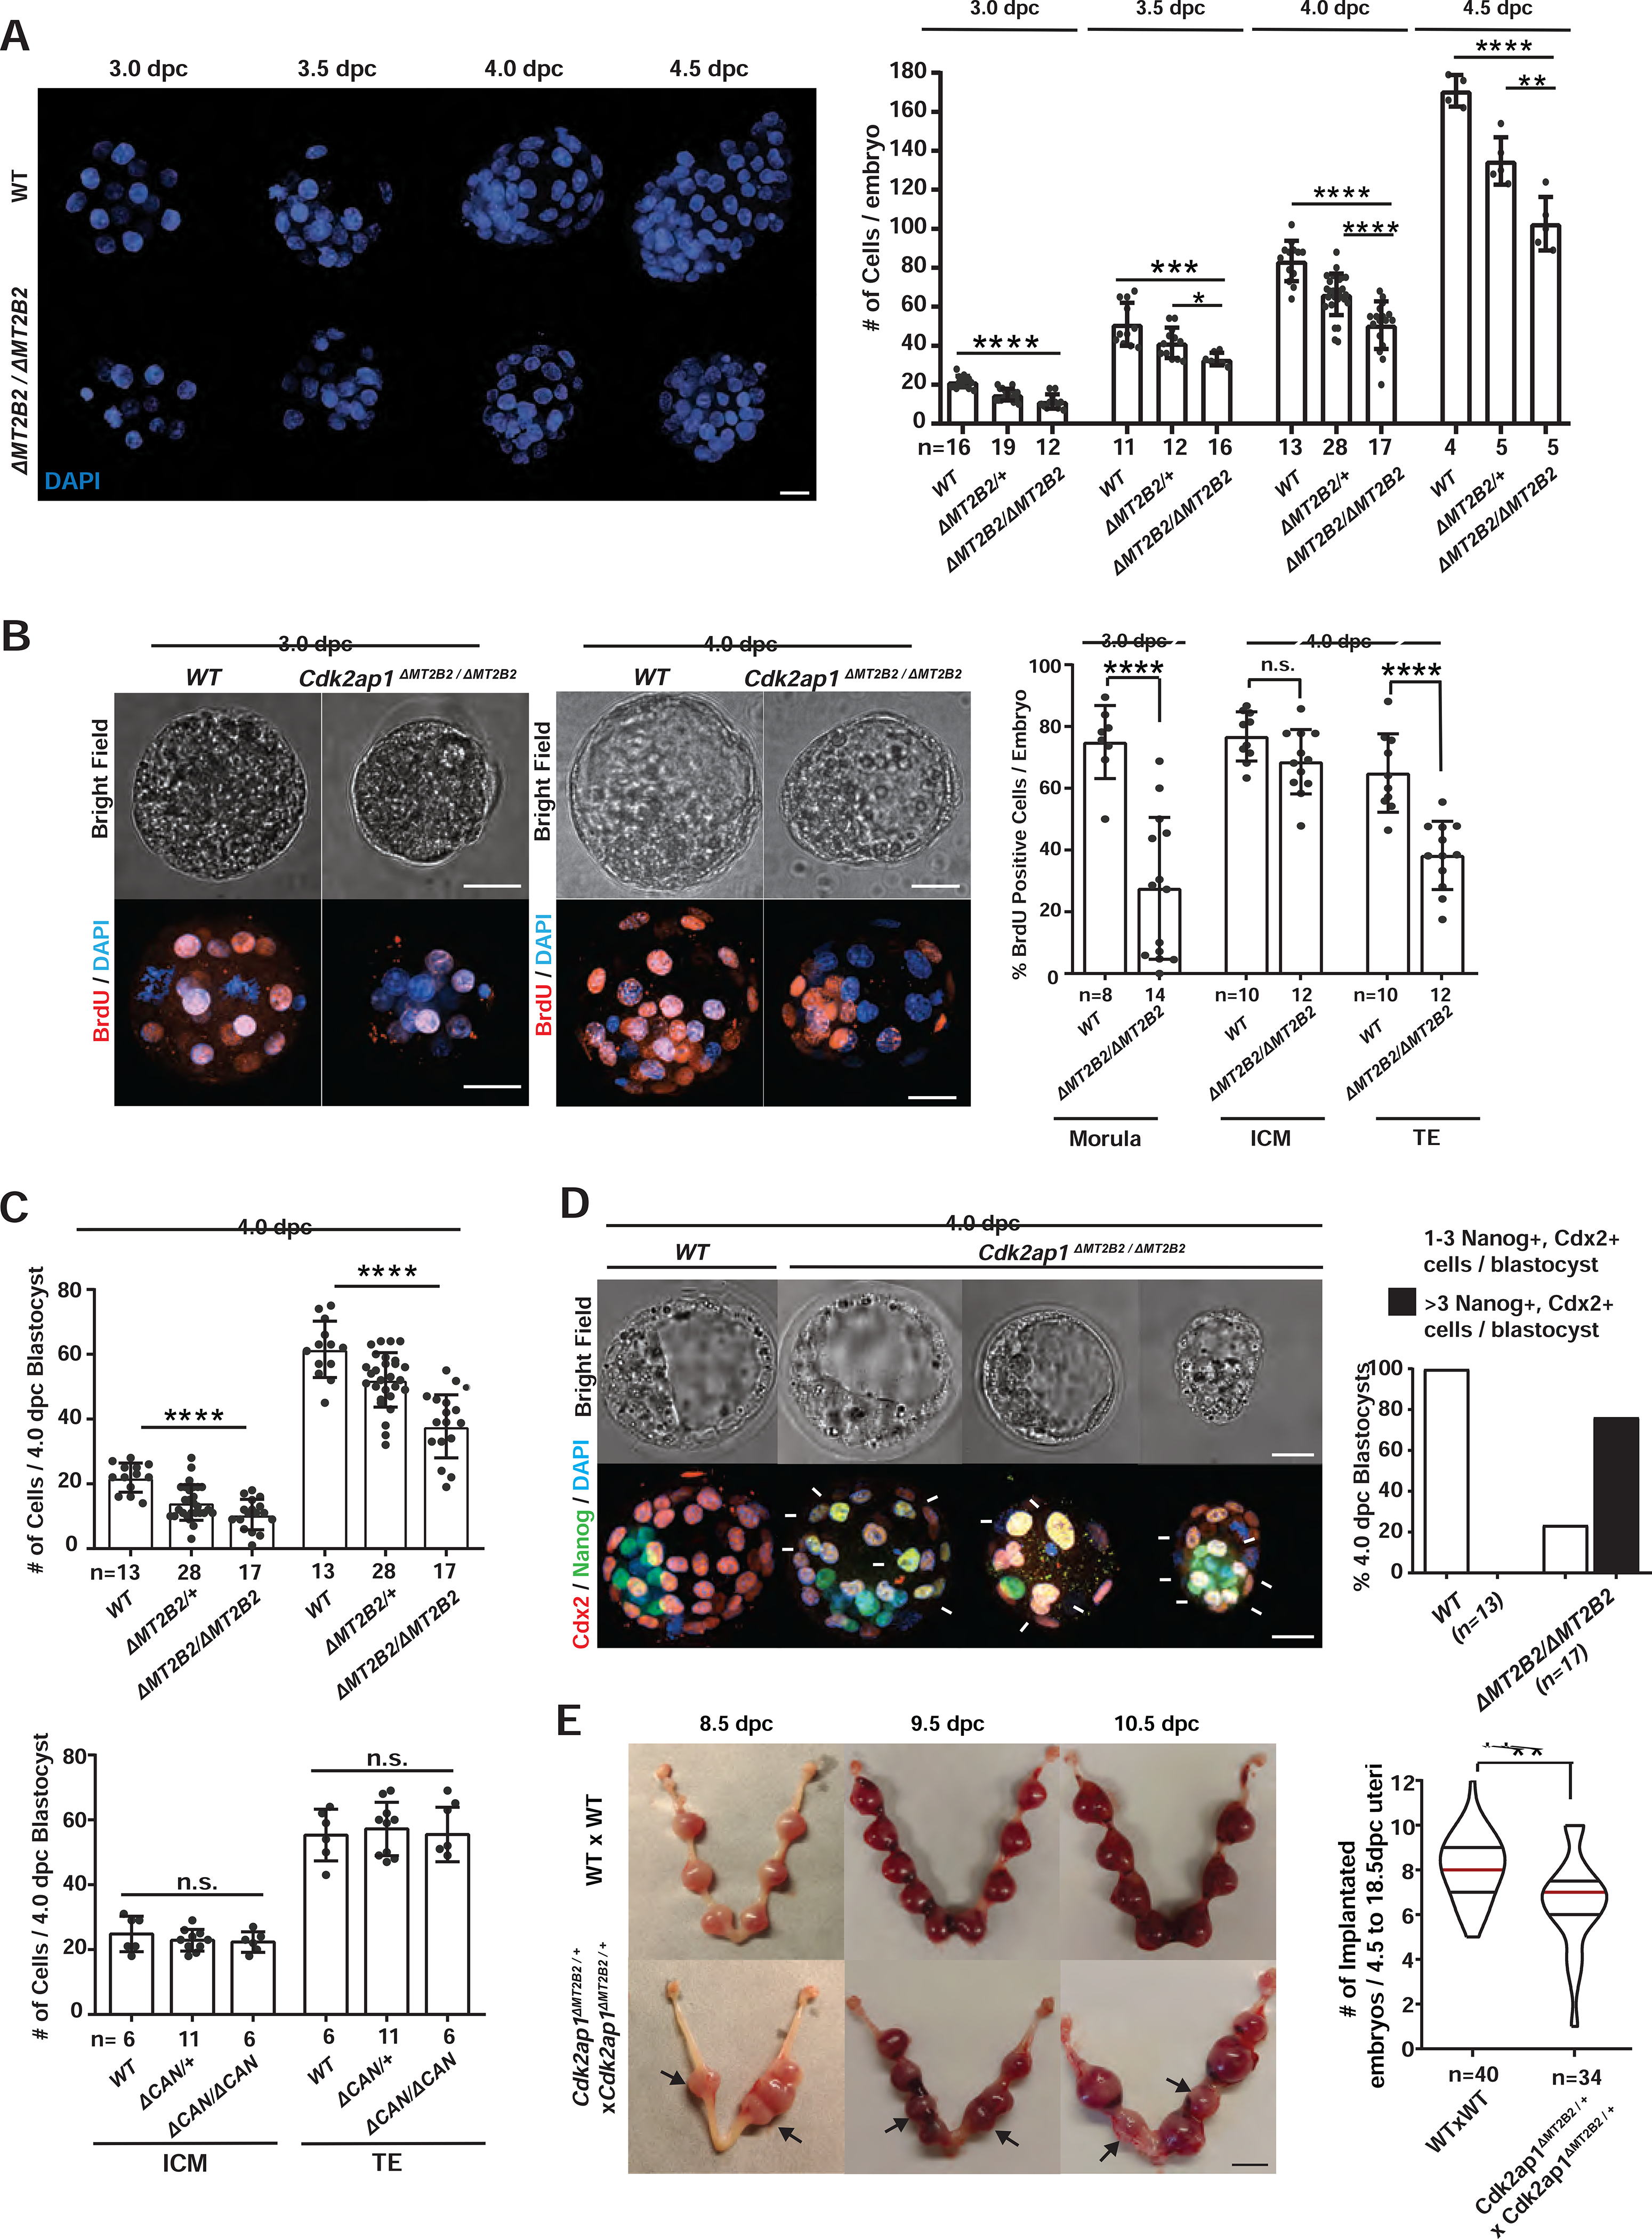
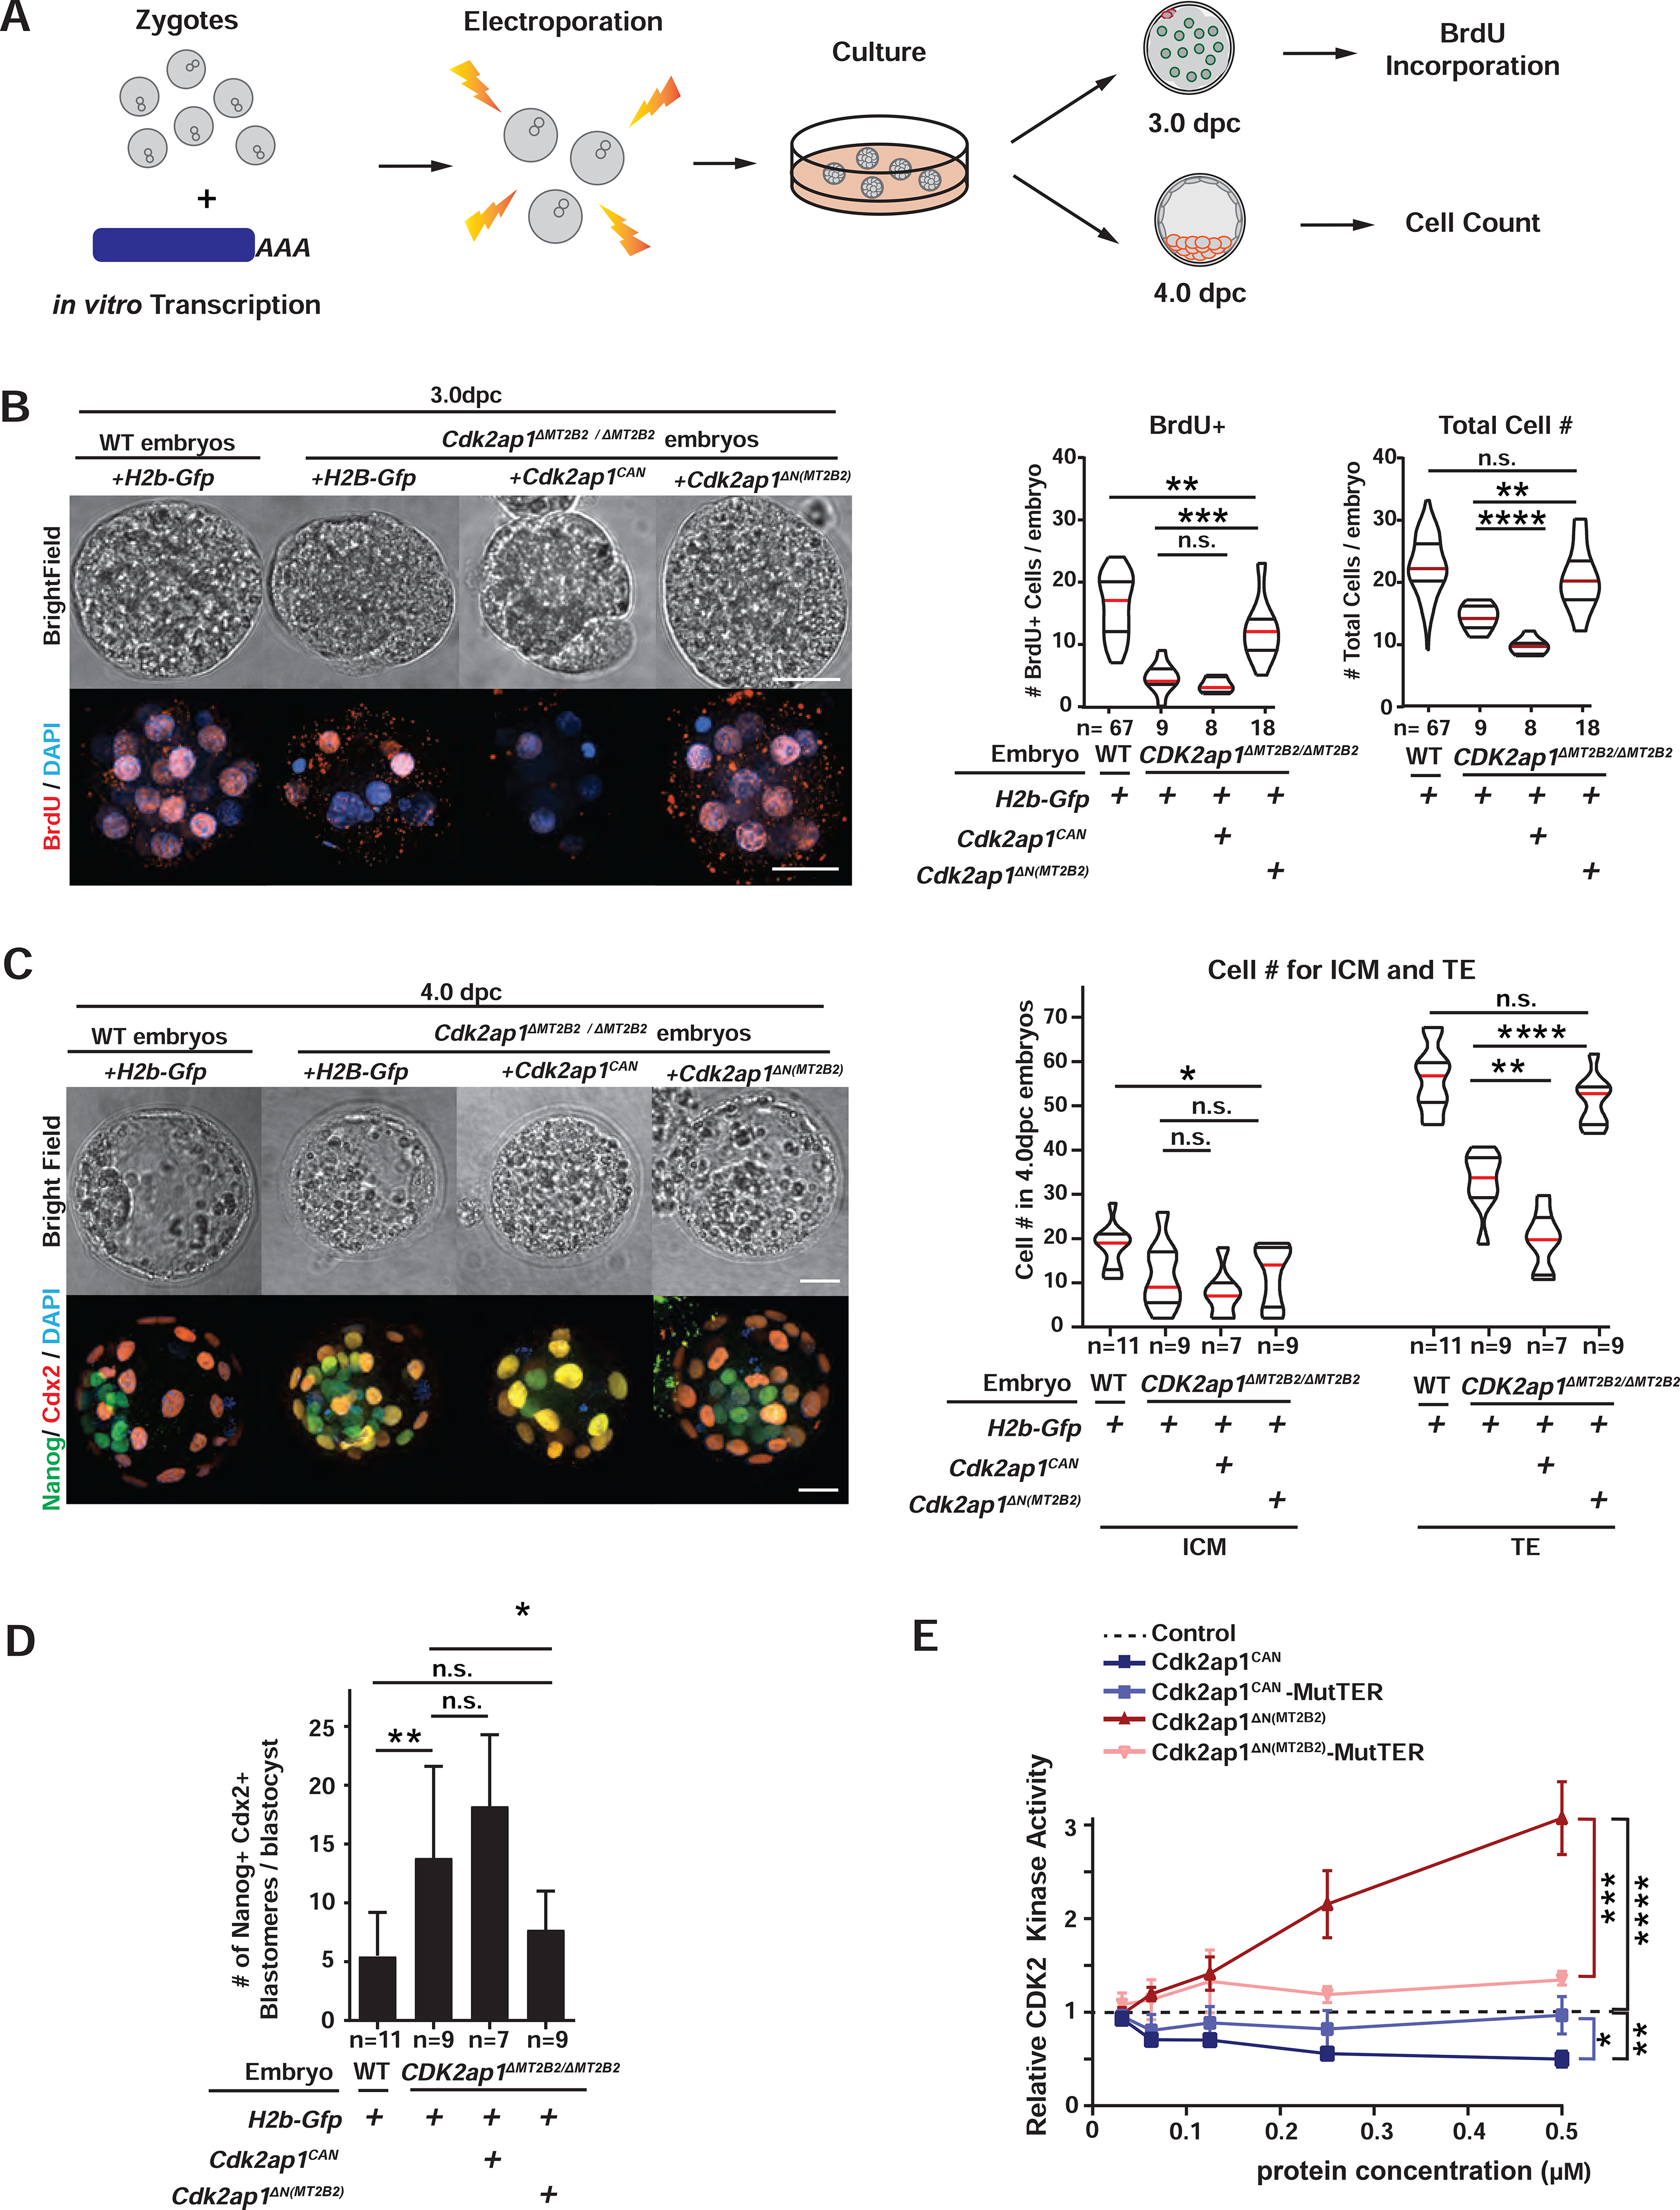
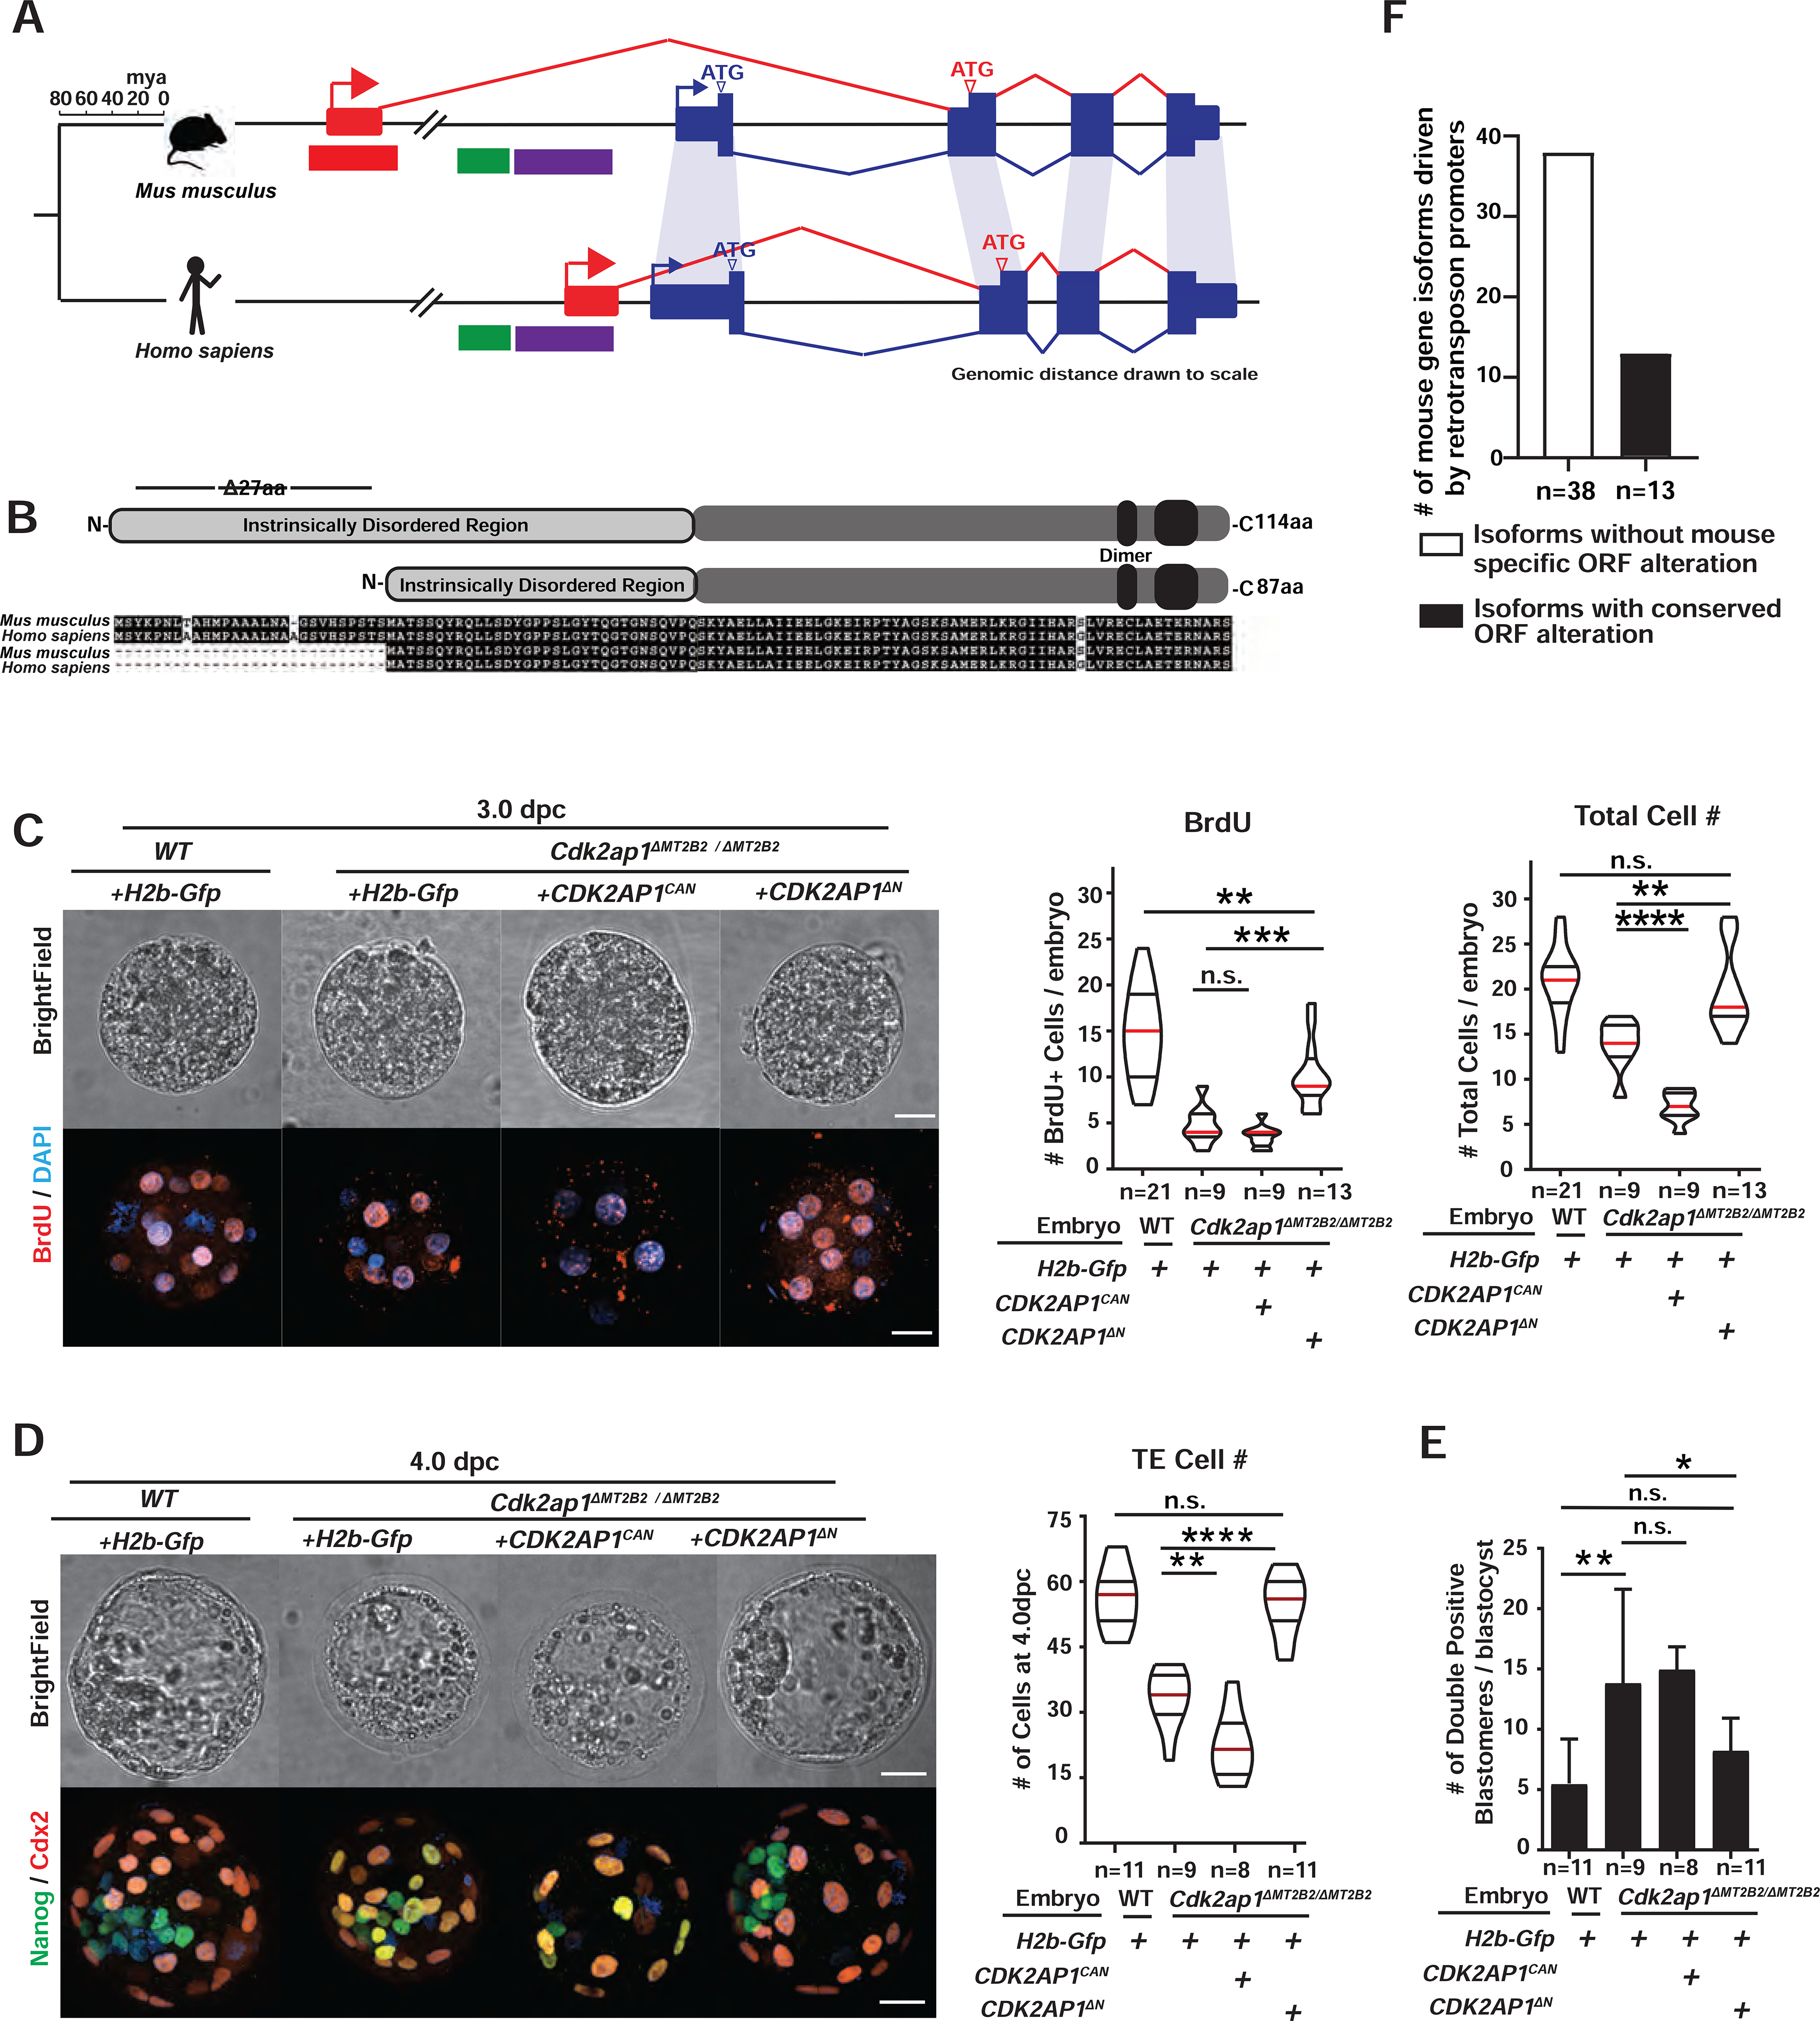
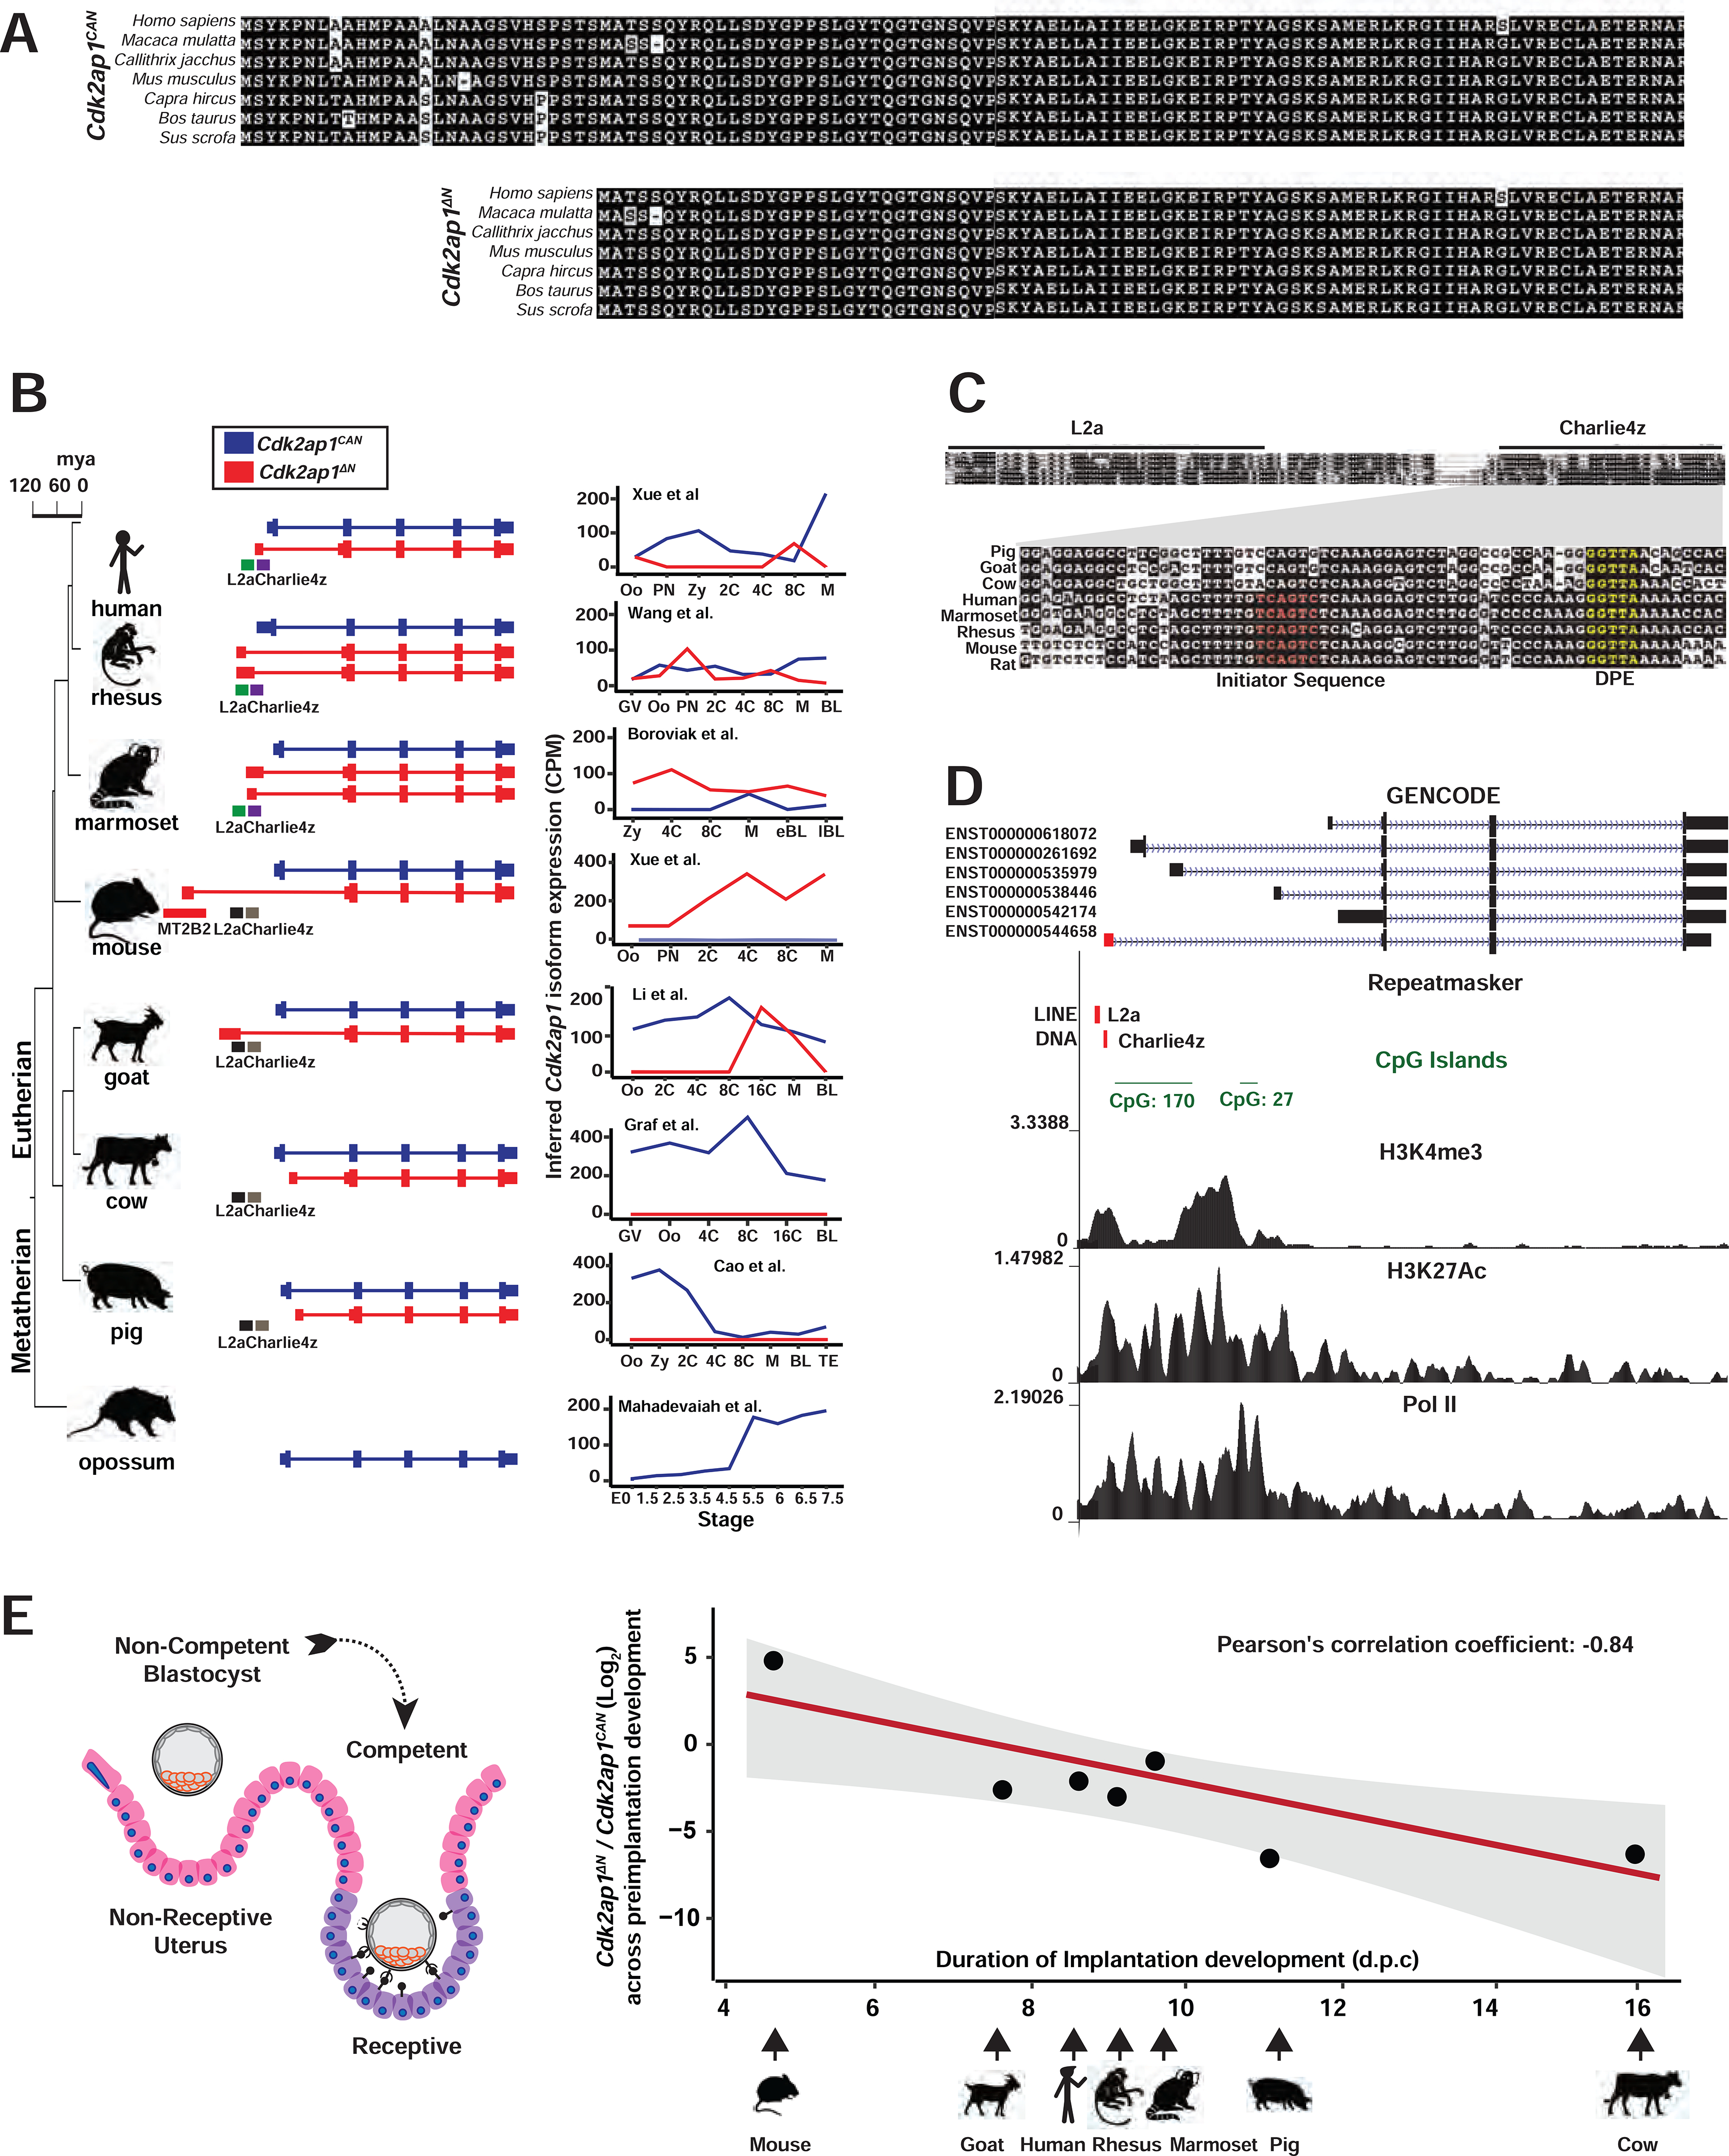
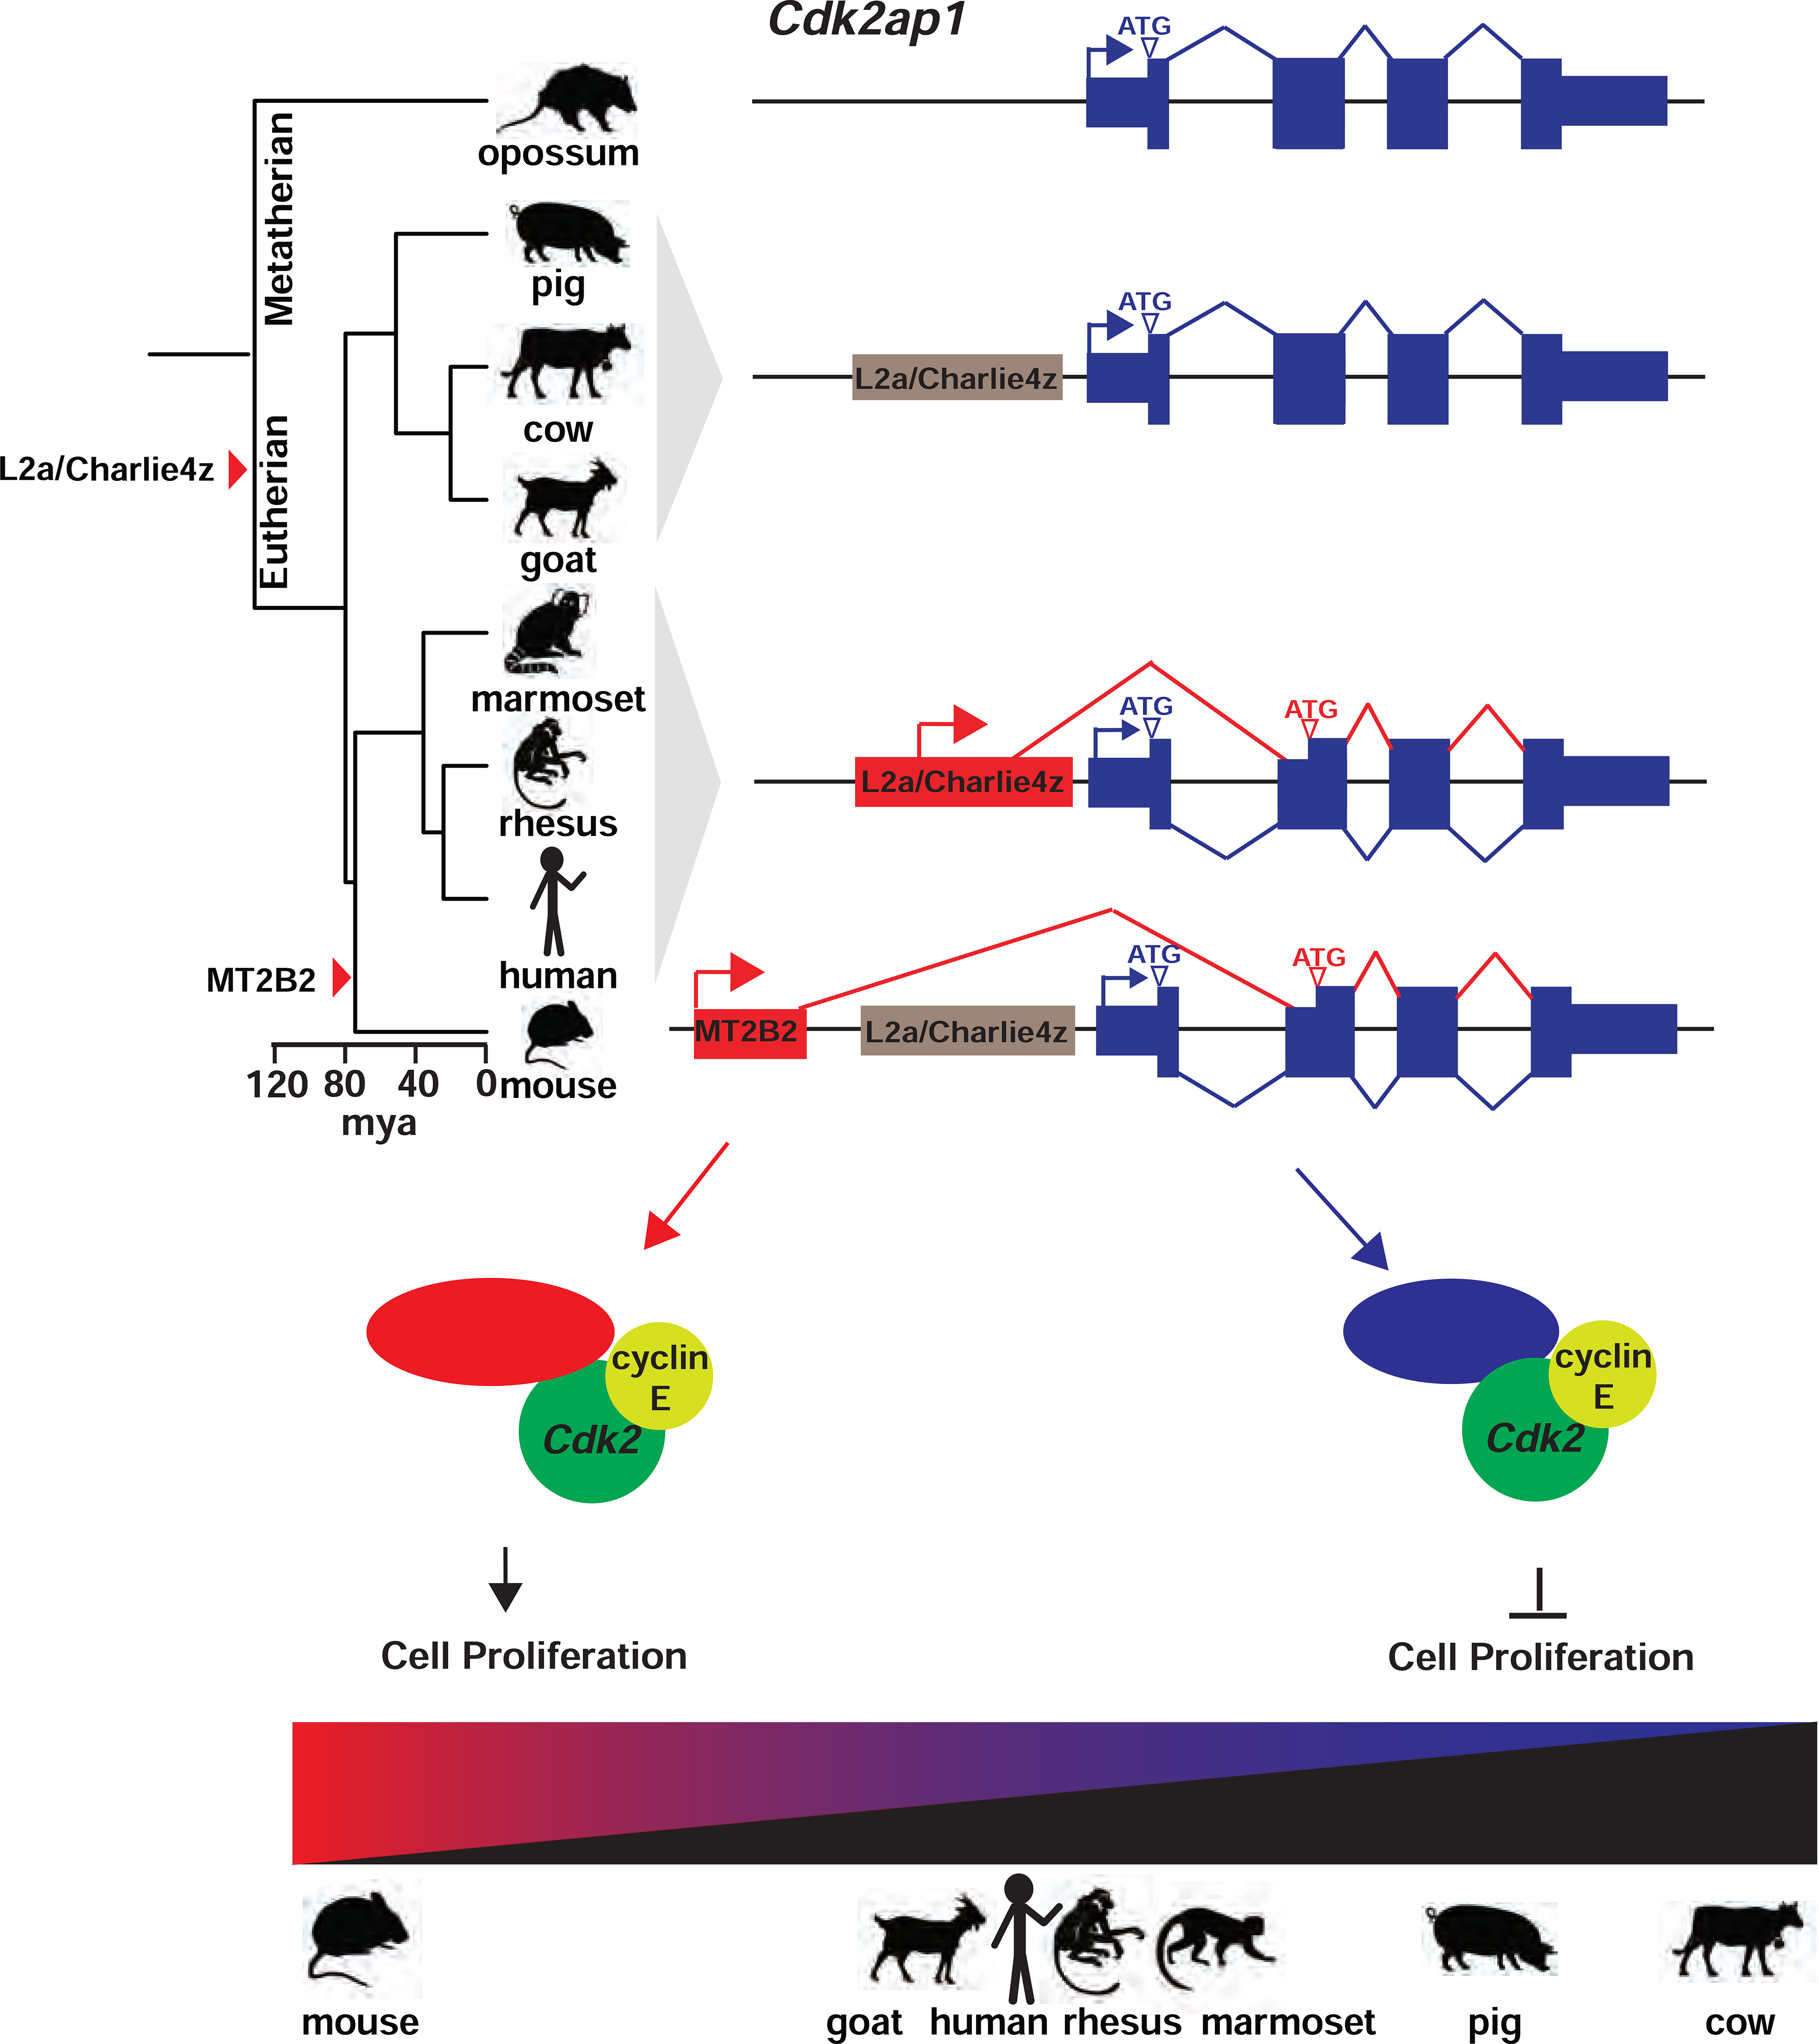
Retrotransposons mediate gene regulation in important developmental and pathological processes. Here, we characterized the transient retrotransposon induction during preimplantation development of eight mammals. Induced retrotransposons exhibit similar preimplantation profiles across species, conferring gene regulatory activities, particularly through long terminal repeat (LTR) retrotransposon promoters. A mouse-specific MT2B2 retrotransposon promoter generates an N-terminally truncated Cdk2ap1ΔN that peaks in preimplantation embryos and promotes proliferation. In contrast, the canonical Cdk2ap1 peaks in mid-gestation and represses cell proliferation. This MT2B2 promoter, whose deletion abolishes Cdk2ap1ΔN production, reduces cell proliferation and impairs embryo implantation, is developmentally essential. Intriguingly, Cdk2ap1ΔN is evolutionarily conserved in sequence and function yet is driven by different promoters across mammals. The distinct preimplantation Cdk2ap1ΔN expression in each mammalian species correlates with the duration of its preimplantation development. Hence, species-specific transposon promoters can yield evolutionarily conserved, alternative protein isoforms, bestowing them with new functions and species-specific expression to govern essential biological divergence.

Keywords: Cdk2; Cdk2ap1; cell proliferation; implantation; mammals; mouse; preimplantation embryos; promoters; retrotransposons; transposons.


Conflict of interest statement

Declaration of interests The authors declare no competing interests.

Figures

Figure 1.
Figure 1.. Retrotransposons mediate gene regulation in mammalian preimplantation development.
A. Retrotransposons are highly and dynamically expressed in preimplantation embryos across mammals. RNA-seq data from each species were subjected to TEtranscripts analyses to quantify the number of mappable RNA-seq reads at protein-coding genes, non-coding transcripts and retrotransposons. For each species, a heatmap exhibits the preimplantation profile of the top 100 most highly and differentially expressed retrotransposon subfamilies, and line graphs show the percentage of transcriptome from retrotransposon loci. B. TEtranscripts analyses revealed similar profiles of retrotransposon and protein-coding gene in mouse preimplantation embryos, as shown by the heatmap of the top 100 most highly and differentially expressed protein-coding genes (left) and retrotransposon subfamilies (right). Four distinct patterns emerged. A, B. Z-score, the number of standard deviations from the expression mean of a retrotransposon subfamily or a protein-coding gene. Oo, oocyte; Zy, zygotes; PN, pronucleus; 2C, two cell embryo; 4C, four cell embryo; 8C, eight cell embryo; 16C, sixteen cell embryos; M, morula; BL, blastocysts. C. Single embryo real time PCR analyses confirm the dynamic expression patterns of four representative retrotransposon subfamilies. Error bars, ± s.e.m. P values were calculated using unpaired, two-tailed Student’s t test. (MTC-int, Oo vs. 2C, **P = 0.009, t=2.8, df=33 MTA_Mm, Oo vs. PN, *P = 0.04 t=2.1, df=26; MERVL, 2C vs. 4C, ****P < 0.0001 t=7.4, df=62; RLTR45-int, 4C vs 8C, ****P < 0.0001 t=5.2, df=16). D. Preimplantation-specific, retrotransposon:gene splicing junctions preferentially associate with protein-coding genes in preimplantation embryos. Retrotransposon:gene isoforms of GENCODE annotated protein-coding genes (black) and non-coding transcripts (white) are shown as bar plots for all preimplantation stages (left). Retrotransposon:gene isoforms containing LTR, LINE or SINE retrotransposons are each quantified (right). Only highly expressed retrotransposon:gene splicing junctions (an average of ≥ 30 reads across preimplantation stages) are included in these analyses. E. Retrotransposons mediate gene regulation as alternative promoters, internal exons and terminators for proximal gene isoforms (left). The top 250 most highly and differentially expressed retrotransposons that yield gene promoters (TSS within retrotransposon), internal exons and terminators were classified by LTRs, LINEs and SINEs (right). F. Retrotransposon promoters frequently drive gene isoforms with N-terminally altered ORFs. Among the 250 most highly and differentially expressed retrotransposon:gene isoforms in mouse preimplantation embryos, 88 are driven by retrotransposon promoters. Manual curation predicts frequent ORFs alterations caused by retrotransposon promoters (left), which are further classified based on the mechanisms of ORF alteration (right). N-Deletion, predicted N-terminal truncation; N-Replacement, predicted sequence replacement of the protein N-terminus; N-Del/N-Rep, predicted as either N-terminal deletions or N-terminal sequence replacements, due to uncertainty in ATG prediction; N.D., not determined. G. Retrotransposon promoters in mammalian preimplantation embryos are enriched for LTR retrotransposons. The proportion of LTR, LINE or SINE retrotransposons was determined for the top 100 most highly and dynamically expressed retrotransposon promoters in preimplantation embryos of 8 mammalian species. RNA-seq data for 1B, 1D, 1E and 1F analyses were obtained from Xue et al. 2013. All P values were calculated using unpaired, two-tailed Student’s t test. n.s., not significant. See also Figure S1 and Tables S1–S5.
Figure 2.
Figure 2.. Canonical Cdk2ap1 and MT2B2 driven Cdk2ap1ΔN (MT2B2) differ in function.
A. Diagram illustrates the gene structure of canonical Cdk2ap1CAN (blue) and Cdk2ap1ΔN (MT2B2) (red) isoforms. 5’ RACE confirms TSS within the MT2B2 element; RT-PCR confirms splicing between MT2B2 and Cdk2ap1 exon 2. B. Absolute real-time PCR quantification of single embryos compares the level of Cdk2ap1CAN and Cdk2ap1ΔN (MT2B2). Error bars, s.e.m. Cdk2ap1CAN vs. Cdk2ap1ΔN (MT2B2) at 8C, n=17, *P = 0.02, t=2.5, df=34; Cdk2ap1CAN vs. Cdk2ap1ΔN (MT2B2) at morula, n=19, ***P = 0.0004, t=3.9, df=36. C. MT2B2 derived 5’UTR enhances the translation efficiency of Cdk2ap1ΔN (MT2B2). The 5’UTR of Cdk2ap1CAN or Cdk2ap1ΔN (MT2B2) were each cloned 5’ to a Renilla luciferase reporter to measure its impact on translation in HEK293 cells. The MT2B2 derived 5’UTR was associated with a higher translation efficiency. Three independent experiments were performed in triplicate per condition. Error bars, s.e.m; **** P < 0.0001, t=20.44, df=4. D. Mouse preimplantation embryos between 2.5 dpc to 4.5 dpc were immunostained for Cdk2ap1. Cdk2ap1 protein expresses in the outer cells of morulae and the TE cells in blastocysts. Confocal images are representative of 4 or more embryos per stage. Scale bar, 20μm. E. Diagrams illustrate CRISPR genome engineering strategy for targeted deletion of Cdk2ap1ΔN (MT2B2) (top) and Cdk2ap1CAN (bottom). Mendelian ratios of progenies from Cdk2ap1ΔMT2B2/+ × Cdk2ap1ΔMT2B2/+ crosses (top) or Cdk2ap1ΔCAN/+ × Cdk2ap1ΔCAN/+ crosses (bottom) were documented at postnatal day 10 (p10), demonstrating a significant reduction of viability in both genotypes. Two independent Cdk2ap1ΔMT2B2/ΔMT2B2 and Cdk2ap1ΔCAN/ΔCAN lines were analyzed. F. The MT2B2 deletion specifically abolishes Cdk2ap1ΔN (MT2B2) expression, without impacting any neighboring genes. Age matched wildtype (n=9) and Cdk2ap1ΔMT2B2/ΔMT2B2 (n=7) morula embryos were collected from two independent WT × WT and Cdk2ap1ΔMT2B2/ΔMT2B2 × Cdk2ap1ΔMT2B2/ΔMT2B2 crosses, respectively, and were subjected to single embryo real-time PCR analyses to measure the expression of Cdk2ap1ΔN (MT2B2), total Cdk2ap1 and all neighboring genes with 250 kb of the deletion. Black, expressed genes; grey, genes below detection; error bars, s.e.m. Cdk2ap1 (Total), wildtype (n=3) vs. Cdk2ap1ΔMT2B2/ΔMT2B2 (n=3), ****P < 0.0001, t=16.8, df=4; Cdk2ap1ΔN (MT2B2), wildtype (n=9) vs. Cdk2ap1ΔMT2B2/ΔMT2B2 (n=7), ***P = 0.0002, t=4.9, df=14. G. Cdk2ap1ΔMT2B2/ΔMT2B2 embryos, but not Cdk2ap1ΔCAN/ΔCAN embryos, exhibit defective Cdk2ap1 protein expression in TE and impaired blastocyst formation. Representative confocal images for Cdk2ap1 and Nanog immunostaining are shown for wildtype (n=11), Cdk2ap1ΔCAN/ΔCAN (n=5) and Cdk2ap1ΔMT2B2/ΔMT2B2 (n=6) embryos. Scale bar, 25 μm. H. Deletion of Cdk2ap1ΔN (MT2B2), but not Cdk2ap1CAN, is associated with embryo implantation spacing defects. At E12.5, embryo crowding is evident in uteri from the Cdk2ap1ΔN (MT2B2)/+ × Cdk2ap1ΔN (MT2B2)/+ crosses (n=34), while resorption of correctly spaced embryos is evident in uteri from the Cdk2ap1ΔCAN/+ × Cdk2ap1ΔCAN/+ crosses (n=7). Black arrows, embryo crowding; *, resorbed embryos. Scale bars, 0.5 cm. All P values were calculated using unpaired, two-tailed Student’s t test. n.s., not significant. See also Figure S2 and Table S4.
Figure 3.
Figure 3.. An MT2B2 promoter drives a Cdk2ap1ΔN (MT2B2) isoform to promote cell proliferation.
A. Cdk2ap1ΔMT2B2/ΔMT2B2 preimplantation embryos exhibited reduced cell number. Littermate-controlled wildtype (n=44), Cdk2ap1ΔMT2B2/+ (n= 64) and Cdk2ap1ΔMT2B2/ΔMT2B2 (n=50) embryos were collected at 3.0 dpc, 3.5 dpc, 4.0 dpc and 4.5 dpc from 29 Cdk2ap1ΔMT2B2/+ to Cdk2ap1ΔMT2B2/+ mating. Representative images of DAPI staining (left) and cell number quantitation (right) are shown for each stage. Scale bar, 25 μm; error bars, s.d.. Wildtype vs. Cdk2ap1ΔMT2B2/ΔMT2B2: 3.0 dpc, **** P < 0.0001, t=8.2, df=26; 3.5 dpc, *** P = 0.0007, t=4.2, df=15; 4.0 dpc, **** P < 0.0001, t=7.8, df=28; 4.5 dpc, **** P < 0.0001, t=8.7, df=7. Cdk2ap1ΔMT2B2/+vs Cdk2ap1ΔMT2B2/ΔMT2B2, 3.5 dpc, * P = 0.03, t=2.4, df=16; 4.0 dpc, **** P < 0.0001, t=4.5, df=43; 4.5 dpc, ** P = 0.005, t=3.9, df=8. B. Cdk2ap1ΔMT2B2/ΔMT2B2 embryos exhibit decreased BrdU incorporation. Representative confocal images (left) and quantitation (right) of BrdU staining are shown for embryos at 3.0 and 4.0 dpc. Age matched wildtype (n=18) and Cdk2ap1ΔMT2B2/ΔMT2B2 (n=26) morulae and blastocysts were collected from wildtype × wildtype and Cdk2ap1ΔMT2B2/ΔMT2B2 × Cdk2ap1ΔMT2B2/ΔMT2B2 mating, respectively. Scale bars, 20 μm; error bars, s.d.. Wildtype vs. Cdk2ap1ΔMT2B2/ΔMT2B2: morula, **** P < 0.0001, t=7.9, df=20; TE, **** P < 0.0001, t=5.3, df=20. C. Cdk2ap1ΔMT2B2/ΔMT2B2, but not Cdk2ap1ΔCAN/ΔCAN blastocysts, exhibit decreased cell number in ICM and TE. Blastocysts (n=58) from Cdk2ap1ΔMT2B2/+ × Cdk2ap1ΔMT2B2/+ crosses, and blastocysts (n=23) from Cdk2ap1ΔCAN/+ × Cdk2ap1ΔCAN/+ crosses were immunostained for Nanog and Cdx2 to quantify ICM and TE cell numbers, respectively. Scale bars, 25 μm; error bars, s.d.. Wildtype vs Cdk2ap1ΔMT2B2/ΔMT2B2: ICM, **** P < 0.0001, t=6.7, df=28; TE, **** P < 0.0001, t=6.9, df=28. D. The MT2B2 deletion impairs cell fate specification in blastocysts. Littermate controlled wildtype (n=13) and Cdk2ap1ΔMT2B2/ΔMT2B2 (n=17) blastocysts were immunostained for Nanog and Cdx2 at 4.0 dpc. Representative confocal images (left) and quantitation (right) are shown for Nanog and Cdx2 staining in wildtype and Cdk2ap1ΔMT2B2/ΔMT2B2 embryos. The presence of ≥ 3 Nanog and Cdx2 double positive cells in any blastocysts indicates impaired cell fate specification. White arrows, Nanog and Cdx2 double positive cells. Scale bar, 0.5 cm. E. The deletion of the MT2B2 element caused aberrant embryo spacing and impaired implantation. Representative images are shown for embryo implantation at 8.5, 9.5 and 10.5 dpc in wildtype × wildtype and Cdk2ap1ΔMT2B2/+ × Cdk2ap1ΔMT2B2/+ crosses (left). Black arrows, Cdk2ap1ΔMT2B2/ΔMT2B2 embryos; scale bar, 0.5 cm. Quantitation of implanted embryos from 4.5 to 18.5 dpc per uterus is shown for wildtype × wildtype (n=40), Cdk2ap1ΔMT2B2/+ × Cdk2ap1ΔMT2B2/+ (n=34), with median (red line) as well as lower (25%) and upper (75%) quartiles (black lines). Wildtype × wildtype vs. Cdk2ap1ΔMT2B2/+, ** P = 0.002, t=3.2, df=72. All P values were calculated using unpaired, two-tailed Student’s t test. n.s., not significant. See also Figure S3.
Figure 4.
Figure 4.. Cdk2ap1ΔN (MT2B2) and Cdk2ap1CAN have opposite effects in cell proliferation.
A. Diagram illustrates the experimental scheme for mRNA electroporation into zygotes. B, C. Cdk2ap1CAN and Cdk2ap1ΔN (MT2B2) have opposite effects on S-Phase entry and cell proliferation. H2b-Gfp, Cdk2ap1CAN or Cdk2ap1ΔN (MT2B2) mRNAs were each electroporated into Cdk2ap1ΔMT2B2/ΔMT2B2 zygotes, and (B) resulted morula were compared for BrdU incorporation at 3.0 dpc. Ectopic expression of Cdk2ap1ΔN (MT2B2) restores S-Phase entry and cell proliferation in Cdk2ap1ΔMT2B2/ΔMT2B2 embryos (B). Representative images (left) and quantitation of BrdU positive and total cell number (right) are shown. Violin plots are shown with median (red), as well as lower (25%) and upper (75%) quartiles (black). Scale bars, 20 μm. H2b-Gfp vs Cdk2ap1CAN in Cdk2ap1ΔMT2B2/ΔMT2B2 embryos: BrdU, n.s.; total cell number, **** P < 0.0001, t=5.7, df=15. H2b-Gfp vs Cdk2ap1ΔN (MT2B2) in Cdk2ap1ΔMT2B2/ΔMT2B2 embryos: BrdU, *** P =0.0002, t=4.5, df=25; total cell number, ** P =0.002, t=3.4, df=25. C, D. Ectopic expression of Cdk2ap1ΔN (MT2B2) rescues cell proliferation and cell fate specification defects in Cdk2ap1ΔMT2B2/ΔMT2B2 embryos. D. Representative confocal image of Cdx2 and Nanog immunostaining (left) and quantitation of ICM and TE cell number (right) are shown for 4.0 dpc Cdk2ap1ΔMT2B2/ΔMT2B2 embryos with overexpression of Cdk2ap1CAN or Cdk2ap1ΔN (MT2B2). Scale bars, 20 μm; White arrows, Nanog and Cdx2 double positive cells. H2b-Gfp vs Cdk2ap1CAN, TE, ** P =0.002, t=3.9, df=14; H2b-Gfp vs Cdk2ap1ΔN (MT2B2, TE, **** P < 0.0001, t=6.1, df=16. D. Quantitation of Nanog and Cdx2 double positive cells is shown for Cdk2ap1ΔMT2B2/ΔMT2B2 embryos overexpressing Cdk2ap1CAN or Cdk2ap1ΔN (MT2B2). H2b-Gfp-overexpressing wildtype vs. Cdk2ap1ΔMT2B2/ΔMT2B2 embryos, ** P = 0.007, t=3.1, df=17; H2b-Gfp vs Cdk2ap1ΔN (MT2B2) in Cdk2ap1ΔMT2B2/ΔMT2B2) embryos, * P =0.04, t=2.2, df=16. E. Cdk2ap1CAN and Cdk2ap1ΔN (MT2B2) have opposite effects on Cdk2 kinase activity. Recombinant Cdk2ap1CAN, Cdk2ap1CAN-MutTER, Cdk2ap1ΔN (MT2B2) or Cdk2ap1ΔN (MT2B2)-MutTER protein was incubated with recombinant CDK2, CYCLIN E, and HISTONE H1 in vitro to assay their effects on CDK2 activity at different concentrations. Three independent experiments were performed. Dashed line, baseline CDK2 kinase activity with elution buffer as the “control” input. Error bars, s.e.m. Control vs Cdk2ap1CAN, **P = 0.001, t=8.4, df=4. Cdk2ap1CAN vs Cdk2ap1CAN-MutTER, *P = 0.02, t=3.8, df=4. Control vs Cdk2ap1ΔN (MT2B2), ****P < 0.0001, t=10.5, df=6; Cdk2ap1ΔN (MT2B2) vs Cdk2ap1ΔN (MT2B2)-MutTER, ***P = 0.0003, t=8.9, df=5. All P values were calculated using unpaired, two-tailed Student’s t test. n.s., not significant. See also Figure S4.
Figure 5.
Figure 5.. The MT2B2-driven Cdk2ap1ΔN isoform is evolutionarily conserved in human.
A, B. Preimplantation-specific Cdk2ap1ΔN isoforms are derived from species-specific promoters (A), but exhibit evolutionary conservation in protein sequences (B). A. Mouse Cdk2ap1ΔN originates from the MT2B2 promoter; human CDK2AP1ΔN originates from a promoter region containing an L2a and a Charlie4z hAT transposon element. Blue, canonical exons; red, alternative exons. B. Canonical Cdk2ap1 and Cdk2ap1ΔN isoforms are 97.4% and 98.8% identical, respectively, between mouse and human. C, D. Ectopic expression of CDK2AP1ΔN, but not CDK2AP1CAN, rescues defective cell proliferation in Cdk2ap1ΔMT2B2/ΔMT2B2 morulae (C) and blastocysts (D), as demonstrated by BrdU incorporation and total cell number. C. Representative confocal images of BrdU staining (left), quantification of BrdU incorporation (middle) and total cell number (right) are shown for 3.0 dpc embryos. D. Representative confocal images of Nanog and Cdx2 staining (left) and quantification of TE cell numbers (right) are shown for 4.0 dpc embryos. Scale bars, 20 μm. Quantitation is shown as violin plots with median (red), lower (25%) and upper (75%) quartiles (black). C. WT H2b-Gfp vs CDK2AP1ΔN (BrdU), ** P =0.0029, t=3.2, df=32; H2b-Gfp vs CDK2AP1ΔN (BrdU), *** P =0.0005, t=4.1, df=20; H2b-Gfp vs CDK2AP1CAN (total cell number), ****P < 0.0001, t=8.4, df=16; H2b-Gfp vs CDK2AP1ΔN (total cell number), **P = 0.0031, t=3.4, df=20. D. Cdk2ap1ΔMT2B2/ΔMT2B2 H2b-Gfp vs CDK2AP1ΔN (TE Cell number), ****P < 0.0001, t=6.9, df=18; Cdk2ap1ΔMT2B2/ΔMT2B2 H2b-Gfp vs CDK2AP1CAN (TE Cell number), **P = 0.007, t=3.1, df=15. E. Quantitation of Nanog and Cdx2 double positive cells in Cdk2ap1ΔMT2B2/ΔMT2B2 embryos overexpressing CDK2AP1ΔN or CDK2AP1CAN. H2b-Gfp-overexpressing wildtype vs. Cdk2ap1ΔMT2B2/ΔMT2B2 embryos, ** P = 0.007, t=3.1, df=17; H2b-Gfp vs CDK2AP1ΔN overexpression in Cdk2ap1ΔMT2B2/ΔMT2B2) embryos, * P =0.04, t=2.3, df=18. F. A subset of mouse-specific retrotransposon promoters drive gene isoforms harboring the evolutionarily conserved, N-terminal ORF alterations. Manual curation of the top 88 highly and differentially expressed mouse retrotransposon promoters reveals 51 that yield gene isoforms with altered ORFs. Among these, 13 (26%) correspond to Refseq annotated human isoforms that encode the same ORF alternation. See also Figure S5 and Table S5.
Figure 6
Figure 6. Transposon promoters yield species-specific expression of evolutionarily conserved Cdk2ap1ΔN isoform.
A. Alignment of Cdk2ap1CAN and Cdk2ap1ΔN isoforms across 8 mammals reveals strong evolutionary conservation in their protein sequences. B. Canonical Cdk2ap1 and Cdk2ap1ΔN exhibit species-specific differential expression in mammalian preimplantation embryos. Isoform specific expression of Cdk2ap1 in each species was determined by the total Cdk2ap1 expression and the ratio between isoform specific splicing junctions. C. In 8 mammals examined, the genomic regions containing the L2a/Charlie4z elements exhibit sequence conservation. The region between L2a and Charlie4z is the least conserved, with goat, pig and cattle harboring a small deletion, and rodents and primates exhibiting sequence variance. The Charlie4z element contains a predicted initiator sequence (red) and a DPE (Downstream Promoter Element, yellow), both implicating promoter functionality. D. The L2a/Charlie4z region acts as a bona fide CDK2AP1 promoter in human ESCs (Encode Consortium, 2012). Signatures of an active promoter (H3K4me3, H3K27Ac, and Pol II) in human ESCs are illustrated with ChIP-seq data from ENCODE and Roadmap Epigenomics project. E. The Cdk2ap1ΔN to Cdk2ap1CAN ratio is inversely correlated with the duration of preimplantation development in multiple mammals. The log2 ratio of Cdk2ap1ΔN to Cdk2ap1CAN, calculated based on the sum of normalized RNA-seq reads across isoform-specific junctions during preimplantation stages, is plotted against the duration of preimplantation development for each species. Pearson’s correlation coefficient between log2 (Cdk2ap1ΔN/Cdk2ap1CAN) and duration of preimplantation development equals to −0.84, ** P = 0.018, t = −3.5, df = 5; the P value was calculated as part of the Pearson’s product-moment correlation. See also Figure S6 and Tables S6 and S7.
Figure 7.
Figure 7.
A model on the transposon-dependent gene regulation of Cdk2ap1 in mammalian preimplantation embryos.

Comment in

References

    1. Alsayegh KN, Sheridan SD, Iyer S, and Rao RR (2018). Knockdown of CDK2AP1 in human embryonic stem cells reduces the threshold of differentiation. PLoS One 13, e0196817. - PMC - PubMed
    1. Ardeljan D, Taylor MS, Ting DT, and Burns KH (2017). The Human Long Interspersed Element-1 Retrotransposon: An Emerging Biomarker of Neoplasia. Clin. Chem 63, 816–822. - PMC - PubMed
    1. Ayarpadikannan S, and Kim H-S (2014). The Impact of Transposable Elements in Genome Evolution and Genetic Instability and Their Implications in Various Diseases. Genomics Inform. 12, 98. - PMC - PubMed
    1. Batut P, Dobin A, Plessy C, Carninci P, and Gingeras TR (2013). High-fidelity promoter profiling reveals widespread alternative promoter usage and transposon-driven developmental gene expression. Genome Res. 23, 169–180. - PMC - PubMed
    1. Beck CR, Garcia-Perez JL, Badge RM, and Moran JV (2011). LINE-1 Elements in Structural Variation and Disease. Annu. Rev. Genomics Hum. Genet 12, 187–215. - PMC - PubMed

Publication types

MeSH terms