. 2021 Nov 9;54(11):2531-2546.e5.
doi: 10.1016/j.immuni.2021.09.010. Epub 2021 Oct 12.

IL-33-induced metabolic reprogramming controls the differentiation of alternatively activated macrophages and the resolution of inflammation

Affiliations

IL-33-induced metabolic reprogramming controls the differentiation of alternatively activated macrophages and the resolution of inflammation

Maria Faas et al. Immunity. .

Abstract

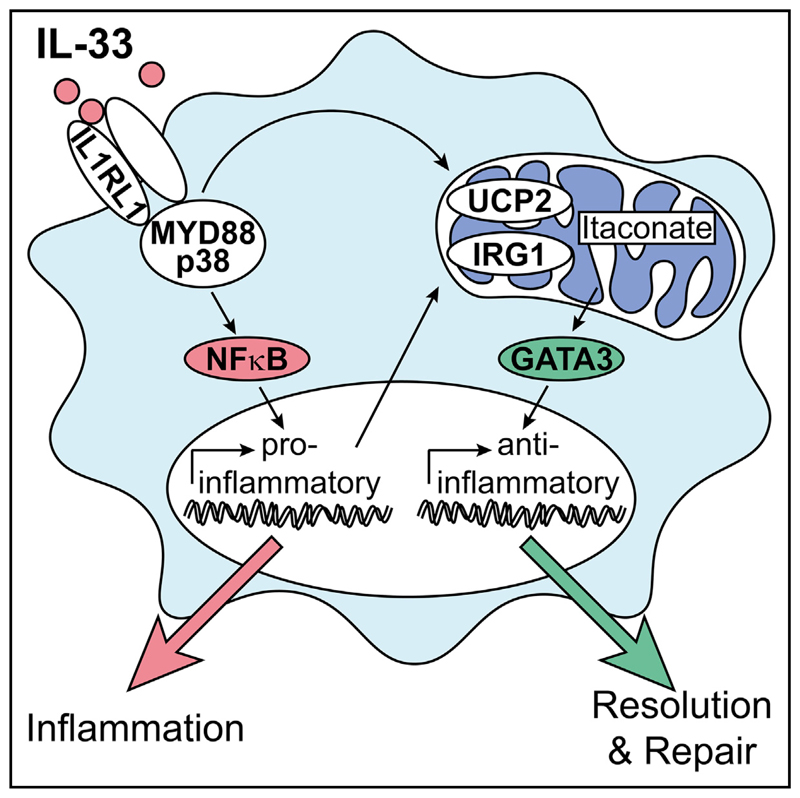
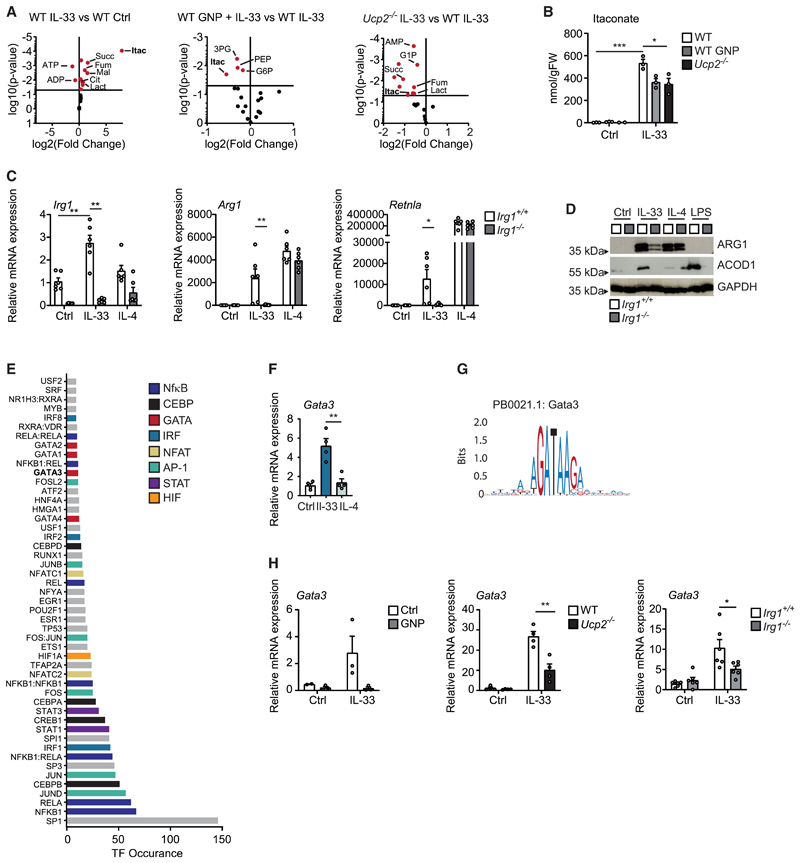
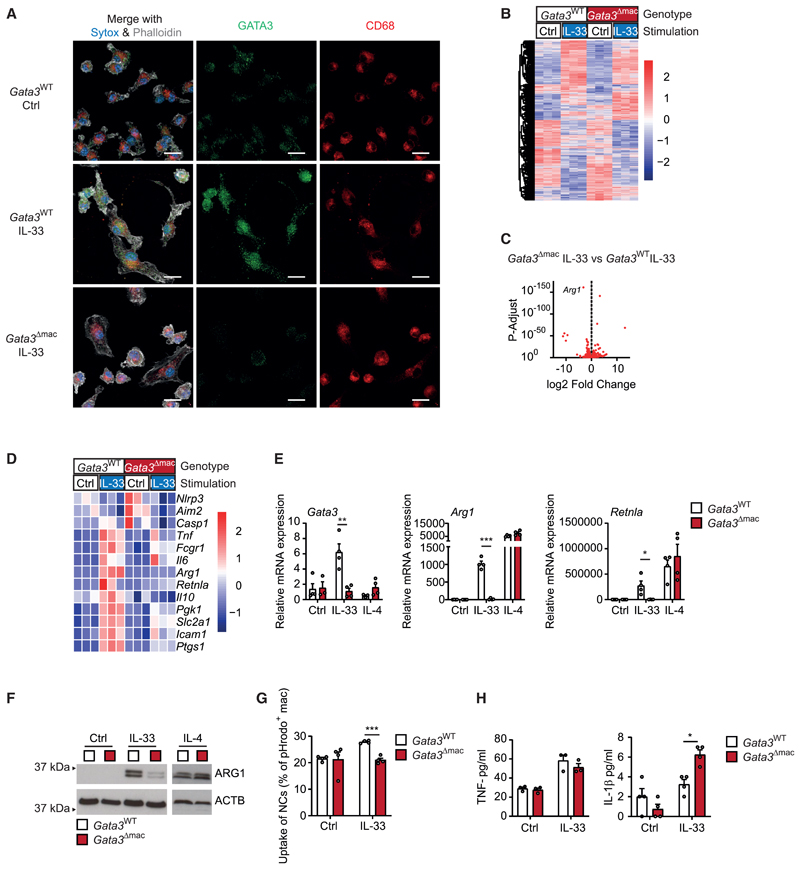
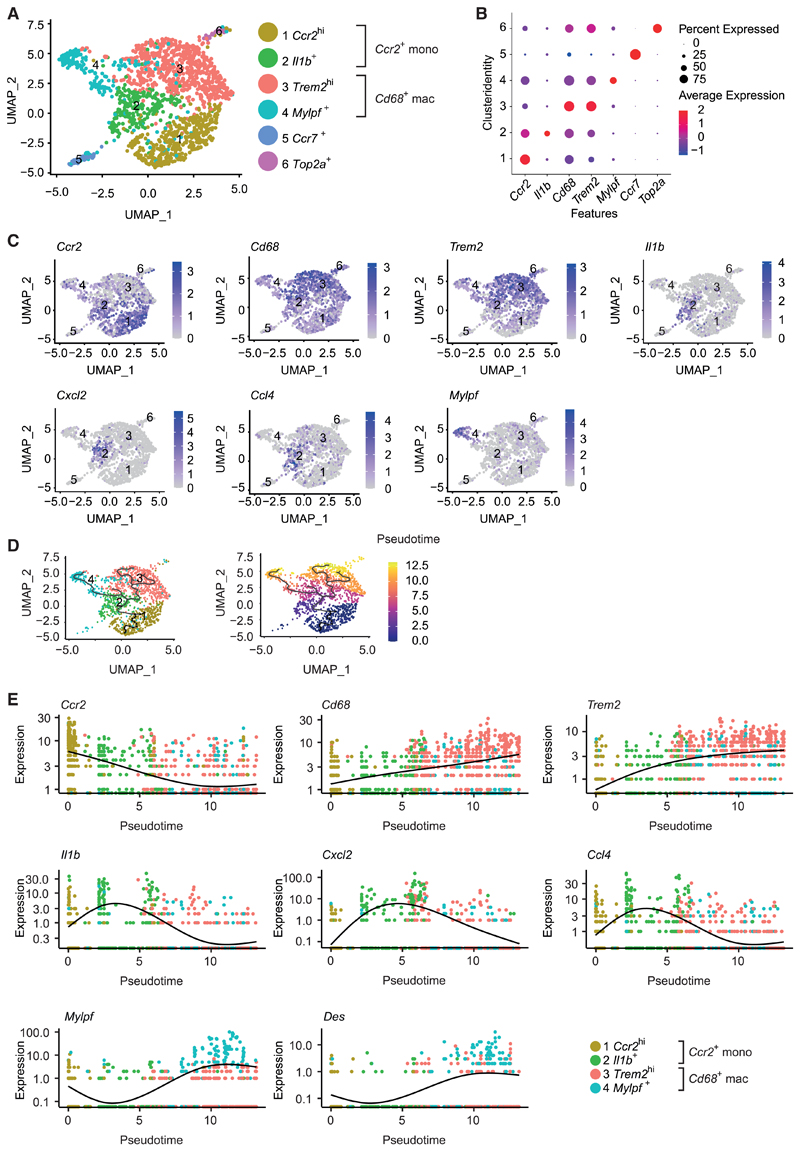
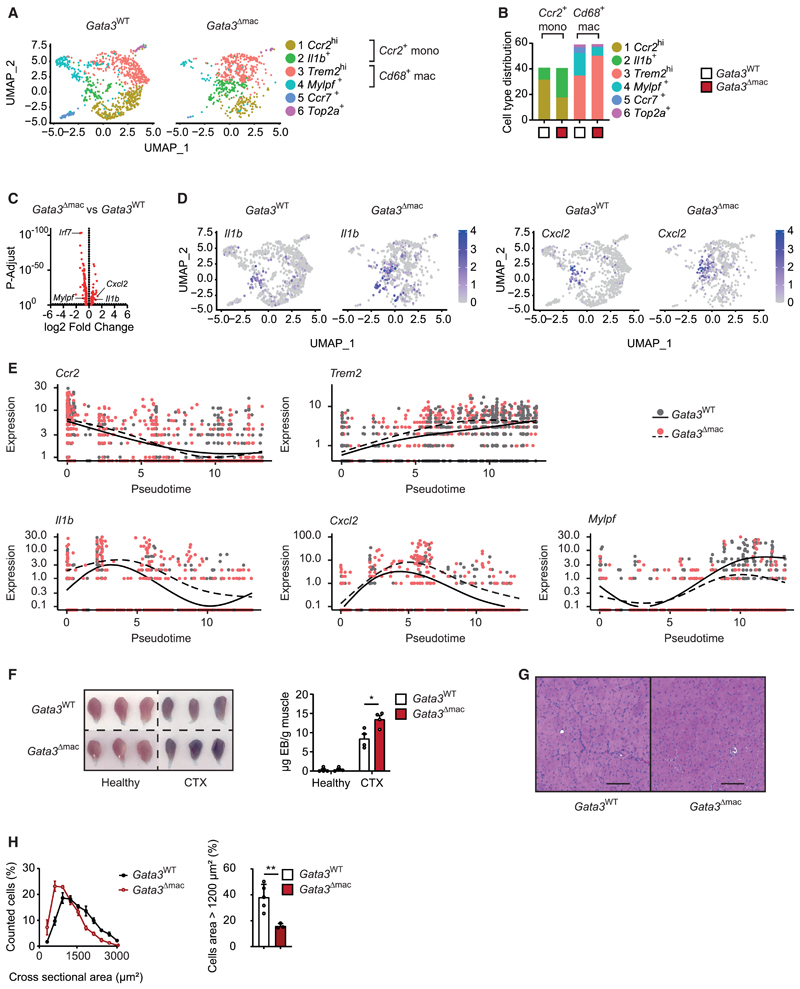
Alternatively activated macrophages (AAMs) contribute to the resolution of inflammation and tissue repair. However, molecular pathways that govern their differentiation have remained incompletely understood. Here, we show that uncoupling protein-2-mediated mitochondrial reprogramming and the transcription factor GATA3 specifically controlled the differentiation of pro-resolving AAMs in response to the alarmin IL-33. In macrophages, IL-33 sequentially triggered early expression of pro-inflammatory genes and subsequent differentiation into AAMs. Global analysis of underlying signaling events revealed that IL-33 induced a rapid metabolic rewiring of macrophages that involved uncoupling of the respiratory chain and increased production of the metabolite itaconate, which subsequently triggered a GATA3-mediated AAM polarization. Conditional deletion of GATA3 in mononuclear phagocytes accordingly abrogated IL-33-induced differentiation of AAMs and tissue repair upon muscle injury. Our data thus identify an IL-4-independent and GATA3-dependent pathway in mononuclear phagocytes that results from mitochondrial rewiring and controls macrophage plasticity and the resolution of inflammation.

Keywords: GATA3; UCP2; alternatively activated macrophage; interleukin-33; itaconate; mitochondrial rewiring; resolution of inlammation; uncoupling.


Conflict of interest statement

Declaration of interests The authors declare no competing interests

Figures

Graphical abstract
Graphical abstract
Figure 1
Figure 1. IL-33 promotes the resolution of injury-induced inflammation and the differentiation of AAMs
(A) Determination of Evans blue accumulation in healthy and CTX-injected muscles of WT (n = 7) and Il1rl1−/− (n = 7) mice on day 7 after injury. (B and C) Example H&E staining (B) and quantification and comparison of cross-sectional areas from muscle sections (C) of CTX-injected WT (n = 3) and Il1rl1−/− (n = 3) muscles on day 14 after injury. Scale bar indicates 100 μm. (D–F) Bulk mRNA sequencing data of WT and Il1rl1−/− BMDMs that were treated with vehicle (Ctrl) or with IL-33 (10 ng/mL for 36 h). Data are presented as a heatmap illustrating differential gene expression (D), a volcano plot in which each dot represents a gene with a adjusted p < 0.05 (E), and a heatmap of genes encoding for alternative and classic macrophage activation markers (Z scores) (F). (G–I) Quantitative real-time PCR (G), western blot (H), and ELISA (I) showing mRNA and protein expression of indicated markers of alternative activation (Arg1, Retnla, Chil3, ARG1) and classic activation (TNF) in BMDMs of WT and Il1rl1−/− BMDMs upon stimulation with vehicle (Ctrl) or IL-33 (10 ng/mL for 5 days) and IL-4 (20 ng/mL for 24 h). Data are representative of three individual experiments. (J) Uptake of necrotic C2C12 cells (NC) after 1 h (CFSE-labeled) or 2 h (pHrodo-labeled) of phagocytosis. Data are representative of three individual experiments. (K) Arg1 mRNA expression in response to IL-33 (10 ng/mL), IL-1β (10 ng/mL), or IL-18 (10 ng/mL) after 5 days of stimulation. Data are presented as mean + SEM. *p < 0.05, **p < 0.01, and ***p < 0.001. See also Figures S1 and S2 and Video S1.
Figure 2
Figure 2. IL-33 triggers the IL-4-independent differentiation of AAMs
(A–D) Bulk mRNA sequencing data comparing BMDMs stimulated with vehicle (Ctrl), IL-33 (10 ng/mL for 36 h), and IL-4 (20 ng/mL for 36 h). Data are presented as a heatmap illustrating differential gene expression (A), PCA plot (B), volcano plot (C), and heatmap of genes for alternative and classic macrophage activation derived from bulk sequencing data in the different conditions (D). (E–I) Quantitative real-time PCR (E and G), immunoblot (F and H), and ELISA (I) showing mRNA and protein expression of indicated markers of alternative activation (Arg1, Retnla, Chil3, ARG1) and classic activation (TNF) in BMDMs of Il4raWT and Il4raΔmac (E and F) or Myd88+/− and Myd88−/− (G–I) upon stimulation with vehicle (Ctrl) or IL-33 (10 ng/mL for 5 days) or IL-4 (20 ng/mL for 24 h). Data are representative of two individual experiments. Not detected (n.d.). Data are presented as mean + SEM. *p < 0.05, **p < 0.01, and ***p < 0.001.
Figure 3
Figure 3. IL-33-induced mitochondrial rewiring promotes AAM differentiation
(A) KEGG (Kyoto Encyclopedia of Genes and Genomes) enrichment analysis of bulk mRNA sequencing data comparing IL-33 (10 ng/mL for 36 h) and IL 4 (20 ng/mL for 36 h) treated BMDMs. (B) Extracellular acidification rate (ECAR) of glycolysis stress test (extracellular flux assay) of BMDMs either vehicle treated (Ctrl) or treated with IL-33 (10 ng/mL for 6 h). (C) Oxygen consumption rate (OCR) of Mito Stress Test (extracellular flux assay) of BMDMs either vehicle treated (Ctrl) or treated with IL-33 (10 ng/mL for 6 h). Data are representative of three individual experiments. (D) OCR of BMDMs treated with IL-33 (10 ng/mL for 6 h), IL-4 (20 ng/mL for 6 h), or LPS (10 ng/mL for 6 h). (E) Proton leak calculated from Mito Stress Test (extracellular flux assay) of BMDMs either vehicle treated (Ctrl) or treated with IL-33 (10 ng/mL for 6 h), IL-4 (20 ng/ mL for 6 h), or LPS (10 ng/mL for 6 h). (F) Proton leak calculated from Mito Stress Test (extracellular flux assay) of WT or Il1rl1−/− BMDMs either vehicle treated (Ctrl) or treated with IL-33 (10 ng/mL for 6 h). (G) Western blot of UCP2 protein from mitochondrial fractions of WT or Il1rl1−/− BMDMs treated with IL 33 (10 ng/mL) for the indicated time points. Data are representative of three individual experiments. (H) Oxygen consumption rate (OCR) of Mito Stress Test (extracellular flux assay) of BMDMs vehicle treated (Ctrl) or treated with IL-33 (10 ng/mL for 24 h) and/or GNP (100 μM for 24 h). Proton leak and basal respiratory capacity calculated from Mito Stress Test. (I and J) Quantitative real-time PCR (I) and western blot (J) showing mRNA and protein expression of indicated markers of alternative activation (Arg1, Retnla, Chil3, ARG1) in BMDMs treated with IL-33 (10 ng/mL for 5 days), IL-4 (20 ng/mL for 5 days), genipin (GNP; 100 μM for 5 days), and/or DNP (50 μM for 5 days). Data are representative of three individual experiments. (K–M) Quantitative real-time PCR (K), western blot (L), and ELISA (M) showing mRNA and protein expression of indicated markers of alternative activation (Arg1, Retnla, Chil3, ARG1), Ucp2, and TNF in WT and Ucp2−/− BMDMs upon stimulation with vehicle (Ctrl) or IL-33 (10 ng/mL for 5 days). Data are representative of three individual experiments. Data are presented as mean + SEM. *p < 0.05, **p < 0.01, and ***p < 0.001. See also Figure S3.
Figure 4
Figure 4. IL-33-mediated mitochondrial uncoupling results in the induction of the transcription factor GATA3
(A) Volcano plots illustrating the results of targeted metabolomics profiling comparing (left) IL-33 (10 ng/mL) treated and untreated (Ctrl) BMDMs 24 h after stimulation, (middle) IL-33 (10 ng/mL) treated BMDMs in the presence of GNP (100 μM) or vehicle 24 h after stimulation, and (right) IL-33 (10 ng/mL) treated Ucp2−/− BMDMs and WT BMDMs 24 h after stimulation. (B) Itaconate concentration in nmol/g fresh weight (FW) in untreated (Ctrl) IL-33 (10 ng/mL) and/or GNP (100 μM) treated BMDMs of WT and/or BMDMs of Ucp2−/− mice. (C and D) Quantitative real-time PCR (C) and western blot (D) showing mRNA and protein expression of indicated markers of alternative activation (Arg1, Retnla, Chil3, ARG1) and ACOD1 in BMDMs treated with vehicle (Ctrl), IL-33 (10 ng/mL for 5 days), or IL-4 (20 ng/mL for 24 h) in BMDMs of Irg1+/+ and/or Irg1−/− mice. Data are representative of two individual experiments. (E) Transcription factor (TF) prediction for genes differentially expressed between IL-33- and IL-4-treated macrophages and significantly upregulated by IL-33. Bars are color coded according to indicated TF families. (F) Relative Gata3 mRNA expression in BMDMs treated with vehicle (Ctrl) or IL-33 (10 ng/mL for 5 days) or IL-4 (20 ng/mL for 24 h). Data are representative of three individual experiments. (G) JASPAR binding motif of GATA3. (H) Relative Gata3 mRNA expression in BMDMs from WT, Ucp2−/−, or Irg1−/− mice treated with vehicle or IL-33 (10 ng/mL for 5 days) in the presence and absence of GNP (100 μM for 5 days) as indicated. Data are representative of two individual experiments. Data are presented as mean + SEM. *p < 0.05, **p < 0.01, and ***p < 0.001. See also Figure S4.
Figure 5
Figure 5. GATA3 controls the IL-33-induced polarization of AAMs
(A) Immunofluorescence microscopy of GATA3 protein in BMDMs upon stimulation with vehicle (Ctrl) or IL-33 (10 ng/mL for 5 days); GATA3 depicted in green, CD68 in red, Phalloidin in white, and Sytox blue in blue. Data are representative of two individual experiments. Scale bar indicates 10 μm. (B–D) Bulk mRNA sequencing data of BMDMs isolated from Gata3WT or Gata3Δmac mice upon stimulation with vehicle (Ctrl) or IL-33 (10 ng/mL for 36 h). Data are presented as heatmap (B) and volcano plot (C) of differential gene expression as well as heatmap of gene expression of alternative and classic macrophage activation markers and of genes involved in inflammasome activation (D). (E–H) Quantitative real-time PCR-based measurement of mRNA expression of indicated genes (E), (F) immunoblot-based determination of ARG1 expression, (G) uptake of pHrodo-stained necrotic cells after 2 h of phagocytosis, and (H) ELISA-based measurement of TNF and IL-1β secretion in BMDMs isolated from Gata3WT or Gata3Δmac mice upon stimulation with vehicle (Ctrl), IL-33 (10 ng/mL for 5 days), or IL-4 (20 ng/mL for 24 h). Data (E–G) and TNF ELISA (H) are representative of three individual experiments. Data are presented as mean + SEM. *p < 0.05, **p < 0.01, and ***p < 0.001. See also Figure S5 and Table S1.
Figure 6
Figure 6. Muscle injury results in the differentiation of pro-resolving macrophages
(A–E) Data derived from single-cell mRNA sequencing (scRNA-seq) from Zombie AquaCD45+CD11B+LY6G mononuclear phagocytes from the injured muscle on day 4 after CTX injection of Gata3WT (n = 1) and Gata3Δmac (n = 1) mice. (A) Uniform manifold approximation and projection (UMAP) visualization of scRNA-seq cells of Gata3WT and Gata3Δmac origin that were clustered together. Each point represents an individual cell that is colored by cluster identity. (B) Dot-plot visualization of cluster markers Ccr2, Il1b, Cd68, Trem2, Mylpf, Ccr7, and Top2a. (C) UMAP visualization of cluster markers Ccr2, Cd68, Trem2, Il1b, Cxcl2, Ccl4, and Mylpf. (D) Pseudotime trajectory analysis determining the developmental relationship of identified cellular clusters (left) or as function of pseudotime (right) on the basis of scRNA-seq data. (E) Gene expression changes of selected marker genes as a function of pseudotime reflecting the cellular differentiation of Ccr2hi monocytes into Cd68+ macrophages. See also Figure S6.
Figure 7
Figure 7. GATA3 controls the differentiation of pro-resolving macrophages upon muscle injury
(A–E) Data derived from single-cell mRNA sequencing (scRNA-seq) from Zombie AquaCD45+CD11B+LY6G mononuclear phagocytes from the injured muscle on day 4 after CTX injection of Gata3WT (n = 1) and Gata3Δmac (n = 1) mice. (A) Split UMAP visualization of identified clusters and (B) relative cell type distribution per cluster in the respective genotypes. (C) Volcano plot of differentially expressed genes and (D) split UMAP visualization of Il1b and Cxcl2 expression in mononuclear phagocytes from Gata3WT and Gata3Δmac mononuclear phagocytes. (E) Gene expression changes of selected marker genes as a function of pseudotime during the cellular differentiation of Ccr2hi monocytes into Cd68+ macrophages in Gata3WT (solid line) and Gata3Δmac (dashed line) mice. (F) Macroscopic picture and quantification of Evans blue accumulation in healthy and CTX-injected muscles of Gata3WT and Gata3Δmac mice on day 7 after injury. (G and H) Histology (G) and (H) quantification and comparison of cross-sectional areas (CSAs) from muscle sections of CTX-injected Gata3WT and Gata3Δmac mice on day 14 after injury. Scale bar indicates 100 μm. Data are presented as mean + SEM. *p < 0.05, **p < 0.01, and ***p < 0.001. See also Figure S7 and Tables S2 and S3.

References

    1. Allen JE, Sutherland TE. Host protective roles of type 2 immunity: parasite killing and tissue repair, flip sides of the same coin. Semin Immunol. 2014;26:329–340. - PMC - PubMed
    1. Arnold L, Henry A, Poron F, Baba-Amer Y, van Rooijen N, Plonquet A, Gherardi RK, Chazaud B. Inflammatory monocytes recruited after skeletal muscle injury switch into antiinflammatory macrophages to support myogenesis. J Exp Med. 2007;204:1057–1069. doi: 10.1084/jem.20070075. - DOI - PMC - PubMed
    1. Chazaud B. Inflammation and skeletal muscle regeneration: leave it to the macrophages! Trends Immunol. 2020;41:481–492. - PubMed
    1. Coakley G, Harris NL. Interactions between macrophages and helminths. Parasite Immunol. 2020;42:e12717. - PubMed
    1. Cochain C, Vafadarnejad E, Arampatzi P, Pelisek J, Winkels H, Ley K, Wolf D, Saliba AE, Zernecke A. Single-cell RNA-seq reveals the transcriptional landscape and heterogeneity of aortic macrophages in murine atherosclerosis. Circ Res. 2018;122:1661–1674. - PubMed

Publication types