. 2021 Dec 1;109(23):3758-3774.e11.
doi: 10.1016/j.neuron.2021.09.031. Epub 2021 Oct 12.

TRIP12 ubiquitination of glucocerebrosidase contributes to neurodegeneration in Parkinson's disease

Affiliations

TRIP12 ubiquitination of glucocerebrosidase contributes to neurodegeneration in Parkinson's disease

Bo Am Seo et al. Neuron. .

Abstract

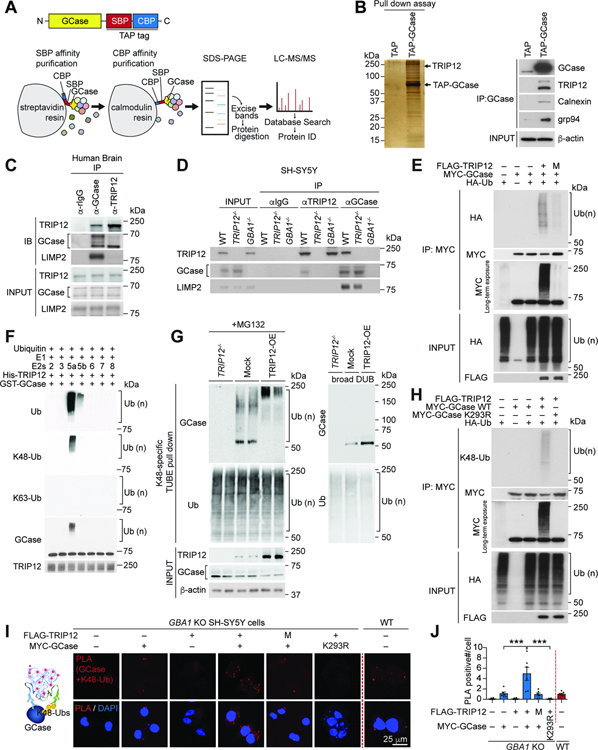
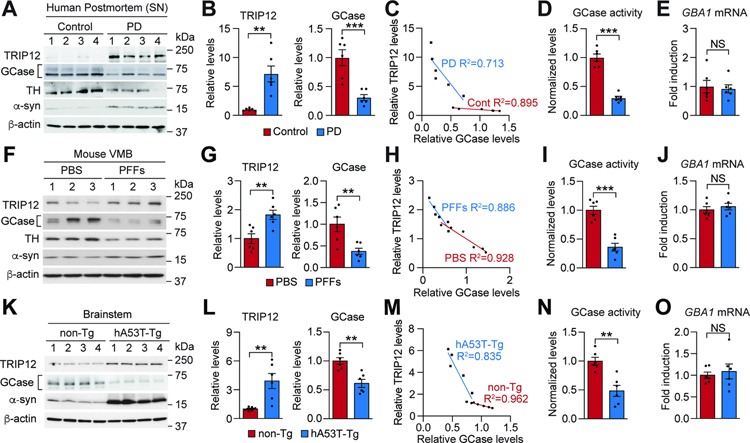
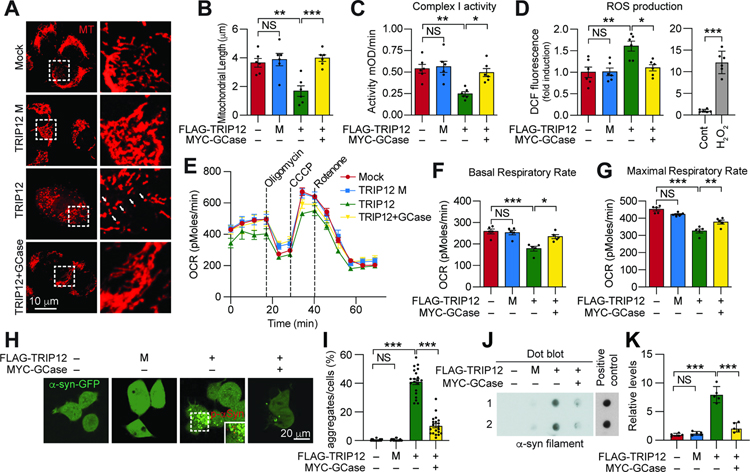
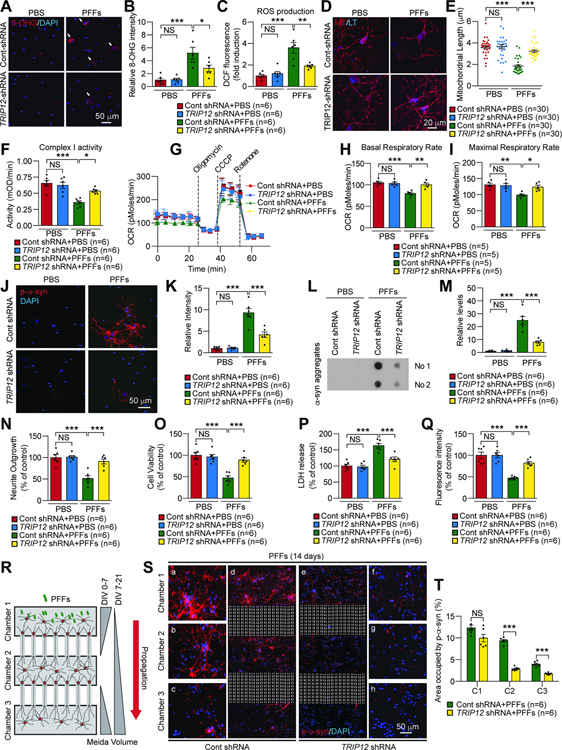
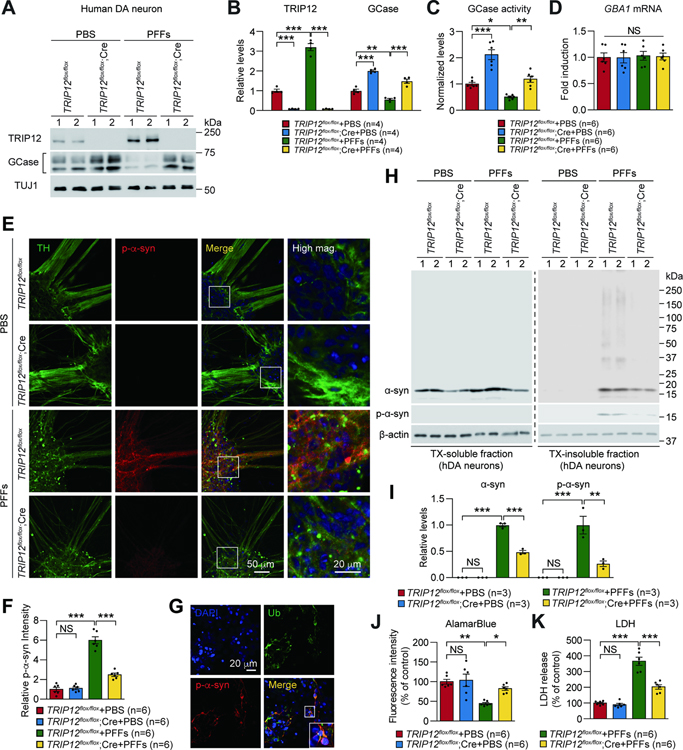
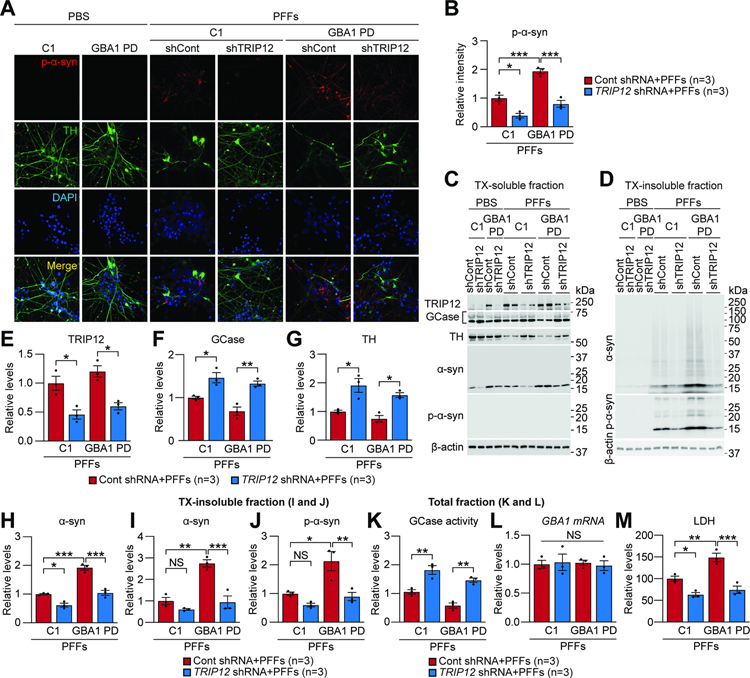
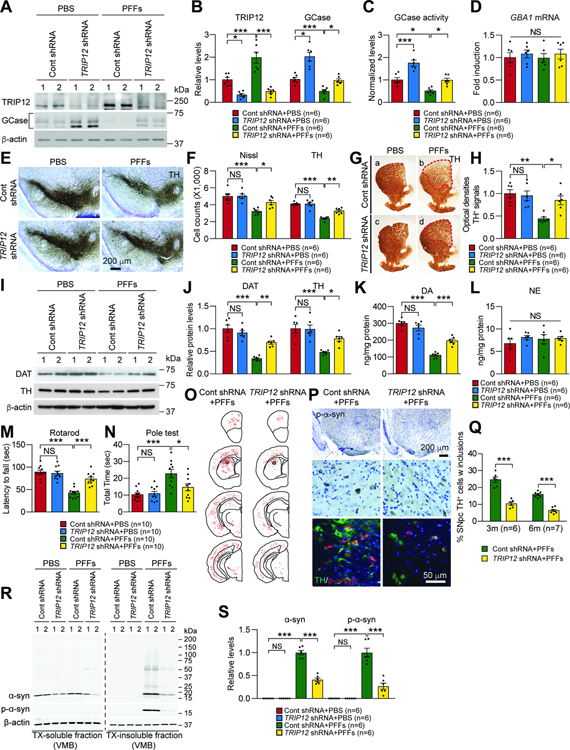
Impairment in glucocerebrosidase (GCase) is strongly associated with the development of Parkinson's disease (PD), yet the regulators responsible for its impairment remain elusive. In this paper, we identify the E3 ligase Thyroid Hormone Receptor Interacting Protein 12 (TRIP12) as a key regulator of GCase. TRIP12 interacts with and ubiquitinates GCase at lysine 293 to control its degradation via ubiquitin proteasomal degradation. Ubiquitinated GCase by TRIP12 leads to its functional impairment through premature degradation and subsequent accumulation of α-synuclein. TRIP12 overexpression causes mitochondrial dysfunction, which is ameliorated by GCase overexpression. Further, conditional TRIP12 knockout in vitro and knockdown in vivo promotes the expression of GCase, which blocks α-synuclein preformed fibrils (α-syn PFFs)-provoked dopaminergic neurodegeneration. Moreover, TRIP12 accumulates in human PD brain and α-synuclein-based mouse models. The identification of TRIP12 as a regulator of GCase provides a new perspective on the molecular mechanisms underlying dysfunctional GCase-driven neurodegeneration in PD.

Keywords: Gaucher’s disease (GD); Parkinson’s disease (PD); Thyroid Hormone Receptor Interacting Protein 12 (TRIP12); glucocerebrosidase (GCase); glucocerebrosidase 1 gene (GBA1); glucosylceramide (GlcCer); lysosome; mitochondria; α-synuclein; α-synuclein preformed fibrils (α-syn PFFs).


Conflict of interest statement

Declaration of interests The authors declare no competing interests.

Figures

Figure 1
Figure 1. TRIP12 Interacts with GCase and Ubiquitinates Its K293 Residue via K48-specific Ubiquitin Linkage
(A) Schematic representation of tandem affinity purification of the (TAP)-GCase construct with C-terminal streptavidin-binding peptide (SBP) and calmodulin-binding peptide (CBP) tags. (B) Silver-stained SDS-PAGE gel (left). Binding between GCase and its interacting proteins calnexin, grp94, and TRIP12 by immunoblot (right). (C) Co-immunoprecipitation (co-IP) of endogenous TRIP12, GCase, and LIMP2 and their mutual interactions in human brain samples. (D) TRIP12, GCase, and LIMP2 co-immunoprecipitate from wt SH-SY5Y cells, but not from CRISPR/Cas9 induced TRIP12-knockout (TRIP12−/−) or GBA1-knockout SH-SY5Y cells (GBA1−/−). (E) FLAG-TRIP12 wt but not its catalytic domain mutant (M; FLAG-TRIP12 C1959A) ubiquitinates MYC-GCase in in vivo ubiquitination assay. (F) In vitro ubiquitination assay with GST-GCase, E1, E2s Ubch2 (2), UbcH3 (3), UbcH5a (5a), UbcH5b (5b), UbcH6 (6), UbcH7 (7), UbcH8 (8), and His-TRIP12. (G) Representative western blot shows K48 ubiquitin-linked endogenous GCase enriched by K48-specific TUBE pulldown in SH-SY5Y cells with Mock, TRIP12 overexpression (TRIP12-OE), and TRIP12−/− in the presence of MG132 (left panel). K48-specific ubiquitin-enriched fractions incubated with a DUB (right panel). (H) In vivo ubiquitination assay shows TRIP12 polyubiquitinates MYC-GCase wt through K48-specific ubiquitination, but not K293R mutant GCase. (I and J) PLA assay for protein interactions between TRIP12 wt or TRIP12 catalytic domain mutant (M) and GCase WT or GCase K293R mutant in GBA1−/− transfected with the indicated constructs. (I) The PLA-positive signals in each cell were measured and (J) shown in a bar graph (n=6, each group). Data are presented as mean ± SEM (***P < 0.001). See also Figures S1–S3 and Tables S1 and S2.
Figure 2
Figure 2. TRIP12 Accumulates in Sporadic PD Patients and in PD Mouse Models
(A) Western blot analysis of TRIP12, GCase, TH, and α-syn protein levels in the SNpc of human PD postmortem brain. (B) Data in A shown as bar graphs (n=6, each group). (C) Correlation between TRIP12 and GCase expression (n=6, each group). (D) GCase activity was measured by inactivating GBA2 protein with CBE treatment in PD postmortem brain and represented in a bar graph (n=6, each group). (E) GBA1 mRNA levels (n=6, each group). (F) Western blot analysis of TRIP12, GCase, TH, and α-syn from the VMB of α-syn PFFs-injected mice at 6-months post-injection. (G) Data in F shown as bar graphs (n=6, each group). (H) Correlation between TRIP12 and GCase expression (n=6, each group). (I and J) GCase activity and GBA1 mRNA levels (n=6, each group). (K) Western blot analysis of TRIP12, GCase, and α-syn from the brainstem region of 9 to 10-month-old human A53T α-syn transgenic mice (hA53T-Tg) or age-matched nontransgenic mice (non-Tg). (L) Data in K shown as bar graphs (n=6, each group). (M) Correlation between TRIP12 and GCase expression (n=6, each group). (N and O) GCase activity and GBA1 mRNA levels. Data are presented as mean ± SEM (NS; not significant, *P < 0.05, **P < 0.01, ***P < 0.001). See also Figure S4 and Table S3.
Figure 3
Figure 3. TRIP12 Induces Mitochondrial Abnormalities and Affects the Formation of α-syn Aggregates by reducing GCase level
(A) SH-SY5Y cells were transfected with FLAG-TRIP12 wt, TRIP12 catalytic domain mutant (M), or both FLAG-TRIP12 wt and MYC-GCase wt. Cells were stained with Mitotracker (MT; Red) (white arrows). (B) The length of mitochondria (n=6, each group). (C) Mitochondrial complex I activity (n=6, each group). (D) Mitochondrial ROS production (left, n=6, each group). H2O2 was used as a positive control for ROS measurement (right) (E) Microplate-based respirometry readings for SH-SY5Y cells transfected with indicated constructs, measured by the XF24 Seahorse analyzer. (F and G) Quantitation of the basal and maximal respiratory rates from the respirometry results (n=5, each group). (H) Representative confocal images of α-syn aggregate formation in GFP-α-syn-expressing SH-SY5Y cells. (I) Data in H shown as bar graphs (n=30, each group). (J) Dot-blot with an α-synuclein fibrils specific antibody. α-syn preformed fibrils (α-syn PFFs) were used as a positive control. (K) Data in J shown as bar graph (n=5, each group). Data are presented as mean ± SEM (NS; not significant, *P < 0.05, **P < 0.01, ***P < 0.001). See also Figure S5.
Figure 4
Figure 4. TRIP12 Knockdown Rescues the Mitochondria Dysfunction and α-synuclein Pathology caused by α-synuclein PFFs in Primary Cortical Neurons
(A) Representative images of 8-OHG immunostaining in primary cortical neurons. Lentiviral control shRNA or TRIP12 shRNA was transduced at DIV5, and α-syn PFFs were treated at DIV7 for two weeks. (B) Quantification of the 8-OHG intensity (n=6, each group). (C) Quantification of ROS production (n=6, each group). (D) Representative Mitotracker-positive micrographs. (E) Alterations in the length of mitochondria (n=30, each group). (F) Mitochondrial complex I activity (n=6, each group). (G) Microplate-based respirometry readings of primary cortical neurons. (H and I) Quantification of the basal and maximal respiratory rates from the respirometry results (n=5, each group). (J) Representative micrographs of p-a-syn aggregates. (K) Quantification of data in J (n=6, each group). (L) Dot-blot analysis with an antibody specific to α-syn fibrils. (M) Quantification of data in L (n=6, each group). (N) Quantification of neurite outgrowth with cell membrane stain (n=6, each group).. (O) Quantification of cell viability with a live-cell indicator (n=6, each group). (P) Quantification of LDH assay (n=6, each group). (Q) Quantification of AlamarBlue assay (n=6, each group). (R) Schematic representation of a microfluidic device for transmission of p-α-syn. Lentiviral control shRNA or TRIP12 shRNA was transduced in chamber 2 primary cortical neuron at DIV5, and α-syn PFFs were treated at DIV7 for two weeks. (S) Representative confocal images showing p-α-syn immunoreactivity. (T) Data in S shown as bar graph (n=6, each group). Data are represented as mean ± SEM (NS; not significant, *P < 0.05, **P < 0.01, ***P < 0.001). See also Figure S5.
Figure 5
Figure 5. TRIP12 Knockout Rescues α-syn PFFs-induced Pathologies in Human Dopaminergic (DA) Neurons
(A) Western blot analysis of TRIP12 and GCase in conditionally floxed TRIP12 hESCs-derived human dopaminergic (DA) neurons transduced with AAV expressing either control (TRIP12flox/flox) or cre recombinase (TRIP12flox/flox;Cre) and treated with PBS or α-syn PFFs. (B) Data in A shown as bar graphs (n=4, each group). (C) GCase activity (n=6, each group). (D) GBA1 mRNA level (n=6, each group). (E) Representative confocal images showing p-α-syn aggregates. (F) Data in E shown as bar graphs (n=6, each group). (G) The p-α-syn positive signals co-localize with ubiquitin. (H) Western blot analysis of α-syn, p-α-syn, and β-actin from TX-soluble and TX-insoluble fractions. (I) Bar graph of the levels of α-syn aggregates and p-α-syn in TX-insoluble fraction (n=3, each group). (J) Quantification of AlamarBlue assay (n=6, each group). (K) LDH assay (n=6, each group). Data are presented as mean ± SEM (NS; not significant, *P < 0.05, **P < 0.01, ***P < 0.001). See also Figure S6.
Figure 6
Figure 6. TRIP12 Knockdown Rescues α-syn PFFs-induced Neurodegeneration in Both Control hiPSC- and GCase N370S PD iPSC-derived DA Neurons
(A-M) Control iPSC (C1) and GBA1-PD hDA neurons (GBA1-PD), respectively, were transduced with the lentivirus expressing either control shRNA or TRIP12 shRNA at three days before α-syn PFFs treatment. (A) Fluorescent analysis was conducted in 5 μg/ml α-syn PFFs-treated hDA neurons for ten days using anti-p-α-syn and TH antibodies. (B) In α-syn PFFs-treated hDA neurons, p-α-syn level was quantitated and shown as bar graphs (n=3, each group). (C-J) hDA neurons were sequentially fractionated in TX-soluble followed by TX-insoluble buffer. (C and D) Western blot analysis of TX-soluble and TX-insoluble fractions using the indicated antibodies. (E-H) Quantitation of the levels of TRIP12, GCase, TH, and α-syn in TX-soluble fraction and shown as bar graphs (n=3, each group). (I and J) Quantitation of α-syn and pS129-α-syn in TX-insoluble fraction (n=3, each group). (K) GCase activity in total fractions (n=3, each group). (L) GBA1 mRNA level in total fractions (n=3, each group). (M) α-syn PFFs-induced cytotoxicity was evaluated using LDH assay in culture media (n=3, each group). All quantitated data shown in bar graphs were conducted in both α-syn PFFs-treated control hiPSC and GBA1-PD hiPSC DA neurons. Data are represented as mean ± SEM (*P < 0.05, **P < 0.01, ***P < 0.001).
Figure 7
Figure 7. TRIP12 Knockdown Protects Against α-synuclein PFFs-induced Neurodegeneration in vivo
(A-S) PBS or α-syn PFFs containing AAV expressing either Control shRNA or TRIP12 shRNA were stereotaxically injected into the striatum of mice. After six months, motor behavioral deficits, levels of TRIP12 and GCase, GCase activity, DA loss, and neuropathology were evaluated. (A) Western blot analysis of TRIP12 and GCase. (B) Levels of TRIP12 and GCase (n=6, each group). (C) GCase activity (n=6, each group). (D) GBA1 mRNA level (n=6, each group). (E and F) The number of TH and Nissl-positive neurons in the SNpc (n=6, each group). (G and H) Striatal TH-immunopositive fiber density (n=6, each group). (I and J) DAT and TH levels in mouse striatum (n=4, each group). (K and L) Striatal dopamine (DA) and noradrenaline (NA) concentrations using HPLC (n=6, each group). (M and N) Behavioral assessments of mice (Rotarod test and Pole test) (n=10, each group). (O) Distribution of p-α-syn accumulation in mouse CNS. (P) Representative images showing α-syn PFFs-induced LB-like inclusion in the SNpc region. (Q) The percentage of TH-positive cells with inclusion (3 months, n=6; 6 months, n=7; each group). (R) Representative immunoblots showing the protein levels of α-syn, p-α-syn, and β-actin from TX-soluble and TX-insoluble fractions in VMB of mice. (S) Bar graph of α-syn aggregates and p-α-syn in TX-insoluble fraction (n=6, each group). Data are presented as mean ± SEM (NS; not significant, *P < 0.05, **P < 0.01, ***P < 0.001). See also Figure S7.

References

    1. Bankers-Fulbright JL, Kephart GM, Bartemes KR, Kita H, and O’Grady SM (2004). Platelet-activating factor stimulates cytoplasmic alkalinization and granule acidification in human eosinophils. J Cell Sci 117, 5749–5757. 10.1242/jcs.01498. - DOI - PubMed
    1. Bendikov-Bar I, and Horowitz M (2012). Gaucher disease paradigm: from ERAD to comorbidity. Hum Mutat 33, 1398–1407. 10.1002/humu.22124. - DOI - PubMed
    1. Bendikov-Bar I, Ron I, Filocamo M, and Horowitz M (2011). Characterization of the ERAD process of the L444P mutant glucocerebrosidase variant. Blood Cells Mol Dis 46, 4–10. 10.1016/j.bcmd.2010.10.012. - DOI - PubMed
    1. Bramswig NC, Ludecke HJ, Pettersson M, Albrecht B, Bernier RA, Cremer K, Eichler EE, Falkenstein D, Gerdts J, Jansen S, et al. (2017). Identification of new TRIP12 variants and detailed clinical evaluation of individuals with non-syndromic intellectual disability with or without autism. Hum Genet 136, 179–192. 10.1007/s00439-016-1743-x. - DOI - PMC - PubMed
    1. Brunet M, Vargas C, Larrieu D, Torrisani J, and Dufresne M (2020). E3 Ubiquitin Ligase TRIP12: Regulation, Structure, and Physiopathological Functions. Int J Mol Sci 21. 10.3390/ijms21228515. - DOI - PMC - PubMed

Publication types