. 2021 Oct 12;54(10):2273-2287.e6.
doi: 10.1016/j.immuni.2021.09.004.

The cholesterol metabolite 25-hydroxycholesterol restrains the transcriptional regulator SREBP2 and limits intestinal IgA plasma cell differentiation

Affiliations

The cholesterol metabolite 25-hydroxycholesterol restrains the transcriptional regulator SREBP2 and limits intestinal IgA plasma cell differentiation

Bruno C Trindade et al. Immunity. .

Abstract

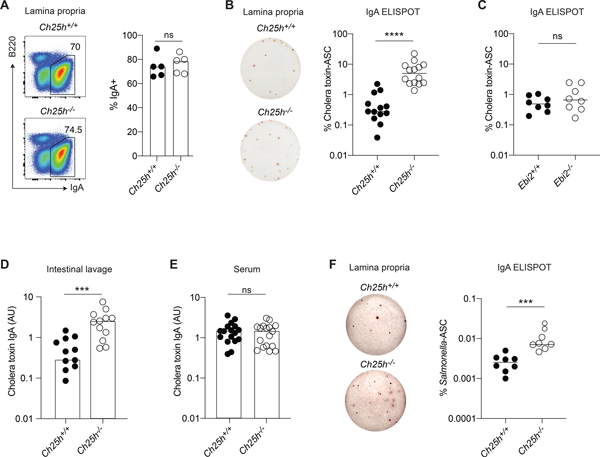
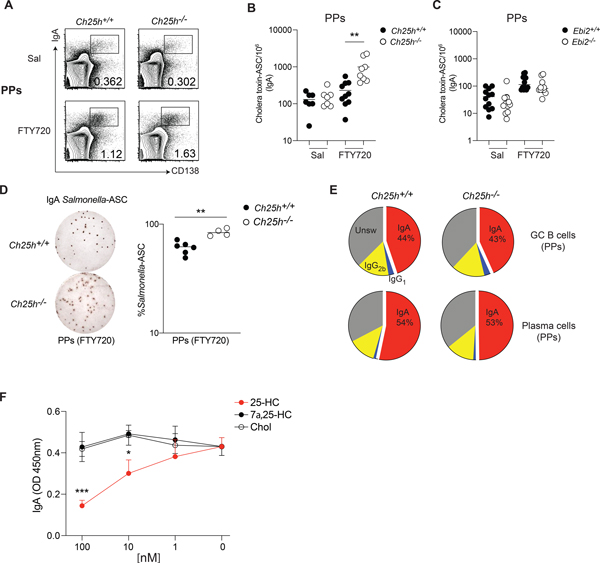
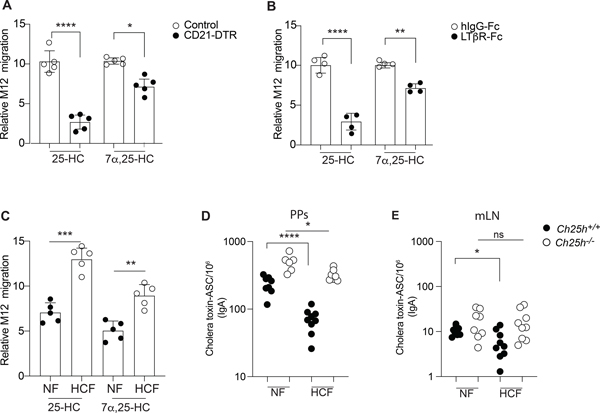
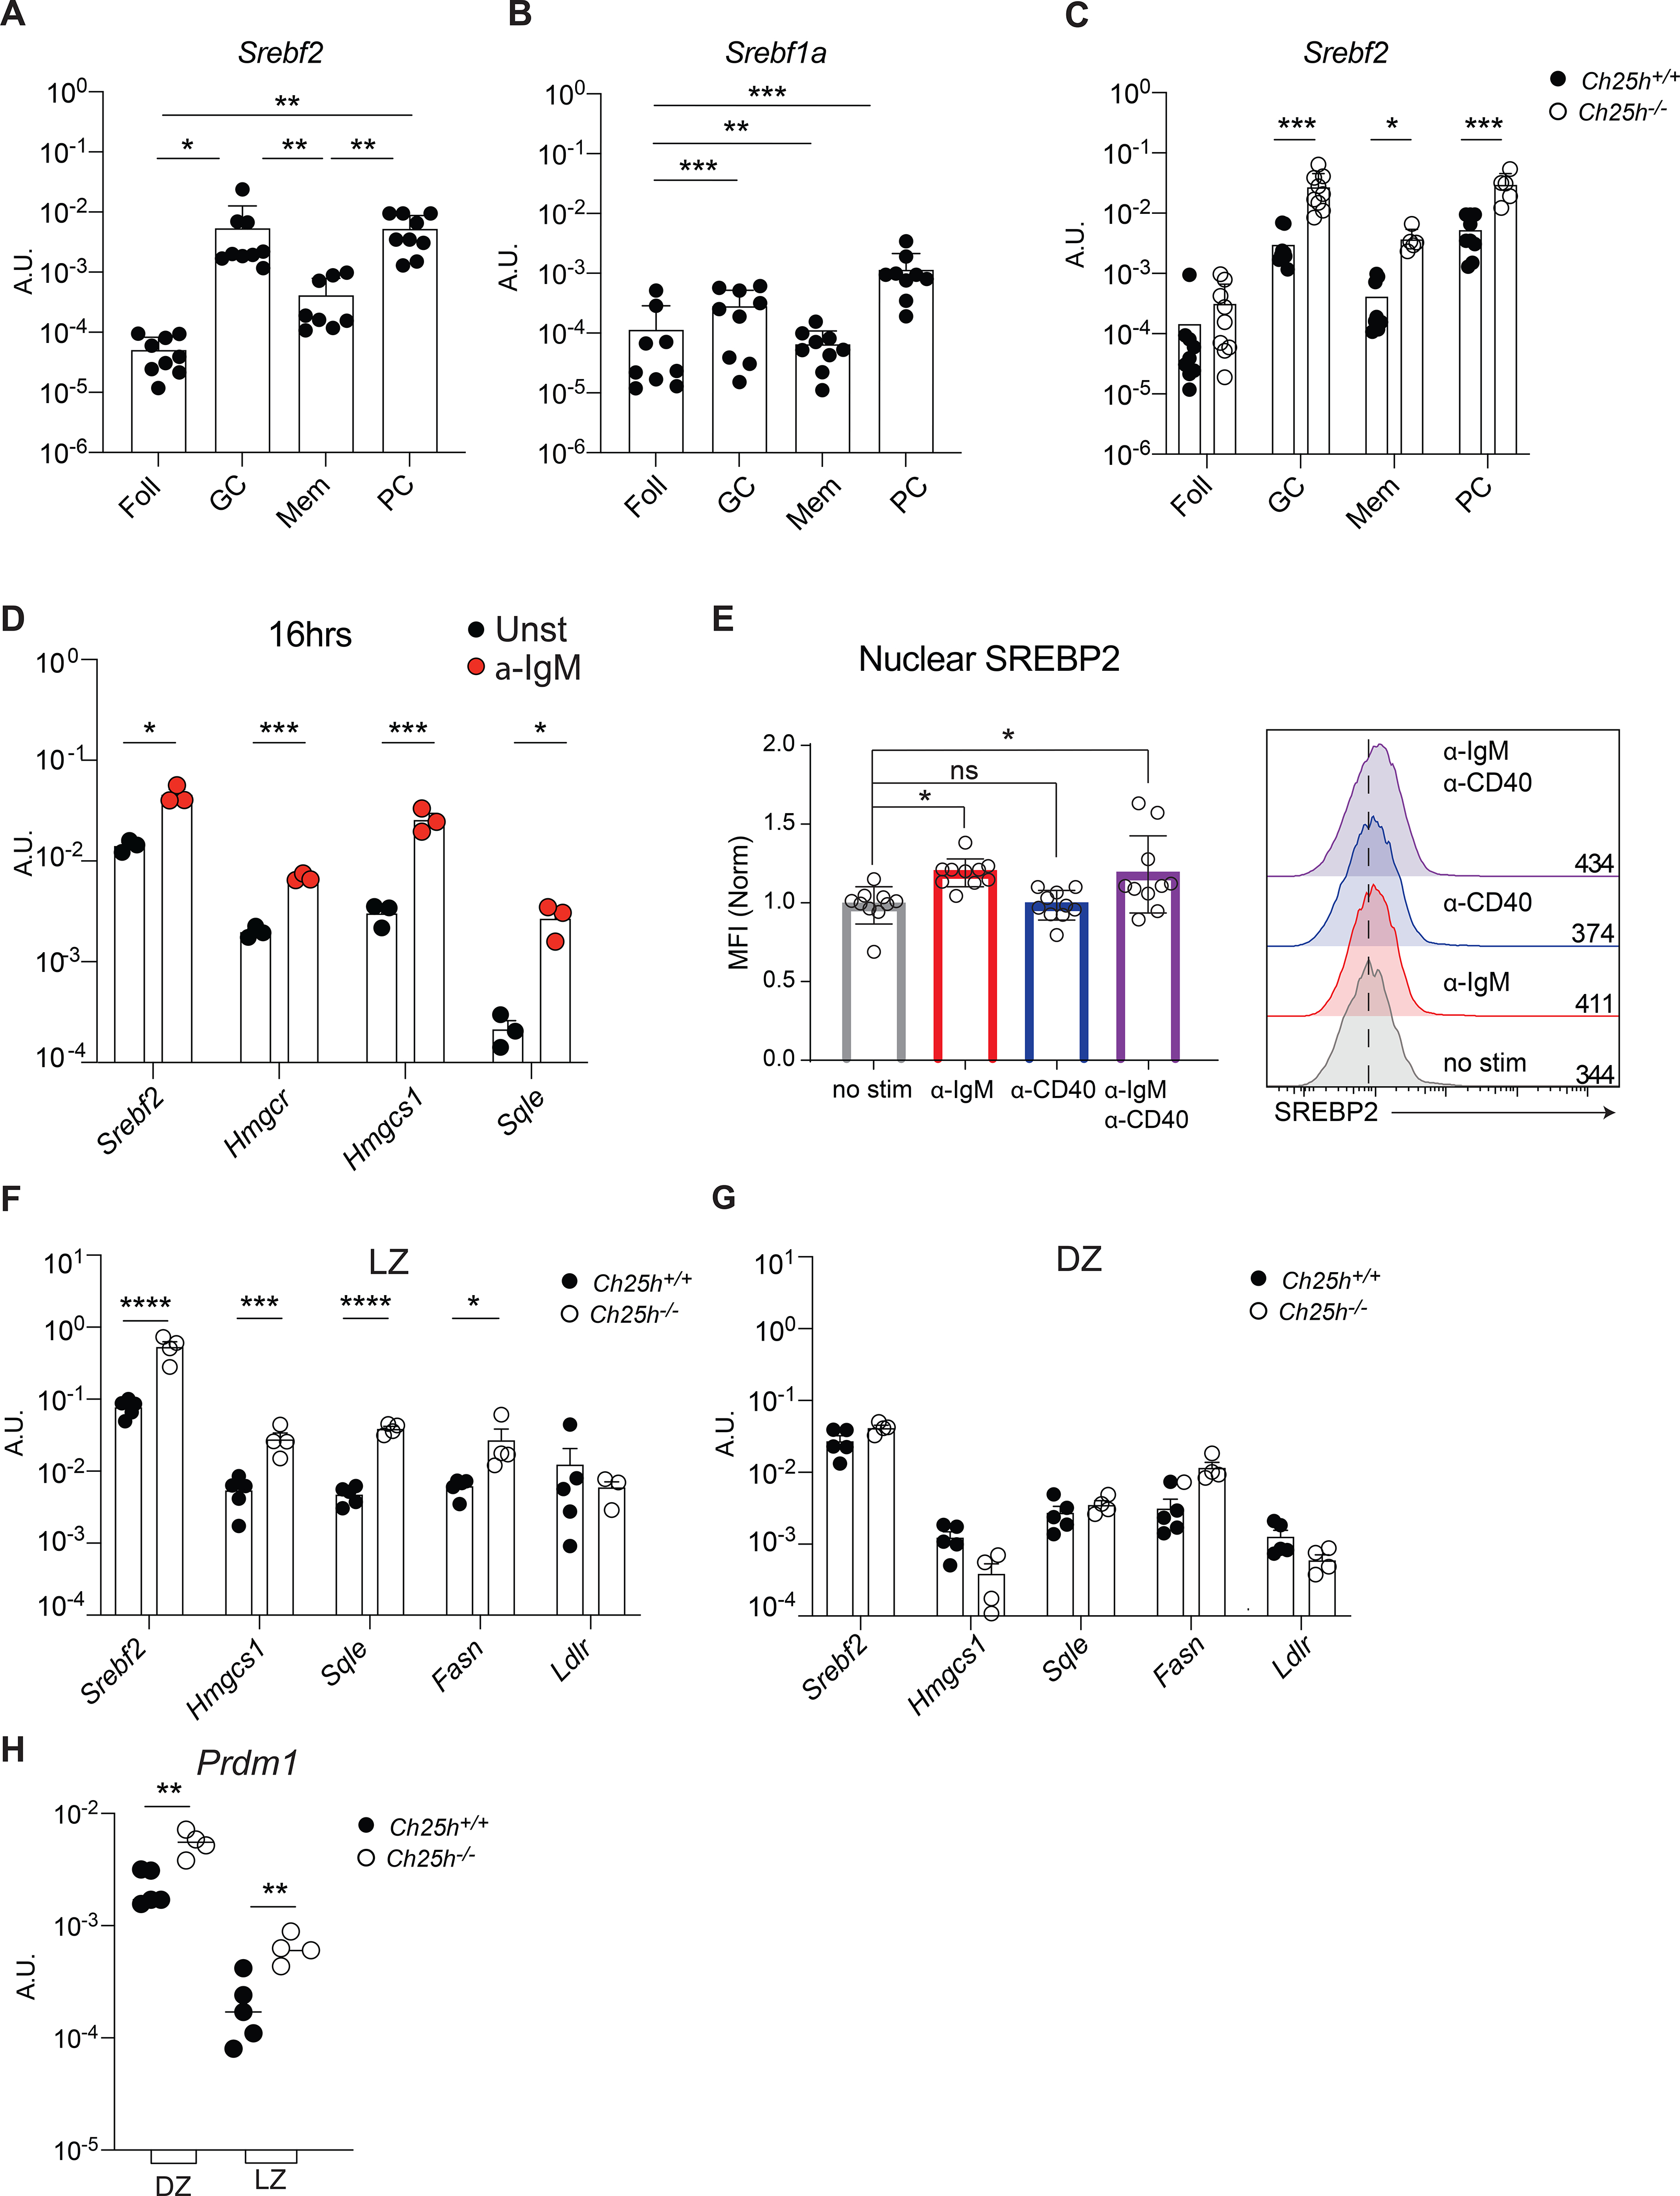
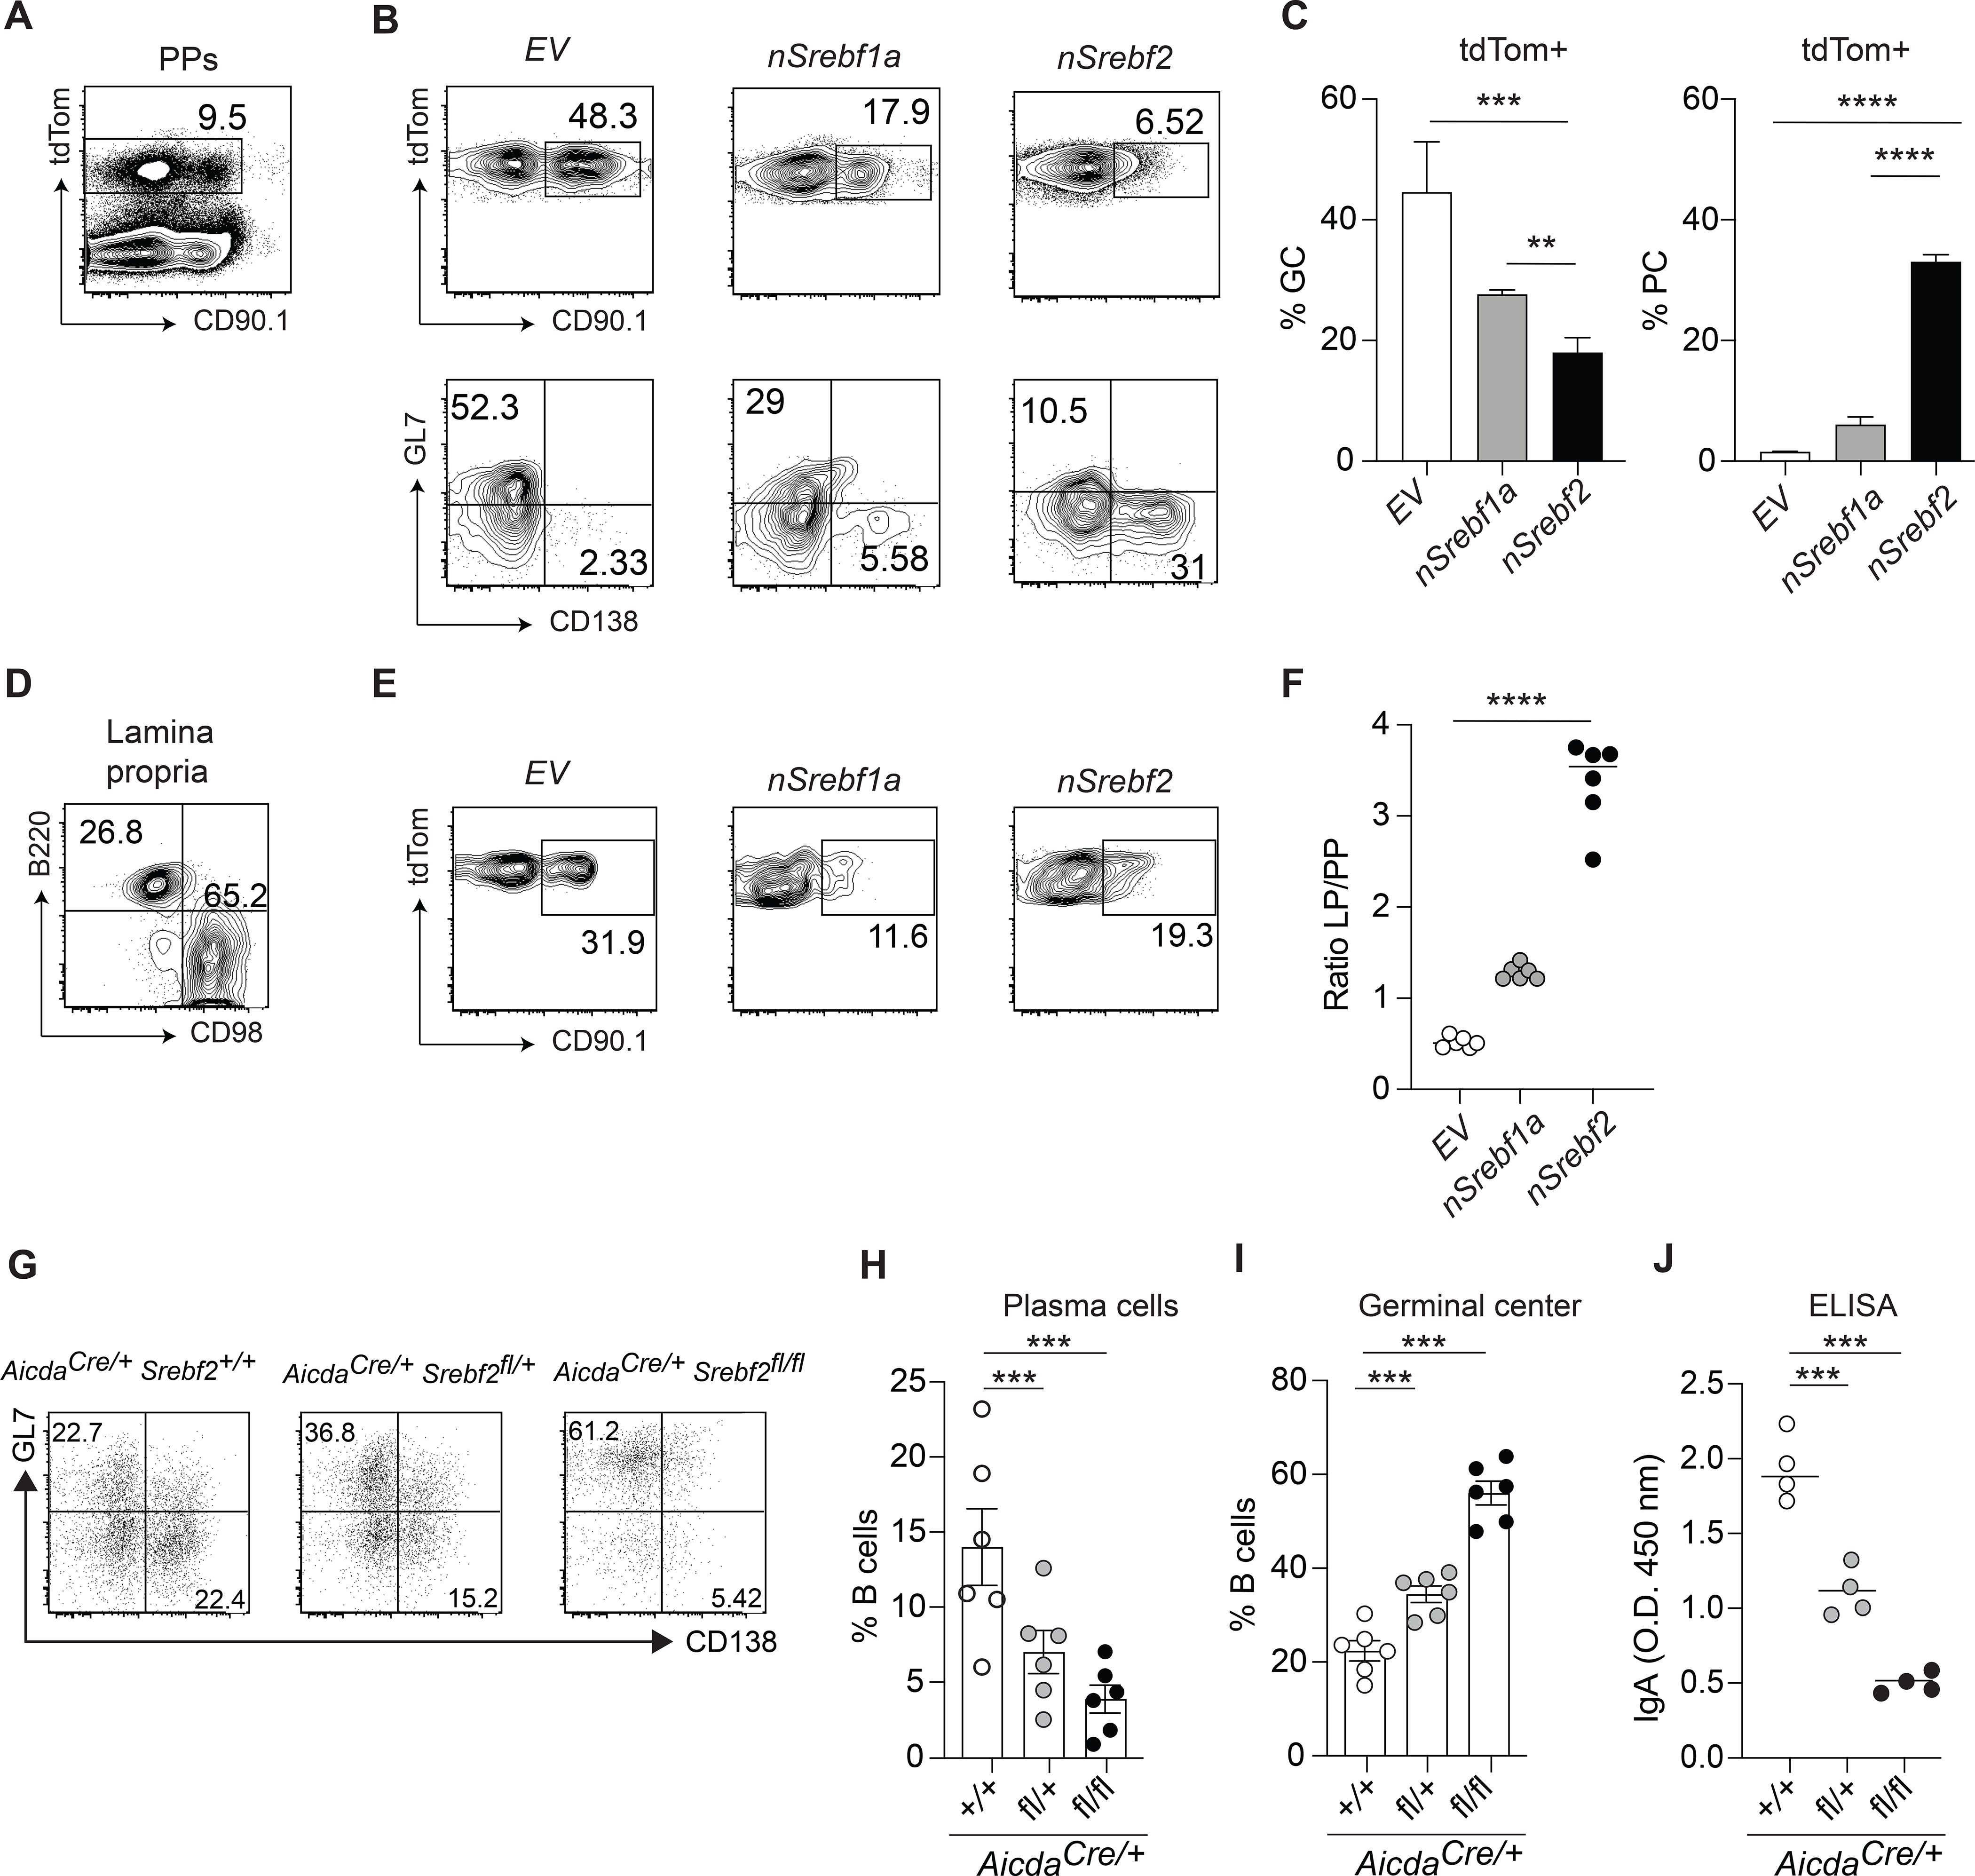
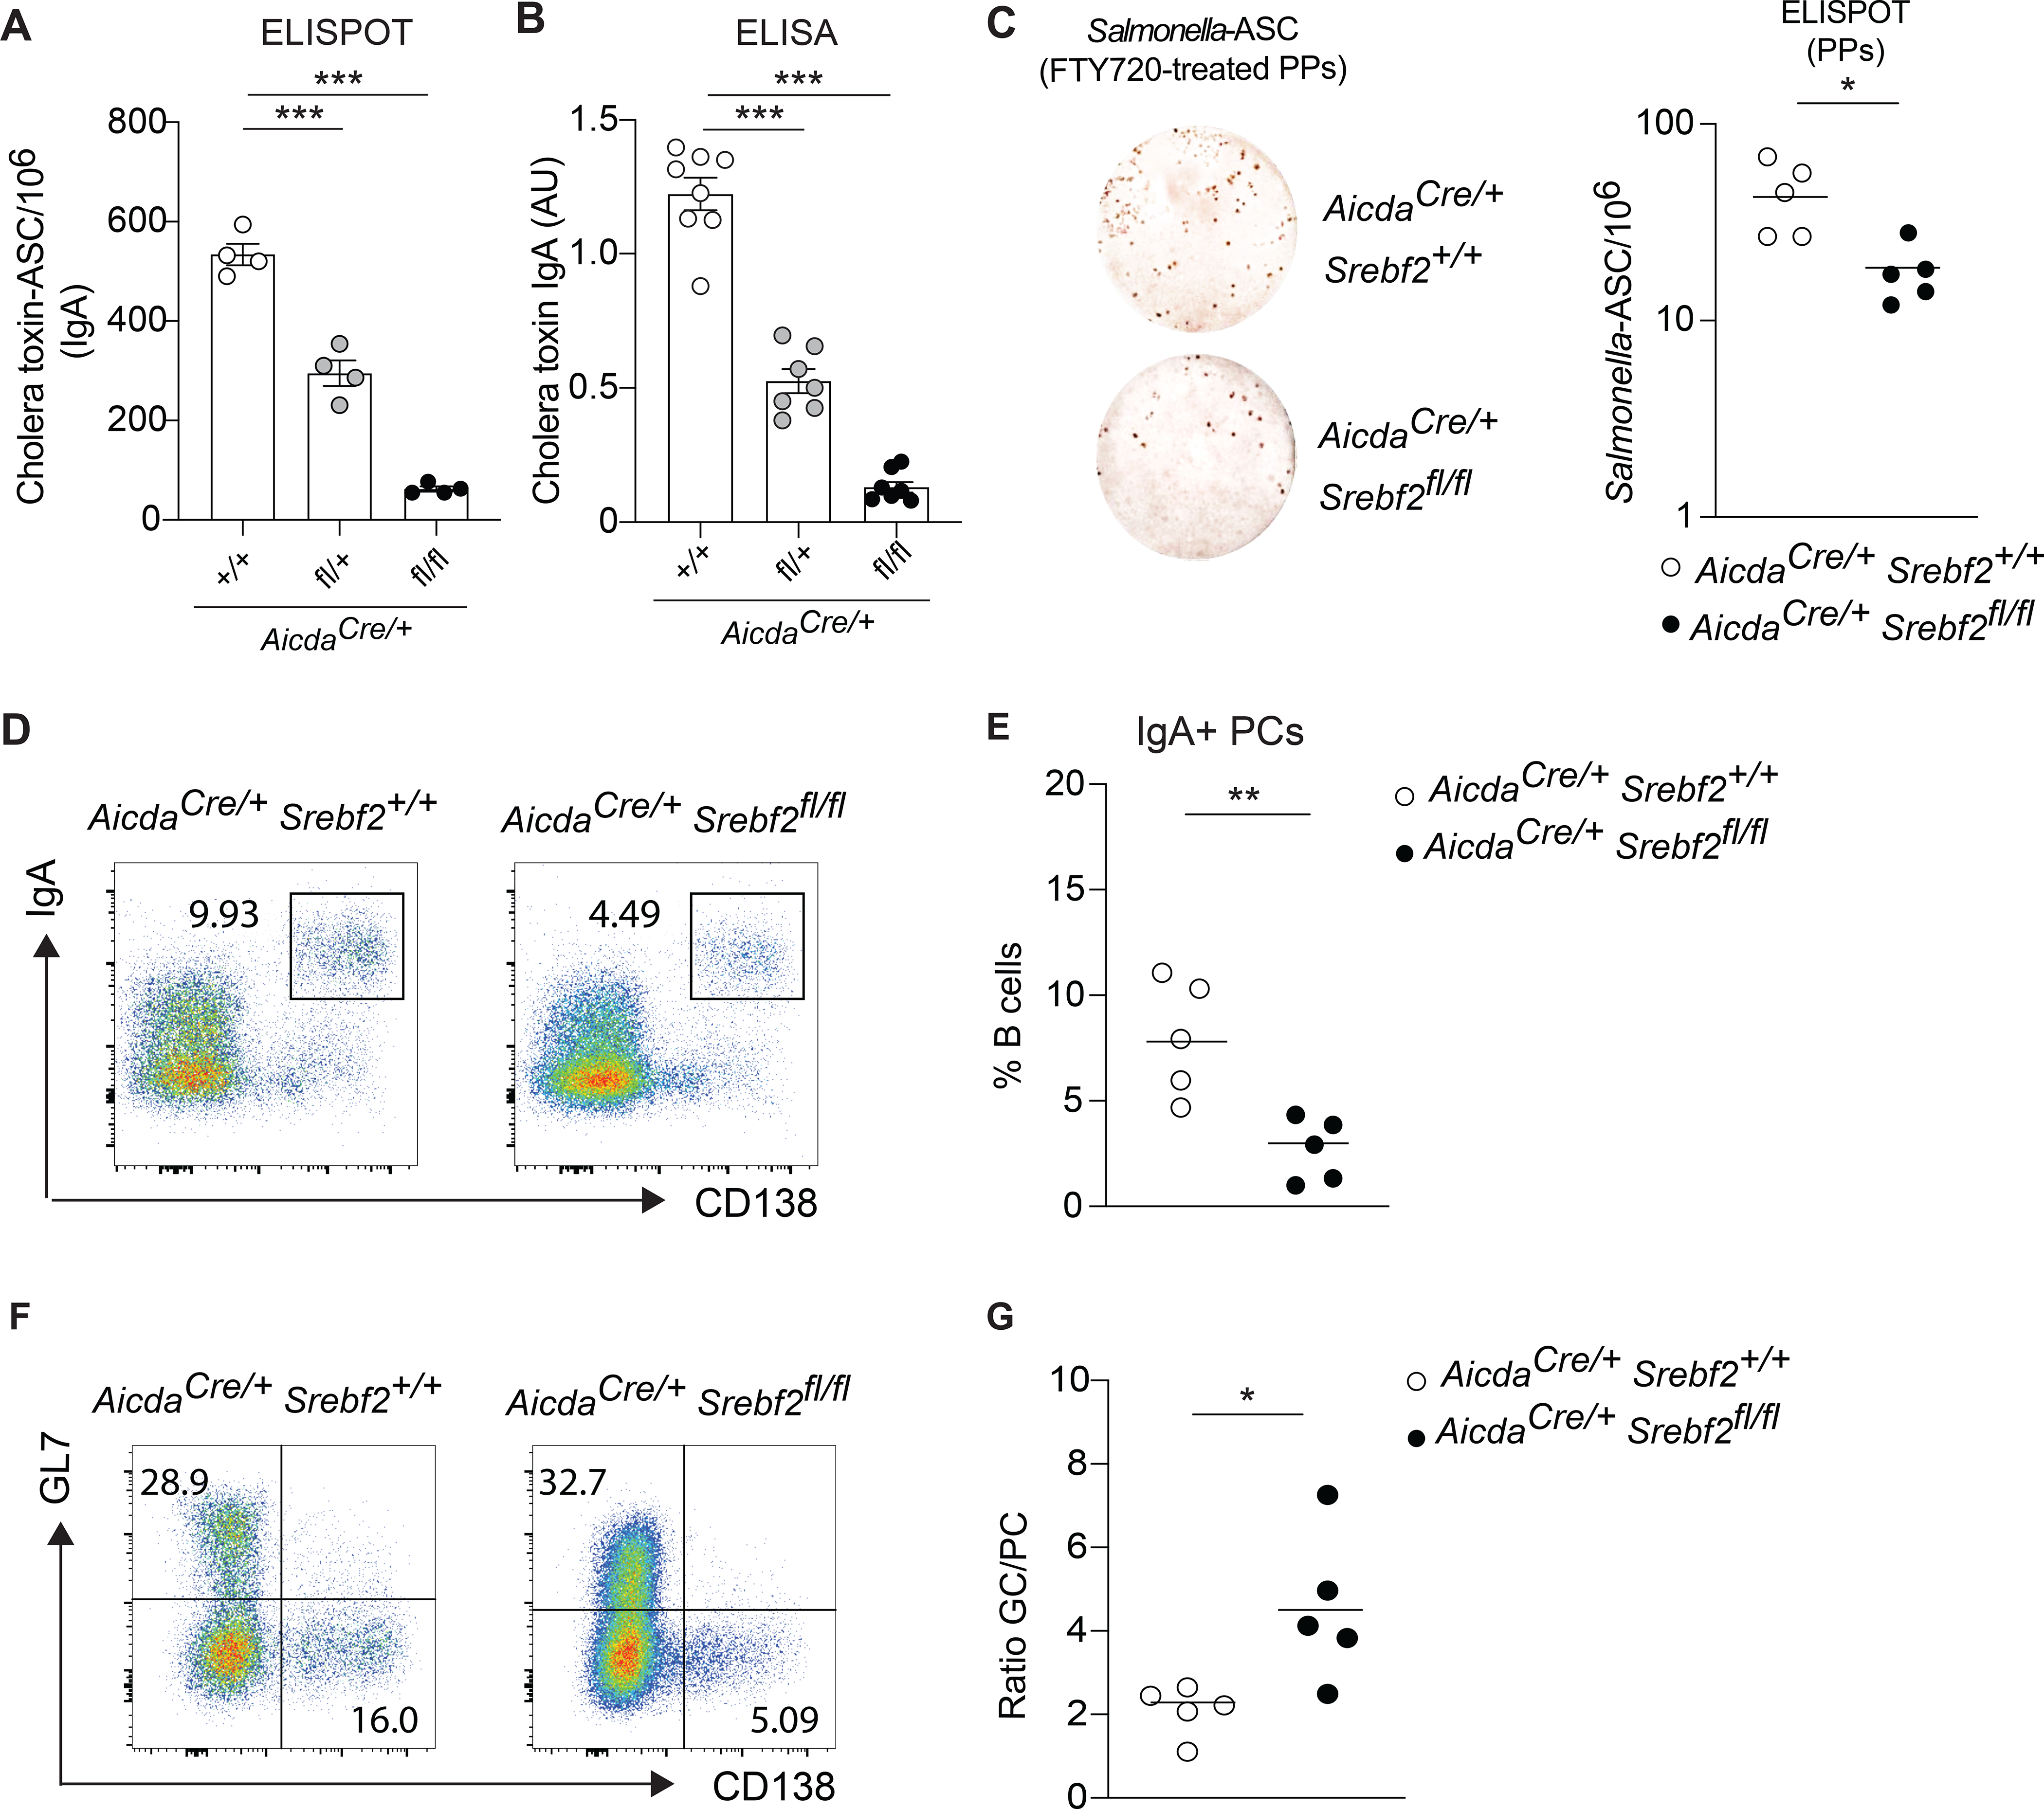
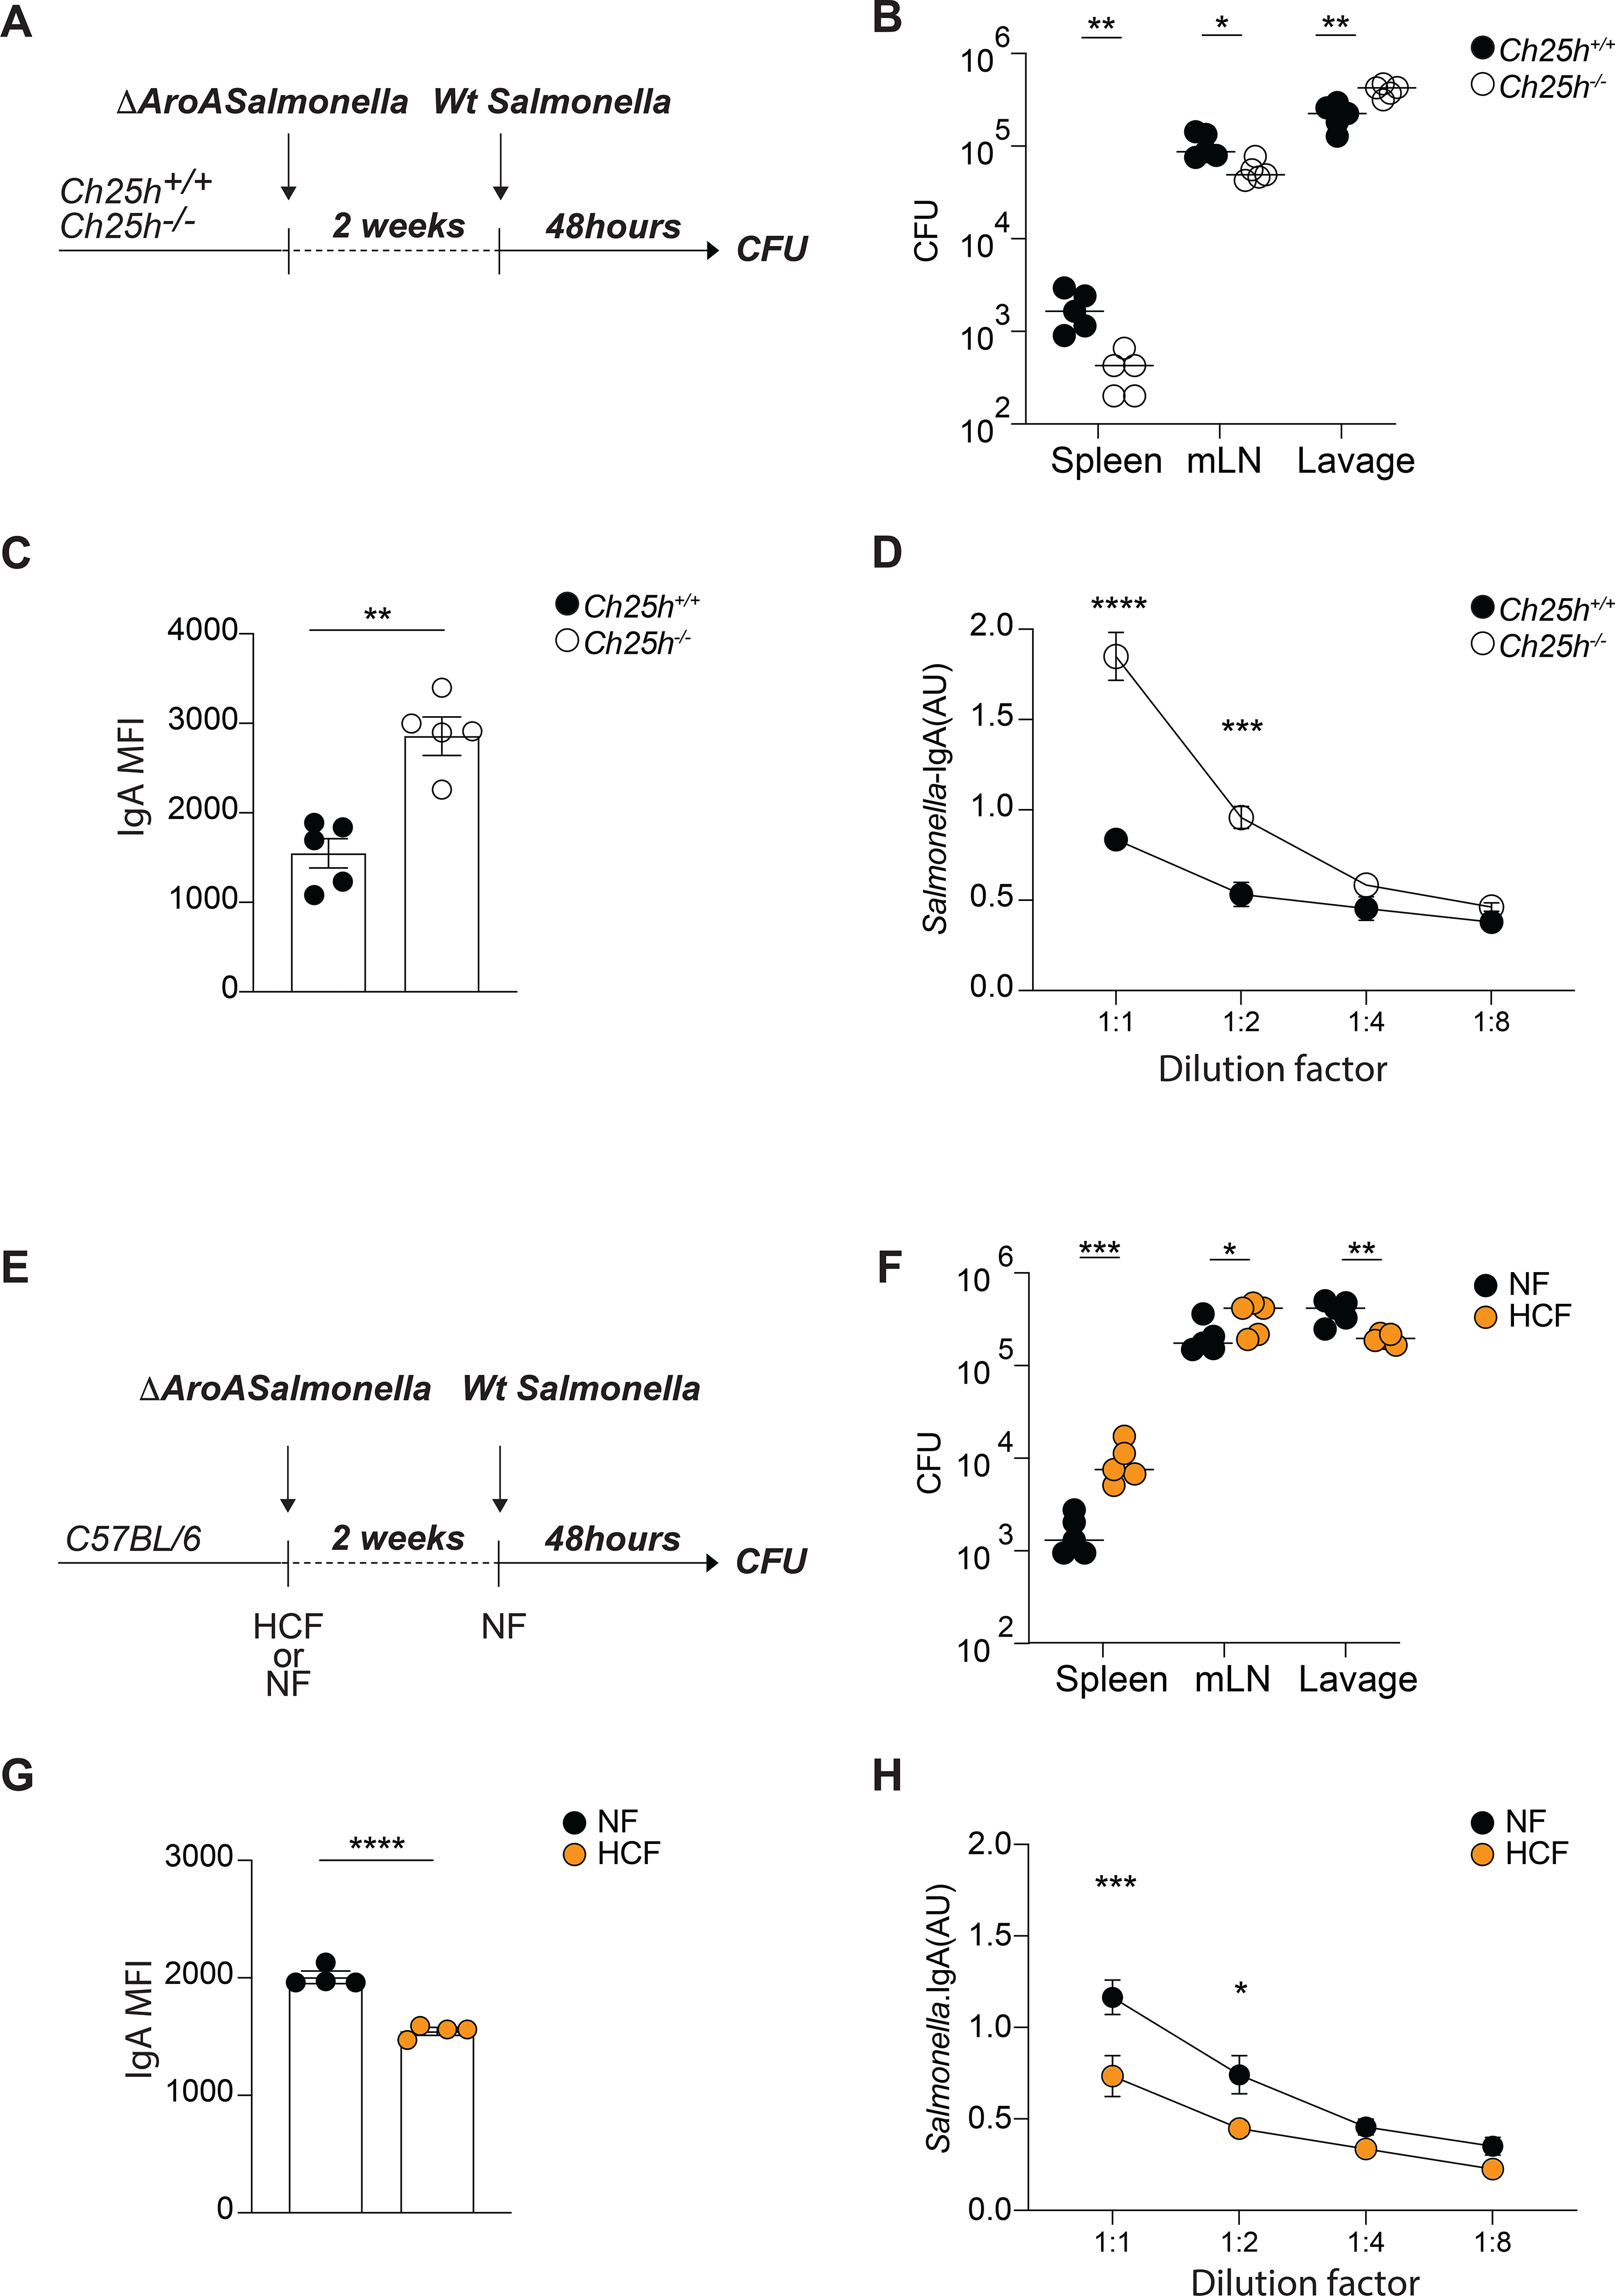
Diets high in cholesterol alter intestinal immunity. Here, we examined how the cholesterol metabolite 25-hydroxycholesterol (25-HC) impacts the intestinal B cell response. Mice lacking cholesterol 25-hydroxylase (CH25H), the enzyme generating 25-HC, had higher frequencies of immunoglobulin A (IgA)-secreting antigen-specific B cells upon immunization or infection. 25-HC did not affect class-switch recombination but rather restrained plasma cell (PC) differentiation. 25-HC was produced by follicular dendritic cells and increased in response to dietary cholesterol. Mechanistically, 25-HC restricted activation of the sterol-sensing transcription factor SREBP2, thereby regulating B cell cholesterol biosynthesis. Ectopic expression of SREBP2 in germinal center B cells induced rapid PC differentiation, whereas SREBP2 deficiency reduced PC output in vitro and in vivo. High-cholesterol diet impaired, whereas Ch25h deficiency enhanced, the IgA response against Salmonella and the resulting protection from systemic bacterial dissemination. Thus, a 25-HC-SREBP2 axis shapes the humoral response at the intestinal barrier, providing insight into the effect of high dietary cholesterol in intestinal immunity.

Keywords: 25-hydroxycholesterol; Peyer's patches; dietary cholesterol; follicular dendritic cells; immunoglobulin A; plasma cells; sterol response element binding proteins 2.


Conflict of interest statement

Declarations of interest The authors declare no competing interests.

Figures

Figure 1.
Figure 1.. 25-HC, but not EBI2, shapes antigen-specific IgA response in duodenal lamina propria.
(A) Representative flow cytometric plot and compiled analysis of IgA+ plasma cells in duodenal lamina propria of Ch25h−/− and littermate control mice. (B) Representative ELISPOT and compiled percentage of cholera toxin-IgA secreting PCs from lamina propria of Ch25h−/− and littermate control immunized for 3 weeks with cholera toxin. (C) Percentage of cholera toxin-specific IgA secreting PCs in LP of Ebi2−/− mice immunized for 3 weeks with cholera toxin. (D,E) ELISA of cholera toxin-specific IgA in small intestine lavage and serum of Ch25h−/− and littermate control mice immunized for 3 weeks with cholera toxin. (F) Representative ELISPOT and compiled percentage of Salmonella-specific IgA PCs in intestinal lamina propria of Ch25h−/− and littermate control mice and two weeks post-infection. Data are representative of three independent experiment, ns=non-significant, *** p<0.005; ****p<0.001 (unpaired Student’s T test).
Figure 2.
Figure 2.. 25-HC modulates antigen-specific PC generation in Peyer’s patches.
(A) Flow cytometric analysis of plasma cells in Peyer’s patches of Ch25h−/− and littermate control mice treated daily with FTY720 or saline for one week. (B) Number of cholera toxin -specific IgA secreting cells in Ch25h−/−, (C) Ebi2−/− and wild type mice, measured by ELISPOT. (D) Representative ELISPOT and compiled Salmonella-specific IgA secreting cells in Peyer’s patches of Ch25h−/− and littermate control mice treated with FTY720. Data indicate the frequency of Salmonella-specific-ASC among Peyer’s patch cells. (E) Analysis of Class switching recombination in Peyer’s patches by flow cytometry. (F) Quantification of secreted IgA by ELISA from GC B cells cultured with NB21 cells and incubated with the indicated sterols for 3.5 days. A,B,C,E are pooled from at least three independent experiments, D, F from two independent experiments. Statistical significance was measured by two-way ANOVA using Bonferroni’s corrections (B,C,F) **p<0.01, unpaired Student’s t test (D).
Figure 3.
Figure 3.. FDCs and diet impact tissue 25-HC levels and control IgA response.
(A) CD21-DTR and littermate control mice were reconstituted with WT bone marrow and treated with diphtheria toxin for 16hrs: lipids were extracted from Peyer’s patches for 25-HC measurement using transwell migration assay with EBI2+ M12 cells. (B) Transwell migration assay of EBI2+ M12 cells in response to lipid extracted from Peyer’s patches of wild type mice treated with recombinant LTβR-FC or isotype control. (C) Relative migration of EBI2+ M12 cells exposed to Peyer’s patches lipid extracts of wild type mice treated for 1 weeks with 0.15 % High cholesterol diet (Western diet-HCF) or normal chow (NF). (D,E) Total number of cholera toxin-specific ASC detected by ELISPOT in mesenteric lymph nodes and Peyer’s patches from Ch25h−/− and littermate control fed with mice NF or 0.15% of HCF. Results are pooled from 3 or 4 independent experiments. ns=non-significant, *p<0.05, **p<0.01,*** p<0.005, ****p<0.001 (unpaired Student’s T test) in (A,B,C) and ns=non-significant, *p<0.05, **p<0.01,***p<0.005, ****p<0.001 (two-way ANOVA) in (D,E).
Figure 4.
Figure 4.. 25-HC regulates SREBP2 transcription and activation in stimulated B cells.
Transcript level of Srebf2 (A) and Srebf1a (B) in B cell subsets from Peyer’s patches of wild-type mice and (C) from Peyer’s patches of Ch25h−/− and littermate control mice measured by qPCR. (D) Analysis of gene expression of Srebf2 and SREBP2-target in follicular B cells stimulated with anti-IgM for 16h. (E) Cumulative and representative flow cytometry of SREBP2 nuclear staining in follicular B cells stimulated with the indicated stimuli. (F) qPCR results of Srebf2 and its target genes in sorted B cells of germinal center LZ and (G) DZ. (H) Blimp expression in sorted DZ (CXCR4+CD86−) and LZ (CXCR4−CD86+) GC B cells from Peyer’s patches of Ch25h−/− and littermate control mice. Each symbol represents one independent mouse from 9–10 (A,B,C, E) or 4 mice (F,G). Graphs show mean and SEM. *p<0.05,**p<0.01,***p<0.005, ****p<0.001(two-way ANOVA).
Figure 5.
Figure 5.. SREBP2 ectopic expression induces plasma cell development.
(A) Representative plot of AicdaCre/+Rosa26 tdTom/+ BM transduced with CD90.1 retroviral vector in Peyer’s patches. (B) Representative plot of frequency and fate of tdTom+ B cells transduced with indicated vectors. (C) Summary of the data in (B). (D) Representative gating of tdTom+ PCs in lamina propria. (E) Representative plot of frequency and fate of tdTom+ B cells transduced with indicated vectors. (F) Ratio of transduced B cells in lamina propria and Peyer’s patches from data in (B) and (E). (G) Representative flow cytometry of GC B cells from mice of the indicated genotype cultured with NB21 cells for 2.5 days. (H,I) Frequency of PCs and GC B cell from G. (J) Quantification of secreted total IgA in A by ELISA. Data represents 3 independent experiments. Graphs show mean and SEM.**p<0.01,***p<0.005, ****p<0.001(two-way ANOVA).
Figure 6.
Figure 6.. SREBP2 controls germinal center differentiation potential in vitro and in vivo.
(A) Number of cholera toxin-IgA ASC cells in lamina propria of AicdaCre/+Srebf2 flox/flox and littermate control mice, quantified by ELISPOT. (B) Quantification of cholera toxin-IgA in small intestine lavage of mice treated 3 weeks with cholera toxin. (C) Representative ELISPOT and compiled data showing Salmonella-specific IgA secreting cells in Peyer’s patches of AicdaCre/+Srebf2 +/+ and AicdaCre/+Srebf2 flox/flox mice infected with Salmonella and treated with FTY720. (D) Representative flow cytometry and (E) compiled frequency of IgA+ PCs in Peyer’s patches of AicdaCre/+Srebf2 +/+ and AicdaCre/+Srebf2 flox/flox mice infected with Salmonella and treated with FTY720 as in (C). (F) Representative flow cytometry of GC B cell and PCs from Peyer’s patches of AicdaCre/+Srebf2 +/+ and AicdaCre/+Srebf2 flox/flox mice infected with Salmonella and treated with FTY720 as in (C, D). (G) Ratio of GC B cell and PCs in Peyer’s patches from (F). Each symbol represents one mouse from 3–4 independent experiments. *p<0.05, **p<0.01,***p<0.005 (two-way ANOVA).
Figure 7.
Figure 7.. Susceptibility to Salmonella systemic dissemination is shaped by 25-HC and dietary cholesterol.
(A) Experimental setup of ΔAroA Salmonella and Wt Salmonella sequential infection using Ch25h+/+ and Ch25h−/− mice. (B) Salmonella CFU quantification in spleen, mesenteric lymph nodes and intestinal lavage from mice infected as in (A). (C) Analysis of mean fluorescence intensity (MFI) of IgA binding to Salmonella by flow cytometry in intestinal lavages of Ch25h+/+ and Ch25h−/− mice infected as in (A). (D) Salmonella-specific IgA titer measured by ELISA in intestinal lavages of Ch25h+/+ and Ch25h−/− mice infected as in (A). (E) Experimental setup of ΔAroA Salmonella and Wt Salmonella sequential infection in C56Bl6 mice during dietary perturbation. (F) Salmonella CFU quantification in spleen, mesenteric lymph nodes and intestinal lavage from mice infected as in (E). (G) Analysis of mean fluorescence intensity (MFI) of IgA binding to Salmonella by flow cytometry in intestinal lavages from mice infected as in (E). (H) Salmonella-specific IgA titer measured by ELISA in intestinal lavages of mice infected as in (E). Each dot represents an individual mouse from two independent experiments. Data are presented as mean + SEM and statistical differences were measured as multiple t-test in (B,C,F,G) or one-way ANOVA in (D and H) with *p<0.05, **p<0.01,***p<0.005, ****p<0.001.

Comment in

References

    1. Baptista AP, Gola A, Huang Y, Milanez-Almeida P, Torabi-Parizi P, Urban JF Jr., Shapiro VS, Gerner MY, Germain RN, 2019. The Chemoattractant Receptor Ebi2 Drives Intranodal Naive CD4+ T Cell Peripheralization to Promote Effective Adaptive Immunity. Immunity 50, 1188–1201.e6. doi:10.1016/j.immuni.2019.04.001 - DOI - PubMed
    1. Belkaid Y, Naik S, 2013. Compartmentalized and systemic control of tissue immunity by commensals. Nat Immunol 14, 646–653. doi:10.1038/ni.2604 - DOI - PMC - PubMed
    1. Blanc M, Hsieh WY, Robertson KA, Kropp KA, Forster T, Shui G, Lacaze P, Watterson S, Griffiths SJ, Spann NJ, Meljon A, Talbot S, Krishnan K, Covey DF, Wenk MR, Craigon M, Ruzsics Z, Haas J, Angulo A, Griffiths WJ, Glass CK, Wang Y, Ghazal P, 2012. The Transcription Factor STAT-1 Couples Macrophage Synthesis of 25-Hydroxycholesterol to the Interferon Antiviral Response. Immunity 1–13. doi:10.1016/j.immuni.2012.11.004 - DOI - PMC - PubMed
    1. Buffie CG, Bucci V, Stein RR, McKenney PT, Ling L, Gobourne A, No D, Liu H, Kinnebrew M, Viale A, Littmann E, van den Brink MRM, Jenq RR, Taur Y, Sander C, Cross JR, Toussaint NC, Xavier JB, Pamer EG, 2014. Precision microbiome reconstitution restores bile acid mediated resistance to Clostridium difficile. Nature 517, 205–208. doi:10.1038/nature13828 - DOI - PMC - PubMed
    1. Cani PD, Bibiloni R, Knauf C, Waget A, Neyrinck AM, Delzenne NM, Burcelin R, 2008. Changes in gut microbiota control metabolic endotoxemia-induced inflammation in high-fat diet-induced obesity and diabetes in mice. Diabetes 57, 1470–1481. doi:10.2337/db07-1403 - DOI - PubMed

Publication types

MeSH terms