. 2021 Dec 3;129(12):1086-1101.
doi: 10.1161/CIRCRESAHA.121.319737. Epub 2021 Oct 14.

Cardiac Resident Macrophages Prevent Fibrosis and Stimulate Angiogenesis

Affiliations

Cardiac Resident Macrophages Prevent Fibrosis and Stimulate Angiogenesis

Xavier S Revelo et al. Circ Res. .

Abstract

Rationale: The initial hypertrophy response to cardiac pressure overload is considered compensatory, but with sustained stress, it eventually leads to heart failure. Recently, a role for recruited macrophages in determining the transition from compensated to decompensated hypertrophy has been established. However, whether cardiac resident immune cells influence the early phase of hypertrophy development has not been established.

Objective: To assess the role of cardiac immune cells in the early hypertrophy response to cardiac pressure overload induced by transverse aortic constriction (TAC).

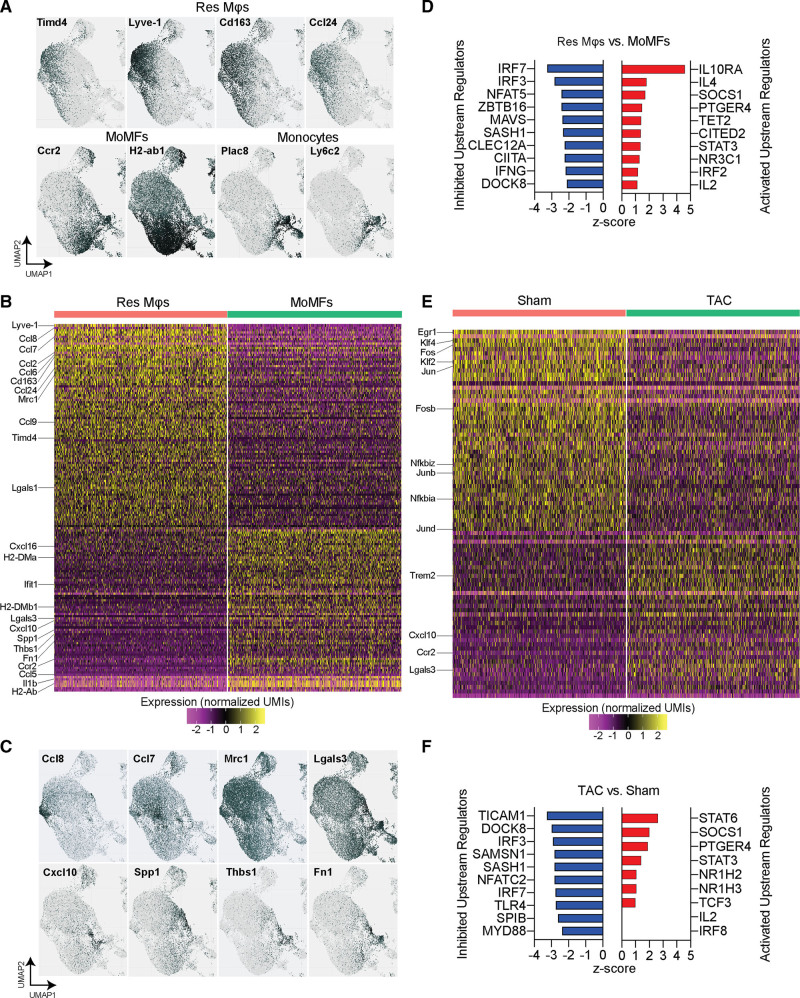
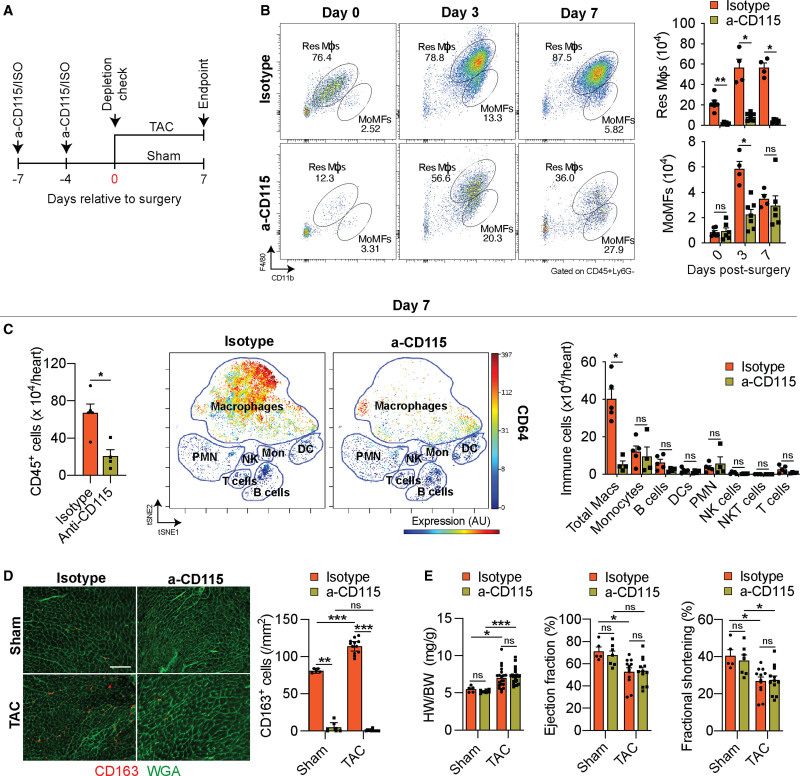
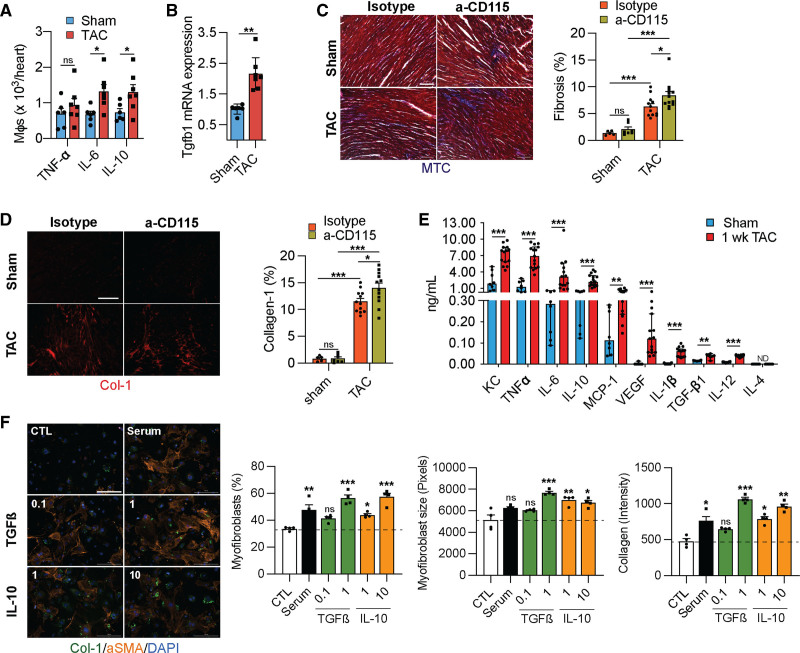
Methods and results: We performed cytometry by time-of-flight to determine the identity and abundance of immune cells in the heart at 1 and 4 weeks after TAC. We observed a substantial increase in cardiac macrophages 1 week after TAC. We then conducted Cite-Seq single-cell RNA sequencing of cardiac immune cells isolated from 4 sham and 6 TAC hearts. We identified 12 clusters of monocytes and macrophages, categorized as either resident or recruited macrophages, that showed remarkable changes in their abundance between sham and TAC conditions. To determine the role of cardiac resident macrophages early in the response to a hypertrophic stimulus, we used a blocking antibody against macrophage colony-stimulating factor 1 receptor (CD115). As blocking CD115 initially depletes all macrophages, we allowed the replenishment of recruited macrophages by monocytes before performing TAC. This preferential depletion of resident macrophages resulted in enhanced fibrosis and a blunted angiogenesis response to TAC. Macrophage depletion in CCR2 (C-C chemokine receptor type 2) knockout mice showed that aggravated fibrosis was primarily caused by the recruitment of monocyte-derived macrophages. Finally, 6 weeks after TAC these early events lead to depressed cardiac function and enhanced fibrosis, despite complete restoration of cardiac immune cells.

Conclusions: Cardiac resident macrophages are a heterogeneous population of immune cells with key roles in stimulating angiogenesis and inhibiting fibrosis in response to cardiac pressure overload.

Keywords: fibrosis; heart failure; hypertrophy; macrophages; monocytes.


Figures

Figure 1.
Figure 1.
Cytometry by time-of-flight of cardiac immune cells shows an expansion of macrophages early after cardiac pressure overload. A, Relative abundance (left) and total number (right) of cardiac CD45+ (protein tyrosine phosphatase receptor type C) immune cells in response to sham or transverse aortic constriction (TAC) surgery at 1 or 4 wk (n=11, 9, 11) determined by cytometry by time of flight (CyTOF). Statistical significance was evaluated by a 1-way ANOVA. All pairwise comparisons were made. Tukey tests were used to correct for multiple comparisons. B, Representative visualized stochastic neighbor embedding (ViSNE) plot showing unsupervised clustering of cardiac immune cells (left) and quantification of their abundance (right) in sham and TAC conditions (n=11, 9, 11). Each dot represents a single cell in the ViSNE plot. Statistical significance by cell type was evaluated by a 1-way ANOVA (normally distributed data) or a Kruskal-Wallis test (non-normally distributed data). All pairwise comparisons were made. Tukey (normally distributed data) or Dunn (non-normally distributed data) tests were used to correct for multiple comparisons. C, Representative ViSNE plots from CyTOF data showing colored expression in arbitrary units (AU) of CD11b (integrin alpha M), CD64 (Fc fragment of IgG receptor Ia), CX3CR1 (C-X3-C motif chemokine receptor 1), CD206 (mannose receptor C type 1), MHC-II (major histocompatibility complex II), CCR2 (C-C chemokine receptor type 2), and Lyve1 (lymphatic vessel endothelial hyaluronan receptor 1) in cardiac immune cells in sham and TAC conditions (n=11, 9, 11). D, Representative CyTOF plots (left) showing cardiac resident macrophages (Res Mϕs) and monocyte-derived macrophages (MoMFs) gated based on CD11b and CD64. The dot color represents the level of CCR2, TIMD4 (T cell immunoglobulin and mucin domain containing 4), and CX3CR1 expression in AU. Quantification (right) of Res Mϕs and MoMFs in sham and TAC conditions (n=8, 5, 6). Statistical significance was evaluated by a Kruskal-Wallis test. All pairwise comparisons were made. Dunn tests were used to correct for multiple comparisons. E, Representative CyTOF plots (left) showing an alternative gating strategy of cardiac macrophages based on CCR2 and MHC-II expression. The dot color represents the level of Ly6C (lymphocyte antigen 6 complex, locus C) and CD206 expression in AU. Quantification (right) of CCR2 and MHC-II macrophage subsets in sham and TAC conditions (n=8, 5, 6). Statistical significance was evaluated by a Kruskal-Wallis test. All pairwise comparisons were made. Dunn tests were used to correct for multiple comparisons. Data are presented as mean±SEM or median±95% CI. DC indicates dendritic cells; Mon, monocytes; NK, natural killer; NKT, natural killer T cells; and PMN, polymorphonuclear leukocytes. Statistical significance is summarized as ns, not significant, *P<0.05, **P<0.01, and ***P<0.001.
Figure 2.
Figure 2.
Single-cell RNA sequencing (scRNA-seq) of cardiac immune cells after pressure overload. A, Design of multiplexed scRNA-seq experiment using hashtag-oligos (HTO) barcoded antibodies to identify mouse of origin of each cell. B, Overview of identified barcodes used to select singlets for further analysis. C, Pie chart indicating the number of single cells sequenced for each condition (upper) and per mouse (lower). D, Uniform manifold approximation and projection (UMAP) projection of single cells clustered in 25 unique clusters with identification of immune cell identity. Sham and transverse aortic constriction (TAC)–derived cells are plotted separately to visualize abundance differences. E, Heatmap of top 5 identified genes that are specifically expressed within clusters using unsupervised clustering. F, Bar graph of relative abundance of each cluster of cells in sham vs TAC conditions (n=4, 6). Statistical significance between the sham and 1-wk TAC groups by cluster was determined by 2-tailed Mann-Whitney U tests. Data are presented as mean±SEM. Single-cell data is shown as scaled, variance-stabilized unique molecular identifiers (UMI) counts. DC indicates dendritic cell; NK, natural killer; and PMN, polymorphonuclear leukocytes. Statistical significance is summarized as ns, not significant and *P<0.05.
Figure 3.
Figure 3.
Analysis of cardiac macrophage gene expression patterns. A, Identification of cardiac resident macrophages (Res Mϕs) and monocyte-derived macrophages (MoMFs) based on the expression of marker genes Lyve1 (lymphatic vessel endothelial hyaluronan receptor 1), Timd4 (T cell immunoglobulin and mucin domain containing 4), Ccr2, and H2-Ab1. Additional genes that correspond with Res Mϕs (Cd163 and Ccl24 [C-C chemokine ligands]) or monocytes (Ly6c2 [lymphocyte antigen 6 complex, locus C] and Plac8 [placenta associated 8]) are shown. B, Heatmap of differentially expressed genes (DEGs) between Res Mϕs and MoMFs. Selected genes are indicated. C, Gene expression patterns of selected genes that were differentially expressed between Res Mϕs and MoMFs show distinct expression patterns within mϕ clusters. D, List of inhibited and activated upstream regulators identified with Ingenuity Pathway analysis from DEGs between Res Mϕs and MoMFs. E, Heatmap of Differentially Expressed Genes between sham and transverse aortic constriction (TAC)–derived cardiac mϕs. Selected genes are indicated. F, List of inhibited and activated upstream regulators identified with Ingenuity Pathway analysis from DEGs between sham and TAC-derived mϕs. Single-cell data is shown as scaled, variance-stabilized unique molecular identifiers (UMI) counts. CIITA indicates Class II Major Histocompatibility Complex Transactivator; CLEC12A, C-Type Lectin Domain Family 12 Member A; CITED2, Cbp/P300 Interacting Transactivator With Glu/Asp Rich Carboxy-Terminal Domain 2; DOCK8, Dedicator of Cytokinesis 8; IFNG, Interferon Gamma; IL2, Interleukin 2; IL4, Interleukin 4; IL10RA, Interleukin 10 Receptor Subunit Alpha; IRF2, Interferon Regulatory Factor 2; IRF3, Interferon Regulatory Factor 3; IRF7, Interferon Regulatory Factor 7; RF8, Interferon Regulatory Factor 8; MAVS, Mitochondrial Antiviral Signaling Protein; MYD88, MYD88 Innate Immune Signal Transduction Adaptor; NFATC2, Nuclear Factor of Activated T Cells 2; NFAT5, Nuclear Factor of Activated T Cells 5; NR1H2, Nuclear Receptor Subfamily 1 Group H Member 2; NR1H3, Nuclear Receptor Subfamily 1 Group H Member 3; NR3C1, Nuclear Receptor Subfamily 3 Group C Member 1; PTGER4, Prostaglandin E Receptor 4; SAMSN1, SAM Domain, SH3 Domain And Nuclear Localization Signals 1; SASH1, SAM And SH3 Domain Containing 1; SOCS1, Suppressor Of Cytokine Signaling 1; SPIB, Spi-B Transcription Factor; STAT3, Signal Transducer And Activator Of Transcription 3; STAT6, Signal Transducer And Activator Of Transcription 6; TCF3, Transcription Factor 3; TET2, Tet Methylcytosine Dioxygenase 2; TICAM1, Toll Like Receptor Adaptor Molecule 1; TLR4, Toll Like Receptor 4; and ZBTB16, Zinc Finger and BTB Domain Containing 16.
Figure 4.
Figure 4.
Cd115 antibody-mediated depletion of cardiac macrophages. A, Schematic showing the timing of isotype or α-CD115 antibody administration relative to sham or transverse aortic constriction (TAC) surgery. B, Representative flow cytometry plots (left) and quantification (right) of cardiac resident macrophages (Res Mϕs) and monocyte-derived macrophages (MoMFs) 0, 3, and 7 d after TAC surgery in isotype or α-CD115 antibody–treated mice (n=4, 6). Statistical significance between the isotype and α-CD115 antibody–treated groups by day was determined by 2-tailed Mann-Whitney U tests. C, Cytometry by time-of-flight–based quantification of cardiac immune cells (left), visualized stochastic neighbor embedding (ViSNE) plot showing the abundance of different immune cells and colored expression of CD64 in arbitrary units (AU, middle), and quantification of immune cell abundance (right) after TAC surgery in isotype or α-CD115 antibody administration (n=5, 4). Statistical significance between the isotype and α-CD115 antibody–treated groups by cell type was determined by 2-tailed Mann-Whitney U tests. D, Representative histological images (left, bar=100 µm) of CD163 staining (red) with WGA (wheat germ agglutinin; green) and quantification (right) of CD163+ cells (n=5, 7, 12, 12). Statistical significance was evaluated by a Kruskal-Wallis test. All pairwise comparisons were made. Dunn tests were used to correct for multiple comparisons. E, Cardiac hypertrophy [left, heart weight (HW) to body weight (BW) ratio], ejection fraction (middle), and fractional Shortening (right, n=5, 7, 12, 12). Statistical significance was evaluated by a 2-way ANOVA. All pairwise comparisons were made. Tukey tests were used to correct for multiple comparisons. Data are presented as mean±SEM or median±95% CI. DC indicates dendritic cell; NK, natural killer; and PMN, polymorphonuclear leukocytes. Statistical significance is summarized as ns, not significant, *P<0.05, **P<0.01, and ***P<0.001.
Figure 5.
Figure 5.
Cardiac macrophages (mϕs) regulate fibrosis. A, Quantification of cytokine-producing mϕs isolated from sham or transverse aortic constriction (TAC)–operated mice. n=6, 7. Statistical significance by cytokine was determined by 2-tailed unpaired Student t test. B, Taqman quantitative polymerase chain reaction for transforming growth factor β1 (Tgfb1) on cDNA from freshly isolated mϕs from sham or TAC-operated mice. n=6, 7. Statistical significance was evaluated by a Kruskal-Wallis test. C, Representative images (left) of Masson Trichrome-stained (MTC) sections derived from sham or TAC-operated mice after isotype or α-CD115 antibody administration. Bar graph (right) shows quantification of fibrosis (blue staining). n=5, 7, 12, 12. Statistical significance was evaluated by a 2-way ANOVA. All pairwise comparisons were made. Tukey tests were used to correct for multiple comparisons. D, Representative images (left) of collagen-1-stained sections (Col-1) derived from sham or TAC-operated mice after isotype or α-CD115 antibody administration. Bar graph (right) shows the percent of collagen-1 staining (n=5, 7, 12, 12). Statistical significance was evaluated by a 2-way ANOVA. All pairwise comparisons were made. Tukey tests were used to correct for multiple comparisons. E, Quantification of cytokines in the supernatants from mϕs isolated from sham or TAC-operated mice (n=8, 15) using a Legendplex assay following 16 h of culture with 10 ng/mL of LPS (lipopolysaccharides). Statistical significance between the sham and TAC groups by cytokine was determined by 2-tailed Mann-Whitney U tests. F, Representative images of fibroblasts stained for collagen-1 (green), αSMA (alpha smooth muscle actin) (orange), and DAPI (4',6-diamidino-2-phenylindole) (blue) following treatment with 0.1 and 10 ng/mL of TGFß or IL (interleukin)-10 (n=4). Bar graphs show quantification of myofibroblast percentage, myofibroblast size, and collagen-1 intensity. Statistical significance was evaluated by a Kruskal-Wallis test. All comparisons were made against the control (CTL). Dunn tests were used to correct for multiple comparisons. Statistical significance is summarized as ns, not significant, *P<0.05, **P<0.01, and ***P<0.001. Scale bar=100 µm for C, D and 200 µm for F. KC indicates platelet-derived growth factor-inducible protein KC; MCP-1, monocyte-chemoattractant protein-1; TNF, tumor necrosis factor; and VEGF, vascular endothelial growth factor.
Figure 6.
Figure 6.
Cardiac macrophages (mϕs) regulate angiogenesis. A, Taqman quantitative polymerase chain reaction for Vegfa on cDNA from freshly isolated mϕs from sham or transverse aortic constriction (TAC) operated mice (n=6, 7). Statistical significance by cytokine was determined by 2-tailed unpaired Student t test. B, Representative images (left) of isolectin B4-stained sections (green) derived from sham or TAC-operated mice after isotype or α-CD115 antibody administration. Bar graph (right) shows quantification of microvascular density (vessels/cardiomyocyte; n=5, 7, 12, 12). Statistical significance was evaluated by a 2-way ANOVA. All pairwise comparisons were made. Tukey tests were used to correct for multiple comparisons. C, Representative images of tube formation assay using HUVECs (human umbilical vein endothelial cells) cocultured with negative control (CTL) or with cardiac mϕs compared to positive control. Bar graphs show the quantification of various aspects of tube formation (mesh area, number of nodes, junctions, and meshes; n=3, 6, 3). Statistical significance was evaluated by a Kruskal-Wallis test. All comparisons were made against the negative CTL. Dunn tests were used to correct for multiple comparisons. Data are presented as mean±SEM or median±95% CI. Scale bar=100 µm for C and 200 µm for B. AU indicates arbitrary units; DAPI, 4',6-diamidino-2-phenylindole; and MVD, microvascular density. Statistical significance is summarized as ns, not significant, *P<0.05, **P<0.01, and ***P<0.001.
Figure 7.
Figure 7.
Recruitment of monocytes promotes fibrosis after pressure overload. A, Experimental design of isotype or α-CD115 antibody administration to either C57Bl/6j or CCR2 (C-C chemokine receptor type 2) KO mice relative to the time of sham or transverse aortic constriction (TAC) surgery. B, Representative flow cytometry plots (left) and quantification (right) of cardiac resident macrophages (Res Mϕs) and monocyte-derived macrophages (MoMFs) in C57Bl/6j or CCR2 knock-out (KO) mice 1 wk after isotype or α-CD115 antibody treatment (n=7, 9, 7, 8). Statistical significance was evaluated by a 2-way ANOVA. All pairwise comparisons were made. Tukey tests were used to correct for multiple comparisons. C, Cardiac hypertrophy; heart weight (HW) to body weight (BW) ratio (left), ejection fraction (middle), and fractional shortening (right) of isotype or α-CD115–treated C57Bl/6j and CCR2 KO mice (n=7, 9, 7, 8). Statistical significance was evaluated by a 2-way ANOVA. D, Representative images (left) and quantification (right) of Masson Trichrome-stained (MTC) sections from isotype or α-CD115–treated C57Bl/6j and CCR2 KO mice (n=7, 9, 7, 8). Statistical significance was evaluated by a 2-way ANOVA. All pairwise comparisons were made. Tukey tests were used to correct for multiple comparisons. E, Representative images (left) of collagen-1 (Col-1)-stained sections derived from sham or TAC-operated mice after isotype or α-CD115 antibody administration. Bar graph (right) shows the percent of collagen-1 staining (n=7, 9, 7, 8). Statistical significance was evaluated by a 2-way ANOVA. All pairwise comparisons were made. Tukey tests were used to correct for multiple comparisons. Data are presented as mean±SEM. Scale bar=100 µm. Statistical significance is summarized as ns, not significant, *P<0.05, **P<0.01, and ***P<0.001.
Figure 8.
Figure 8.
Depletion of cardiac macrophages (Mϕ) leads to decreased cardiac function. A, cytometry by time-of-flight (CyTOF)–based quantification of cardiac immune cells (left), visualized stochastic neighbor embedding (ViSNE) plot showing the abundance of different immune cells and colored expression of CD64 in arbitrary units (AU, middle), and quantification of immune cell abundance (right) 6 wk after transverse aortic constriction (TAC) surgery in isotype or α-CD115 antibody administration (n=4). Statistical significance between the isotype and α-CD115 antibody–treated groups by cell type was determined by 2-tailed Mann-Whitney U tests. B, Representative CyTOF plots (left) showing cardiac resident Mϕs (Res Mϕs) and monocyte-derived Mϕs (MoMFs) gated based on CD11b (integrin alpha M) and CD64. The dot color represents the level of CCR2 (C-C chemokine receptor type 2), TIMD4 (T-cell immunoglobulin and mucin domain containing 4), and CX3CR1 (C-X3-C motif chemokine receptor 1) expression. Quantification (right) of Res Mϕs and MoMFs 6 wk after TAC in mice which received isotype or α-CD115 antibody administration (n=4). Statistical significance between the isotype and α-CD115 antibody–treated groups was determined by 2-tailed Mann-Whitney U tests. C, Cardiac hypertrophy (left, heart weight [HW] to body weight [BW] ratio), ejection fraction (middle), and fractional shortening (right) in sham and TAC mice after isotype or α-CD115 antibody administration (n=5, 4, 6, 6). Statistical significance was evaluated by a 2-way ANOVA. All pairwise comparisons were made. Tukey tests were used to correct for multiple comparisons. D, Representative images (left) and area quantification (right) of WGA (wheat germ agglutinin)-stained sections from isotype or α-CD115 antibody administered mice 6 wk after sham and TAC (n=5, 4, 6, 6). Statistical significance was evaluated by a 2-way ANOVA. All pairwise comparisons were made. Tukey tests were used to correct for multiple comparisons. E, Representative images (left) and quantification (right) of Masson Trichrome-stained (MTC) sections from isotype or α-CD115 antibody administered mice 6 wk after sham and TAC (n=5, 4, 6, 6). Statistical significance was evaluated by a 2-way ANOVA. All pairwise comparisons were made. Tukey tests were used to correct for multiple comparisons. F, Representative images (left) and quantification (right) of collagen-1-(Col-1)-stained sections from isotype or α-CD115 antibody administered mice 6 wk after sham and TAC (n=5, 4, 6, 6). Statistical significance was evaluated by a 2-way ANOVA. All pairwise comparisons were made. Tukey tests were used to correct for multiple comparisons. Scale bar=100 µm. DC indicates dendritic cells, Macs, macrophages, Mon, monocytes, NK, natural killer; PMN, polymorphonuclear leukocytes; and tSNE, t-distributed stochastic neighbor embedding. Statistical significance is summarized as ns, not significant, *P<0.05, **P<0.01, and ***P<0.001.

Comment in

References

    1. van Berlo JH, Maillet M, Molkentin JD. Signaling effectors underlying pathologic growth and remodeling of the heart. J Clin Invest. 2013; 123:37–45. doi: 10.1172/JCI62839 - PMC - PubMed
    1. Nakamura M, Sadoshima J. Mechanisms of physiological and pathological cardiac hypertrophy. Nat Rev Cardiol. 2018; 15:387–407. doi: 10.1038/s41569-018-0007-y - PubMed
    1. Sano M, Minamino T, Toko H, Miyauchi H, Orimo M, Qin Y, Akazawa H, Tateno K, Kayama Y, Harada M, et al. . p53-induced inhibition of Hif-1 causes cardiac dysfunction during pressure overload. Nature. 2007; 446:444–448. doi: 10.1038/nature05602 - PubMed
    1. Schiattarella GG, Hill JA. Inhibition of hypertrophy is a good therapeutic strategy in ventricular pressure overload. Circulation. 2015; 131:1435–1447. doi: 10.1161/CIRCULATIONAHA.115.013894 - PMC - PubMed
    1. Perrino C, Naga Prasad SV, Mao L, Noma T, Yan Z, Kim HS, Smithies O, Rockman HA. Intermittent pressure overload triggers hypertrophy-independent cardiac dysfunction and vascular rarefaction. J Clin Invest. 2006; 116:1547–1560. doi: 10.1172/JCI25397 - PMC - PubMed

Publication types

Substances