. 2021 Oct 14;13(1):153.
doi: 10.1186/s13073-021-00965-0.

Artificial intelligence enables comprehensive genome interpretation and nomination of candidate diagnoses for rare genetic diseases

Affiliations

Artificial intelligence enables comprehensive genome interpretation and nomination of candidate diagnoses for rare genetic diseases

Francisco M De La Vega et al. Genome Med. .

Abstract

Background: Clinical interpretation of genetic variants in the context of the patient's phenotype is becoming the largest component of cost and time expenditure for genome-based diagnosis of rare genetic diseases. Artificial intelligence (AI) holds promise to greatly simplify and speed genome interpretation by integrating predictive methods with the growing knowledge of genetic disease. Here we assess the diagnostic performance of Fabric GEM, a new, AI-based, clinical decision support tool for expediting genome interpretation.

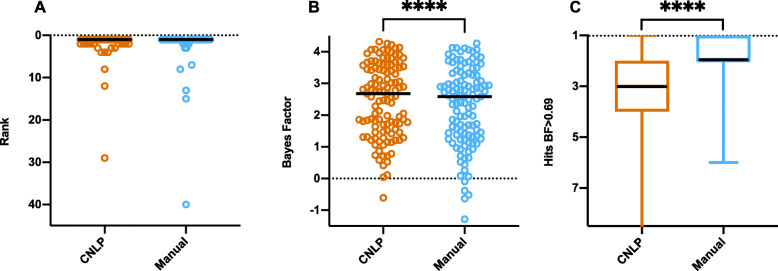
Methods: We benchmarked GEM in a retrospective cohort of 119 probands, mostly NICU infants, diagnosed with rare genetic diseases, who received whole-genome or whole-exome sequencing (WGS, WES). We replicated our analyses in a separate cohort of 60 cases collected from five academic medical centers. For comparison, we also analyzed these cases with current state-of-the-art variant prioritization tools. Included in the comparisons were trio, duo, and singleton cases. Variants underpinning diagnoses spanned diverse modes of inheritance and types, including structural variants (SVs). Patient phenotypes were extracted from clinical notes by two means: manually and using an automated clinical natural language processing (CNLP) tool. Finally, 14 previously unsolved cases were reanalyzed.

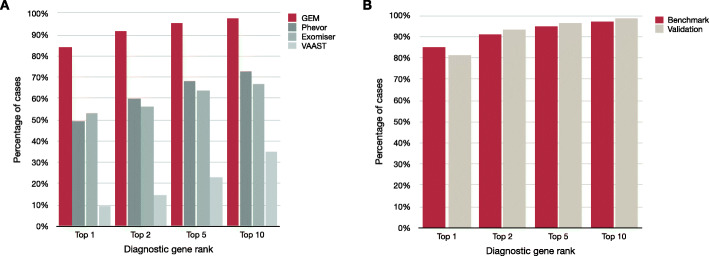
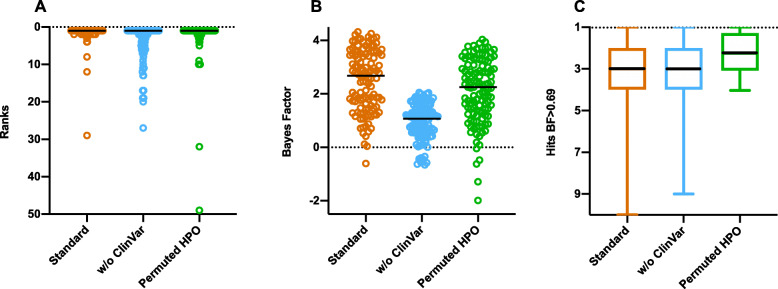
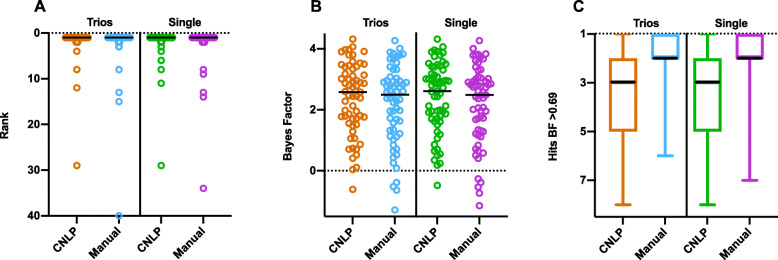
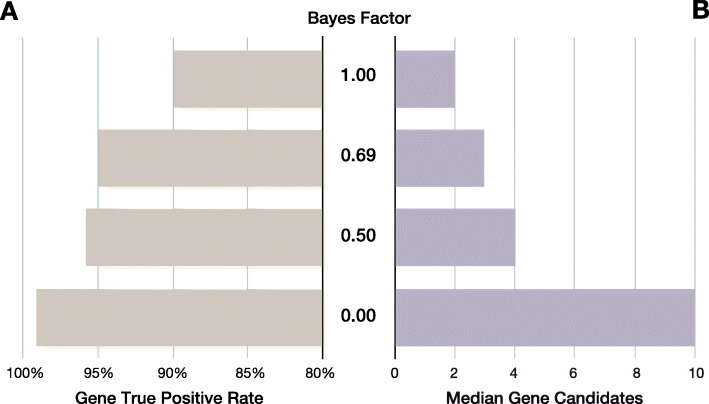
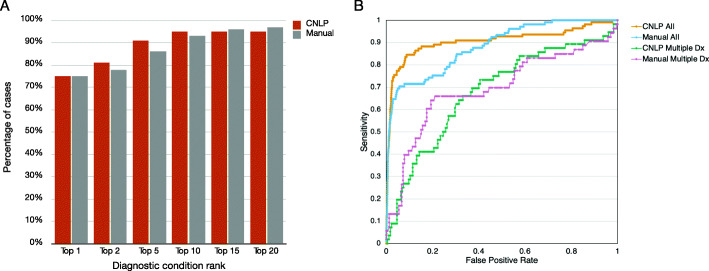
Results: GEM ranked over 90% of the causal genes among the top or second candidate and prioritized for review a median of 3 candidate genes per case, using either manually curated or CNLP-derived phenotype descriptions. Ranking of trios and duos was unchanged when analyzed as singletons. In 17 of 20 cases with diagnostic SVs, GEM identified the causal SVs as the top candidate and in 19/20 within the top five, irrespective of whether SV calls were provided or inferred ab initio by GEM using its own internal SV detection algorithm. GEM showed similar performance in absence of parental genotypes. Analysis of 14 previously unsolved cases resulted in a novel finding for one case, candidates ultimately not advanced upon manual review for 3 cases, and no new findings for 10 cases.

Conclusions: GEM enabled diagnostic interpretation inclusive of all variant types through automated nomination of a very short list of candidate genes and disorders for final review and reporting. In combination with deep phenotyping by CNLP, GEM enables substantial automation of genetic disease diagnosis, potentially decreasing cost and expediting case review.


Conflict of interest statement

FV, EF, JM, and MGR were employees of Fabric Genomics Inc. during the performance of this work and have received stock grants from Fabric Genomics Inc. BM, PB, and MY are consultants to Fabric Genomics Inc. and have received consulting fees and stock grants from Fabric Genomics Inc. The remaining authors declare that they have no competing interests.

Figures

Fig. 1
Fig. 1
The diagnostic sensitivity of GEM was greater than the variant prioritization methods Phevor, Exomiser, and VAAST. A Proportion of the benchmark cohort of 119 cases where the true causal genes (or variants in the case of causal SVs) were identified among the top 1st, 2nd, 5th, or 10th gene candidates. Patient phenotypes were extracted manually from medical records by clinicians and provided as HPO term inputs to GEM, Exomiser, and Phevor. VAAST only considers variant information. It should be noted that GEM and Phevor ranks correspond to genes, which may include one or two variants (the latter in the case of a compound heterozygote), whereas Exomiser and VAAST ranks were for single variants. In the case of compound heterozygotes, the rank of the top-ranking variant is shown for Exomiser and VAAST. B Comparison of GEM performance in the validation cohort (excluding SV cases) versus the validation cohort (comprised of 60 rare genetic disease cases from multiple sources)
Fig. 2
Fig. 2
Comparison of GEM performance with manually curated and CNLP-derived HPO terms in the benchmark cohort. Distribution of ranks for causal genes (A); GEM Bayes factors for causal genes (B); and number of candidates (hits) at BF ≥ 0.69 threshold (moderate support) (C). The black line in the graphs denotes the median. The asterisks represent statistical difference between the groups with p < 0.0001 from a two-tailed Wilcoxson matched pairs signed rank test (ranks showed no statistically significant difference)
Fig. 3
Fig. 3
Impact of missing data and mis-phenotyping on GEM performance in the benchmark cohort. Causal gene rank (A); Bayes factors for causal genes (B); and number of candidates (hits) above gene BF ≥ 0.69 threshold (moderate support) (C) under standard conditions, withdrawing ClinVar information, and permuting HPO terms extracted by CNLP. The black line in the graphs denotes the median
Fig. 4
Fig. 4
Comparative performance of parent-offspring trios or duos vs. singleton probands in the benchmark cohort. Causal gene rank (A); Bayes factors (B); and number of candidates (hits) above gene BF ≥ 0.69 (moderate support) (C) for 63 cases analyzed as parent-offspring trios (n = 59) or duos (n = 4), as compared with analysis as single probands, using both manually curated or CNLP-derived HPO terms. The black line in the graphs denotes the median. No statistically significance difference between the any manual/CNLP groups was found between trios versus single probands using the two-tailed Wilcoxson matched pairs signed rank test
Fig. 5
Fig. 5
Trade-off between GEM gene scores, maximal true positive rates, and number of candidates for review in the benchmark cohort. GEM gene scores are Bayes factors (BF) that can be used speed case review. A Gene maximal true positive rate achieved at the different BF thresholds (Y-axis). B Median number of candidate genes for review at each BF threshold. As the BF threshold is decreased, true positive rate increases, while the number of candidates to review remains manageable. Input HPO terms for this analysis were extracted by CNLP
Fig. 6
Fig. 6
Performance of GEM condition match scores for diagnostic nomination in the benchmark cohort. A Ranks for reported diagnostic conditions for the benchmark dataset, using a GEM gene BF score ≥ 0.69 and sorted by CM score, for HPO terms derived from CNLP or manual curation. B Receiver-operator characteristic curves for the condition match (CM) score for all hits with BF 0. CNLP All: HPO extracted from clinical notes by CNLP; AUC = 0.91. Manual: Manually curated HPO terms; AUC = 0.88. CNLP Multiple Dx: CNLP-derived CM score for the true positive disorder versus the other possible disorders associated with that gene; AUC = 0.68. Manual Multiple Dx: As for CNLP-derived CM but using manually curated HPO terms; AUC = 0.69

References

    1. Church G. Compelling reasons for repairing human germlines. New Engl J Med. 2017;377:1909–1911. doi: 10.1056/NEJMp1710370. - DOI - PubMed
    1. Bamshad MJ, Nickerson DA, Chong JX. Mendelian gene discovery: fast and furious with no end in sight. Am J Hum Genet. 2019;105:448–455. doi: 10.1016/j.ajhg.2019.07.011. - DOI - PMC - PubMed
    1. Online Mendelian Inheritance in Man, OMIM®McKusick-Nathans Institute of Genetic Medicine, Johns Hopkins University (Baltimore, MD) (available at https://omim.org/).
    1. Wright CF, FitzPatrick DR, Firth HV. Paediatric genomics: diagnosing rare disease in children. Nat Rev Genet. 2018;10:1–16. - PubMed
    1. Mardis ER. The $1,000 genome, the $100,000 analysis? Genome Med. 2010;2:84. - PMC - PubMed

Publication types