. 2021 Oct 14;9(1):204.
doi: 10.1186/s40168-021-01131-9.

Microbial colonization and resistome dynamics in food processing environments of a newly opened pork cutting industry during 1.5 years of activity

Affiliations

Microbial colonization and resistome dynamics in food processing environments of a newly opened pork cutting industry during 1.5 years of activity

José F Cobo-Díaz et al. Microbiome. .

Abstract

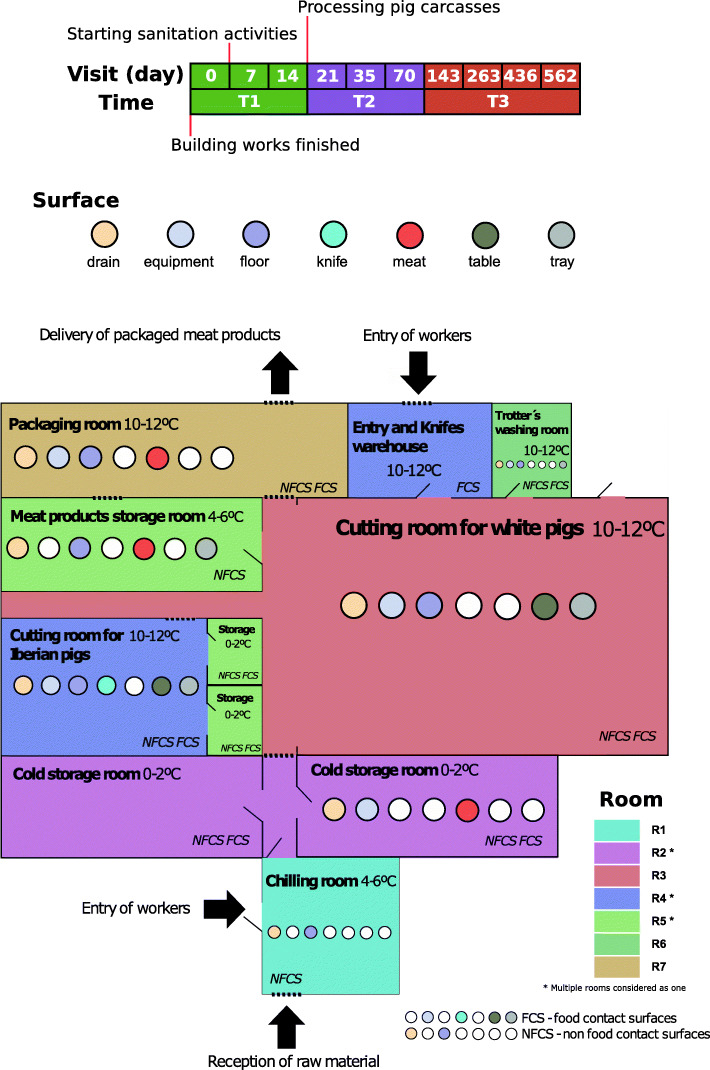
Background: The microorganisms that inhabit food processing environments (FPE) can strongly influence the associated food quality and safety. In particular, the possibility that FPE may act as a reservoir of antibiotic-resistant microorganisms, and a hotspot for the transmission of antibiotic resistance genes (ARGs) is a concern in meat processing plants. Here, we monitor microbial succession and resistome dynamics relating to FPE through a detailed analysis of a newly opened pork cutting plant over 1.5 years of activity.

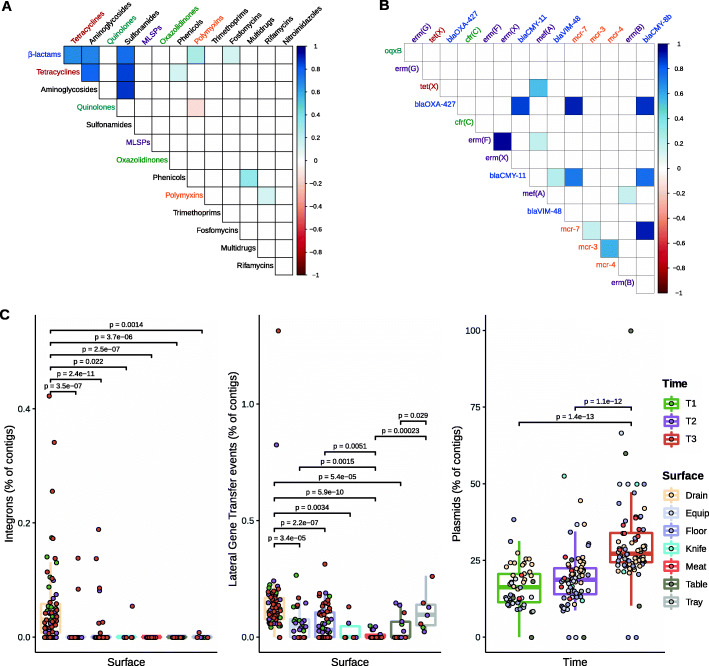
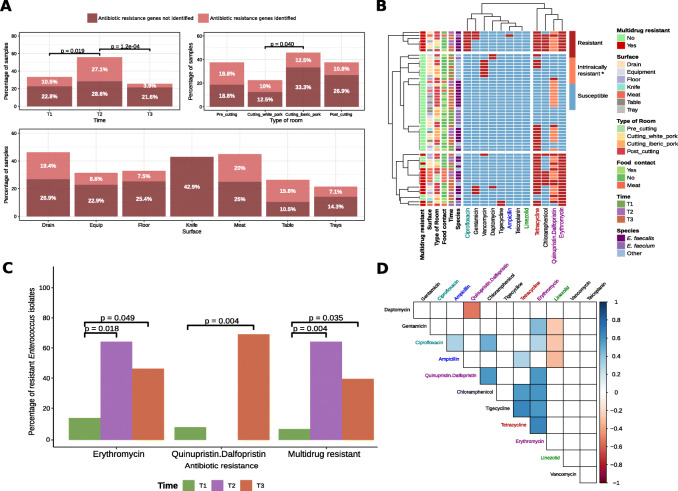
Results: We identified a relatively restricted principal microbiota dominated by Pseudomonas during the first 2 months, while a higher taxonomic diversity, an increased representation of other taxa (e.g., Acinetobacter, Psychrobacter), and a certain degree of microbiome specialization on different surfaces was recorded later on. An increase in total abundance, alpha diversity, and β-dispersion of ARGs, which were predominantly assigned to Acinetobacter and associated with resistance to certain antimicrobials frequently used on pig farms of the region, was detected over time. Moreover, a sharp increase in the occurrence of extended-spectrum β-lactamase-producing Enterobacteriaceae and vancomycin-resistant Enterococcaceae was observed when cutting activities started. ARGs associated with resistance to β-lactams, tetracyclines, aminoglycosides, and sulphonamides frequently co-occurred, and mobile genetic elements (i.e., plasmids, integrons) and lateral gene transfer events were mainly detected at the later sampling times in drains.

Conclusions: The observations made suggest that pig carcasses were a source of resistant bacteria that then colonized FPE and that drains, together with some food-contact surfaces, such as equipment and table surfaces, represented a reservoir for the spread of ARGs in the meat processing facility. Video Abstract.

Keywords: Antimicrobial resistance; Food processing environments; Metagenomics; Microbial ecology.


Conflict of interest statement

The authors declare that they have no competing interests.

Figures

Fig. 1
Fig. 1
Schematic map of the meat processing facility and summarized information on the surfaces sampled per room. The 10 visits performed over 1.5 years were grouped in 3 time categories (indicated at the top of the figure). The different surfaces sampled at each processing room are indicated in the map, together with their classification as food contact surfaces (FCS) or non-food contact surfaces (NFCS). Asterisks in the “Room” legend indicate those room groups comprising more than one physical room
Fig. 2
Fig. 2
Changes in bacterial alpha diversity, beta diversity and bacterial taxonomy along the 1.5 years of activity. A Richness and Simpson indices and B Principal Coordinates Analysis, using Bray–Curtis distance, at species level for the 210 industry samples (n = 55 for T1, n = 70 for T2, n = 85 for T3). The centroid of each ellipse represents the group mean, and the shape is defined by the covariance within each group. Adonis test values are indicated in Table S1. Distance to the centroid values were employed to evaluate the homogeneity of variances within each group. Only significant p values (p < 0.05) obtained from the Wilcoxon signed-rank test analysis are indicated. C Barplot representing the relative abundance of the 16 most relevant bacterial genera (average total abundance > 1% or at least one sample with abundance > 15%). Other bacterial genera are grouped into “Other”. A sample is represented by each bar, and samples are grouped by Surface and Time groups, indicated at the top and bottom of the plot, respectively
Fig. 3
Fig. 3
Resistome dynamic changes along time, as revealed through the evolution of alpha and beta diversity indices and ARG composition. A Antibiotic resistance genes (ARGs) counts per million reads (CPM); B richness and Simpson’s indices calculated with the ARG–CPM matrix; and C Principal Coordinates Analysis, using Bray–Curtis distance, at ARG level for the 210 industry samples (n = 55 for T1, n = 70 for T2, n = 85 for T3). The centroid of each ellipse represents the group mean, and the shape is defined by the covariance within each group. Adonis test values are indicated at Table S1. Distance to the centroid values were employed to evaluate the homogeneity of variances within each group. Only significant p values (p < 0.05) obtained from the Wilcoxon signed-rank test analysis are indicated. D Barplot of the 14 ARG classes detected and E the 7 ARG classes associated with resistance to antibiotics of critical importance calculated by adding ARG abundances according to the antibiotic classes they confer resistance to (Suppl. File 4). Each bar represents the average value for samples belonging to the same Surface and Time groups, indicated at the top and bottom of the plot, respectively. MLSP refers to macrolides, lincosamides, streptogramins, pleuromutilins
Fig. 4
Fig. 4
Taxonomic assignment of ARGs based on their alignment to contigs assembled from reads within the same sample. Pie charts representing the taxonomical distribution, at genus level, of ARGs for the 5 most abundant antibiotic classes. Colors indicate the average genera relative abundance (%) for samples belonging to the same Time group and to NFCS (non-food contact surfaces: drain and floor) or FCS (food contact surfaces: equipment, knife, table, and tray) groups. The size of each pie is proportional to the square root of the average value for the total ARGs detected in each group (Time–Surface type combination), indicated in sqrt(CPM) at y-axis. The genera on the legend are sorted by descending order according to the total ARGs detected
Fig. 5
Fig. 5
ARGs co-occurrence and mobilome distribution among surfaces and sampling times. A Correlogram of co-occurrence for the different ARG classes and ARGs detected in industry samples (n = 210). R-square values for the Pearson correlation between abundances of ARG classes (CPM) are indicated. Significant correlations (p < 0.05) are indicated in blue color (positive correlation) or red color (negative correlation). Gene names are colored according to the ARG classes they belong to, which are equally colored on Fig. 5A. C Mobilome characterization for FPE samples (n = 210), including the percentage of contigs carrying integrons and LGT events, or associated with plasmids. Contigs shorter than 1000 bp were removed before the mobilome analysis. Only significant p values (p < 0.05) obtained from the Wilcoxon signed-rank test analysis are indicated
Fig. 6
Fig. 6
Characterization of AR phenotypes and genotypes for the isolates in the culture collection, with special emphasis on Enterococcus spp. strains. A Proportion of samples where antibiotic resistant isolates or ARGs were detected on FPE surfaces (n = 229). Color indicates detection of, at least, one phenotypically antibiotic-resistant isolate on selective agar plates (dark pink), or a positive PCR for one of the ARGs (light pink). Samples were grouped according to sampling time (n = 57 for T1, n = 70 for T2, and n = 102 for T3), processing room (n = 48 for Pre-cutting, n = 48 for Cutting_Iberian_pork, n = 40 for Cutting_white_pork and n = 93 for Post_cutting) and surface type (n = 67 for Drain, n = 35 for Equipment, n = 67 for Floor, n = 7 for Knife, n = 20 for Meat, n = 19 for Table, and n = 14 for Tray). Only significant differences (p < 0.05) obtained from the two-proportion Z test are represented. B Antibiotic resistance profile obtained for Enterococcus isolates from Sensititre panels. ECOFF values from EUCAST (see Additional file 2: Table S3) served as threshold to classify Enterococcus isolates (n = 58) as antibiotic resistant or susceptible. Isolates resistant to antibiotics of three different families were considered multidrug resistant. * E. faecalis is intrinsically resistant to quinupristin.dalfopristin. C Proportion of Enterococcus isolates (n = 14 for T1, n = 14 for T2, and n = 30 for T3) showing phenotypic resistance, with statistically significant changes along time as determined through the Fisher’s exact test. D Correlogram of phenotypic antibiotic resistance levels in Enterococcus isolates. Pearson correlation coefficients between the MIC values of those antibiotics included in the Sensititre panels (n = 12) were calculated. Only significant coefficients (p < 0.05) are represented in blue color (positive correlation) or red color (negative correlation). Antibiotics names are colored according to the ARG classes as on Fig. 5A. E. fecalis isolates (n = 2 for T1, n = 13 for T2, and n = 17 for T3) were removed from quinupristin.dalfopristin on (C) and (D) sections, due to their intrinsic resistance
Fig. 7
Fig. 7
Microbial persistence in FPE. A Correlograms performed using average values, per surface type and sampling time, of each species and ARGs found by using kraken2 and ResFinder, respectively. Pearson correlation values are indicated within the cells. B Number of contigs with length > 1500 bp obtained on each FPE sample (n = 210). C Average values of contigs shared between samples from the same sampling time by surface type. D Average values of contigs shared between samples from 2 different sampling times by surface type. Only significant p values (p < 0.05) obtained from the Wilcoxon signed-rank test analysis are indicated. E Taxonomical classification of shared contigs. The proportions in the circle indicate the percentage of contigs assigned to each genus

References

    1. Møretrø T, Langsrud S. Residential bacteria on surfaces in the food industry and their implications for food safety and quality. Compr Rev Food Sci Food Saf. 2017;16(5):1022–1041. doi: 10.1111/1541-4337.12283. - DOI - PubMed
    1. Larsen MH, Dalmasso M, Ingmer H, Langsrud S, Malakauskas M, Mader A, Møretrø T, Smole Možina S, Rychli K, Wagner M, John Wallace R, Zentek J, Jordan K. Persistence of foodborne pathogens and their control in primary and secondary food production chains. Food Control. 2014;44:92–109. doi: 10.1016/j.foodcont.2014.03.039. - DOI
    1. Carpentier B, Cerf O. Review - Persistence of Listeria monocytogenes in food industry equipment and premises. Int J Food Microbiol. 2011;145(1):1–8. doi: 10.1016/j.ijfoodmicro.2011.01.005. - DOI - PubMed
    1. Alvarez-Ordóñez A, Broussolle V, Colin P, Nguyen-The C, Prieto M. The adaptive response of bacterial food-borne pathogens in the environment, host and food: implications for food safety. Int J Food Microbiol. 2015;213:99–109. doi: 10.1016/j.ijfoodmicro.2015.06.004. - DOI - PubMed
    1. Alvarez-Ordóñez A, Coughlan LM, Briandet R, Cotter PD. Biofilms in food processing environments: challenges and opportunities. Annu Rev Food Sci Technol. 2019;10(1):173–195. doi: 10.1146/annurev-food-032818-121805. - DOI - PubMed

Publication types

Substances

LinkOut - more resources