. 2021 Nov 10;41(45):9374-9391.
doi: 10.1523/JNEUROSCI.0367-21.2021. Epub 2021 Oct 13.

Broadband Dynamics Rather than Frequency-Specific Rhythms Underlie Prediction Error in the Primate Auditory Cortex

Affiliations

Broadband Dynamics Rather than Frequency-Specific Rhythms Underlie Prediction Error in the Primate Auditory Cortex

Andrés Canales-Johnson et al. J Neurosci. .

Abstract

Detection of statistical irregularities, measured as a prediction error response, is fundamental to the perceptual monitoring of the environment. We studied whether prediction error response is associated with neural oscillations or asynchronous broadband activity. Electrocorticography was conducted in three male monkeys, who passively listened to the auditory roving oddball stimuli. Local field potentials (LFPs) recorded over the auditory cortex underwent spectral principal component analysis, which decoupled broadband and rhythmic components of the LFP signal. We found that the broadband component captured the prediction error response, whereas none of the rhythmic components were associated with statistical irregularities of sounds. The broadband component displayed more stochastic, asymmetrical multifractal properties than the rhythmic components, which revealed more self-similar dynamics. We thus conclude that the prediction error response is captured by neuronal populations generating asynchronous broadband activity, defined by irregular dynamic states, which, unlike oscillatory rhythms, appear to enable the neural representation of auditory prediction error response.SIGNIFICANCE STATEMENT This study aimed to examine the contribution of oscillatory and asynchronous components of auditory local field potentials in the generation of prediction error responses to sensory irregularities, as this has not been directly addressed in the previous studies. Here, we show that mismatch negativity-an auditory prediction error response-is driven by the asynchronous broadband component of potentials recorded in the auditory cortex. This finding highlights the importance of nonoscillatory neural processes in the predictive monitoring of the environment. At a more general level, the study demonstrates that stochastic neural processes, which are often disregarded as neural noise, do have a functional role in the processing of sensory information.

Keywords: auditory cortex; broadband response; mismatch negativity; multiscale multifractal analysis; prediction error; rhythmic components.


Figures

Figure 1.
Figure 1.
Experimental design and ECoG electrode arrays. A, Using a roving oddball paradigm, 20 different single tones were presented in the trains of 3, 5, or 11 identical stimuli. Any two subsequent trains consisted of different tones. This way, while the adjacent standard (depicted in black) and deviant (depicted in green) tones deviated in the frequency because of the transition between the trains, the two expectancy conditions were physically matched, as the first and the last tones of the same train were treated as deviant and standard tones in the analysis of the adjacent stimuli pairs. B, The complete 32-electrode array and connector viewed from the front. G, Ground electrode; R, reference electrode. C, A fitting example of the 32-electrode array on a model brain. D, The complete 64-electrode array and connector viewed from the front. E, A computed tomography image of the implanted 62-electrode array registered to the MRI of monkey Kr (two electrodes were cut during implantation). F, An enlarged view of the temporal area of the marmoset, showing the core (A1, R, and RT) and belt areas. The borders between each auditory area are estimated by overlaying the Common Marmoset Brain Atlas (http://brainatlas.brain.riken.jp/marmoset/modules/xoonips/listitem.php?index_id=66) on the standard brain. A1, Primary auditory cortex; R, area R (rostral auditory cortex); RT, area RT (rostrotemporal auditory cortex). G, Locations of the 32 electrodes in the monkey Fr. The red circle indicates the electrode used for the spectral decomposition and MMA analyses. H, Locations of the 64 electrodes in the monkey Go. The red circle indicates the electrode used for the spectral decomposition and MMA analyses. I, Locations of the 62 electrodes in the monkey Kr. The red circle indicates the electrode used for the spectral decomposition and MMA analyses.
Figure 2.
Figure 2.
ECoG data analyses. A, Time courses of ERP waveforms of the standard (black) and deviant (green) stimuli conditions. The 0 ms time point indicates the onset of a given tone. Error shades represent the SEM, calculated across all trials at each time point. Each subplot represents a different monkey. B, Time–frequency charts showing a spectral power response to the auditory stimuli, expressed as the difference between the standard and the deviant tones. The 0 ms time point indicates the onset of tones. C, Spectral decoupling. Temporally adjacent raw LFP segments of the standard tone (i.e., the last stimulus of the previous train) and the deviant tone (i.e., the first stimulus of the subsequent train) were extracted for the spectral PCA. First, the fast Fourier transform was used to calculate log power (1–250 Hz) of the raw LFP signal, which was afterward normalized across all trials within a given expectancy condition. Normalized spectral snapshots were input into spectral PCA, which separated broadband and rhythmic components. Principal spectral components were reconstructed back to the time series for the subsequent contrast between the expected and unexpected stimuli conditions. D, Two views of regularity in temporal variability. Some simple machines display mechanistic behavior that can be described by decomposing their output variables into multiple frequency-dependent oscillators or combinations of these (spectral analysis). By contrast, brains display complex behavior with output variables that appear erratic, intermittent, and nonstationary, and are the result of an inextricable interdependence of processes at many temporal scales. In this case, a measure that is scale-free and a “summary” of the whole activity is more adequate to characterize the regularities of the signal. This can be thought of as obtaining the spectrum of the different fractal/scaling exponents/singularities hidden in the signal (multifractal analysis). E, Overview of MMA (see Results, Materials and Methods).
Figure 3.
Figure 3.
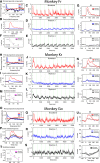
Event-related broadband response of stimulus expectancy. A, H, O, Element magnitude of the major PSCs in the frequency domain (1–240 Hz). In this and other subplots, the Broadband PSC is depicted in red, the Rhythmic 1 PSC (alpha) in blue, and the Rhythmic 2 PSC (delta) in black. B, I, P, A narrow window of back-reconstructed time series of the broadband and rhythmic PSCs, locked to the onset of tones (0 ms). Standard and deviant stimuli are averaged together. CE, JL, QS, Back-reconstructed time series of the Broadband and Rhythmic PSCs along a sequence of 11 identical tones. The 0 ms value indicates the onset of the deviant tone. F, M, T, ANOVA results of the stimulus expectancy (standard, deviant) and the spectral component (Broadband, Rhythmic 1, Rhythmic 2) contrast. Significant main effects were observed for the PSC (Fr: F(2,1438) = 341.70, p < 0.001, η2 = 0.322; Kr: F(2,2878) = 113.00, p < 0.001, η2 = 0.073; Go: F(2,2878) = 78.60, p < 0.001, η2 = 0.052) and the stimulus expectancy (Fr: F(1,719) = 14.1, p < 0.001, η2 = 0.01; Kr: F(1,1439) = 23.60, p < 0.001, η2 = 0.016; Go: F(1,1439) = 4.81, p < 0.029, η2 = 0.003) factors, and the interaction between the PSC and the stimulus expectancy (Fr: F(2,1438) = 17.20, p < 0.001, η2 = 0.02; Kr: F(2,2878) = 20.80, p < 0.001, η2 = 0.014; Go: F(2,2878) = 15.49, p < 0.001, η2 = 0.011). Error bars indicate the standard error of the mean (SEM). =, The main effects; x, the interaction. G, N, U, Stimuli-locked waveforms show post hoc comparisons between the standard and deviant stimuli in the broadband and rhythmic PSCs, which revealed larger amplitude for the deviant stimuli in the Broadband PSC contrast (Fr: t = 6.96, pBc < 0.001; Kr: t = 7.84, pBc < 0.001; Go: t = 5.48, pBc < 0.001), but not in the Rhythmic 1 (Fr: t = 0.378, pBc = 1.00; Kr: t = 0.612, pBc = 1.00; Go: t = 0.397, pBc = 0.99) or the Rhythmic 2 (Fr: t = 0.812, pBc = 1.00; Kr: t = −0.033, pBc = 1.00; Go: t = −1.567, pBc = 1.00) PSC contrasts. pBc = p values after Bonferroni correction. Note: For visualization purposes, 11-tone time series were smoothed with an 80 ms Gaussian envelope (SD = 80 ms) and single-tone time series were smoothed with a 2 ms Gaussian envelope (SD = 20 ms). However, all statistical analyses were conducted on nonsmoothed data.
Figure 4.
Figure 4.
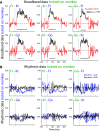
Decoding of stimulus expectancy across monkeys with Broadband and Rhythmic components. Classification of stimulus expectancy conditions (standard, deviant) was conducted in one of the monkeys (plotted in green). Afterward, the LDA classifier was tested on the other two monkeys (plotted in purple). Time points of FDR-corrected significant decoding (AUC) of stimulus categories above are depicted in gray (for details, see Material and Methods). A, Decoding was successful in all six pairs using Broadband PSC. B, Decoding did not exceed the chance level using the Rhythmic 1 and Rhythmic 2 PSCs.
Figure 5.
Figure 5.
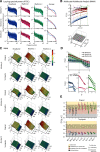
Multiscale multifractal analysis of the broadband and rhythmic dynamics. A, Double-logarithmic plots of the power spectral densities of the Broadband (blue), Rhythmic 1 (pink), and Rhythmic 2 (green) components during all trials (trains of standard and deviant tones) reveal a piecewise, approximately linear decay of power with frequency. The average scaling (fractal) properties of the power spectral densities (last column and black lines in other columns) are distinct across frequencies, spectral components, and marmosets. Notably, while spectral power densities are plotted in the current figure, weights of spectral PCA across frequencies are plotted in Figure 3A,H,O. B, MMA method. Top, Log-log plots of the fluctuation functions Fq(s) for each q[5,5], color coded from dark blue (q = −5) to dark red (q = 5) and scale s (in milliseconds) of the time series corresponding to the Broadband activity of monkey Go. The Hurst (scaling) exponent (h1,2,...,11) is obtained by determining the slope of a linear fit within a window lasting the period (s1,2,...,11) marked with vertical dashed lines. The following three example scales are displayed: s1[10,50], and s11[120,600]. Bottom, Computed Hurst exponents h(q,s) are displayed in a (Hurst) surface plot grid. As an example, the cells corresponding to h1,2,...,11 (q = 2; s = 1, 2, or 11) are highlighted with their respective colors (light gray, lilac, green). C, Hurst surfaces [h(q,s)] of the component activities (each column) and the <h(q,s)> of a distribution of 50 shuffled surrogates for each monkey. D, Scaling properties averaged for all scales. The dependency of the Hurst exponent h on q is evident for all components, suggesting their multifractality. E, Mean (±SD) of the Hurst surfaces (<h(q,s)>) suggests that the Broadband activity has an overall more irregular profile. Each group of three dots with error bars refers respectively to <h(q,s)> across all scales (s) for negative, positive, and all values of q. Individual results for the Broadband (BB), Rhythmic 1 (R1), and Rhythmic 2 (R2) PSCs are displayed in variations of blue, pink, and green colors, respectively. The bottom row shows the values obtained for the distribution of surrogates. The shaded colors denote the interpretation of h(q,s) (relevant for C and D) as the degree of persistence, the lower the value of h, the greater the irregularity or unpredictability in the signal.
Figure 6.
Figure 6.
Contrast of the singularity spectra-based parameters of the Broadband and Rhythmic neural activity. A, Illustration of the singularity spectrum [f(α)] and its parameters. f(α) reveals how densely the singularities (i.e., scaling exponents α) are distributed in a signal. The parabolic vertex shows the central tendency [α0, which corresponds to when f(α)=D0, the fractal dimension]; the width Δα, the degree of multifractality, the αq+, and the αq represent the widths of the left and right tail, which correspond to α values for q > 0 and q < 0. B, Multifractal spectrum of the neural components; each graph shows a line for each scale range and monkey studied, the colors represent the different components (Broadband, Rhythmic 1 and 2), and the gradient light → dark the scale range (s1, s2,…etc). Note that for the three components of neural activity, τ(q) is an approximately smooth function of q that is not linear, which reveals that signals are not monofractal (self-affine). C, Singularity spectrum of the three PSCs for the three marmosets; the lightness of the colors represents the results for different scales (s; light → dark with increasing scales s1,2,...,11). D, Central tendency of the multifractal spectrum (α0), degree of multifractality (Δα), and asymmetry of the spectrum (αsΔα) for the three types of activity [Broadband (BB), blue; Rhythmic 1 (R1), pink; Rhythmic 2 (R2), green]. Each monkey is displayed in a different shade of the colors.

References

    1. Alain C, Woods DL, Knight RT (1998) A distributed cortical network for auditory sensory memory in humans. Brain Res 812:23–37. 10.1016/S0006-8993(98)00851-8 - DOI - PubMed
    1. Alho K (1995) Cerebral generators of mismatch negativity (MMN) and its magnetic counterpart (MMNm) elicited by sound changes. Ear Hear 16:38–51. - PubMed
    1. Arnal LH, Doelling KB, Poeppel D (2015) Delta-beta coupled oscillations underlie temporal prediction accuracy. Cereb Cortex 25:3077–3085. 10.1093/cercor/bhu103 - DOI - PMC - PubMed
    1. Bastos AM, Usrey WM, Adams RA, Mangun GR, Fries P, Friston KJ (2012) Canonical microcircuits for predictive coding. Neuron 76:695–711. 10.1016/j.neuron.2012.10.038 - DOI - PMC - PubMed
    1. Bastos AM, Litvak V, Moran R, Bosman CA, Fries P, Friston KJ (2015a) A DCM study of spectral asymmetries in feedforward and feedback connections between visual areas V1 and V4 in the monkey. Neuroimage 108:460–475. 10.1016/j.neuroimage.2014.12.081 - DOI - PMC - PubMed

LinkOut - more resources