. 2021 Oct 13;12(1):5989.
doi: 10.1038/s41467-021-26295-8.

Phase separation of Nur77 mediates celastrol-induced mitophagy by promoting the liquidity of p62/SQSTM1 condensates

Affiliations

Phase separation of Nur77 mediates celastrol-induced mitophagy by promoting the liquidity of p62/SQSTM1 condensates

Shuang-Zhou Peng et al. Nat Commun. .

Abstract

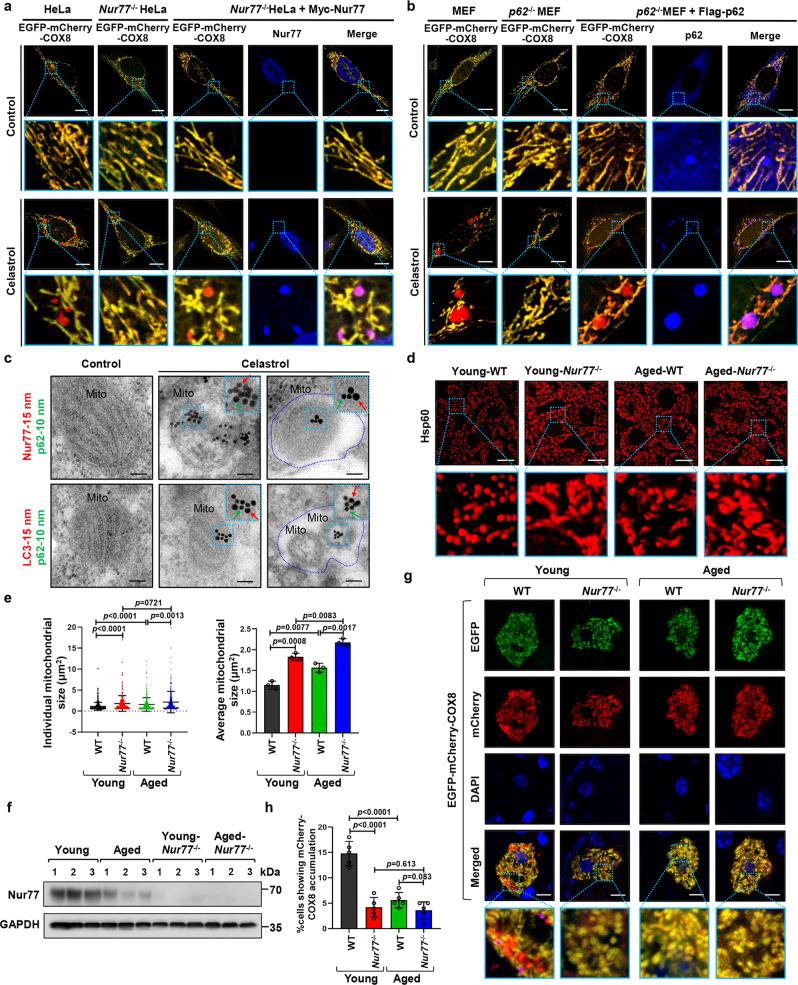
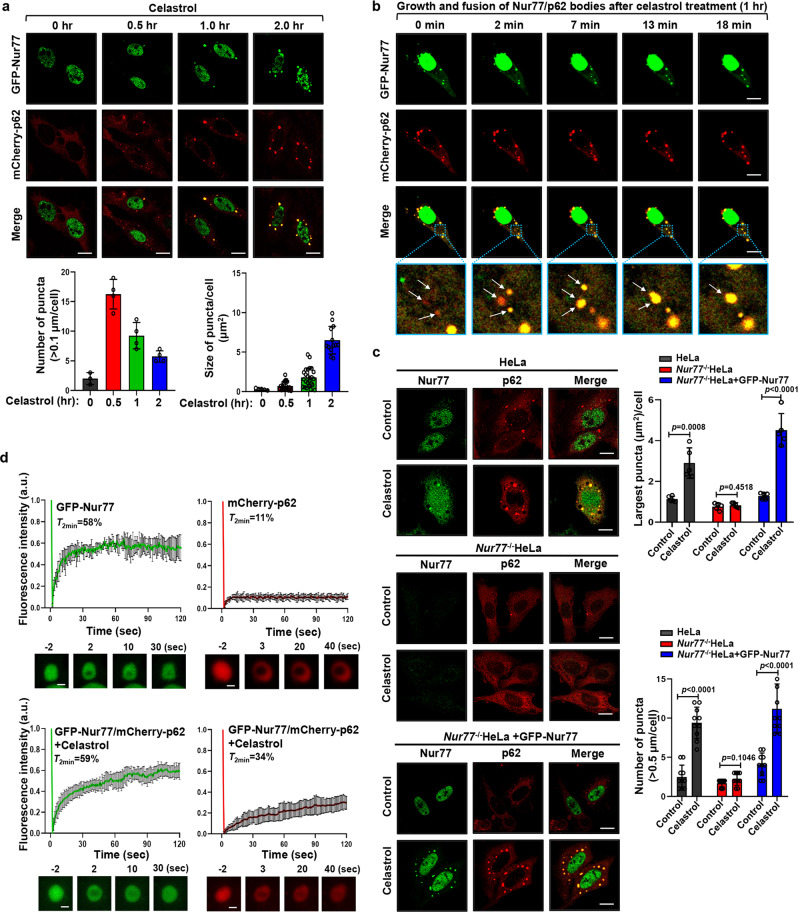
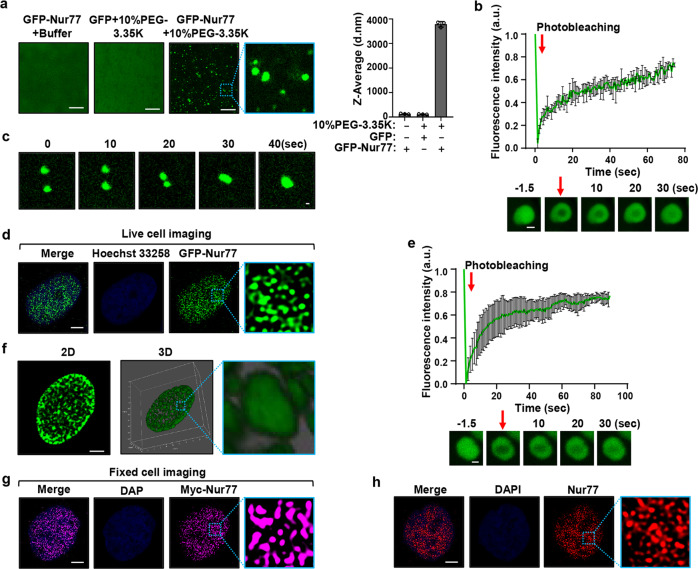
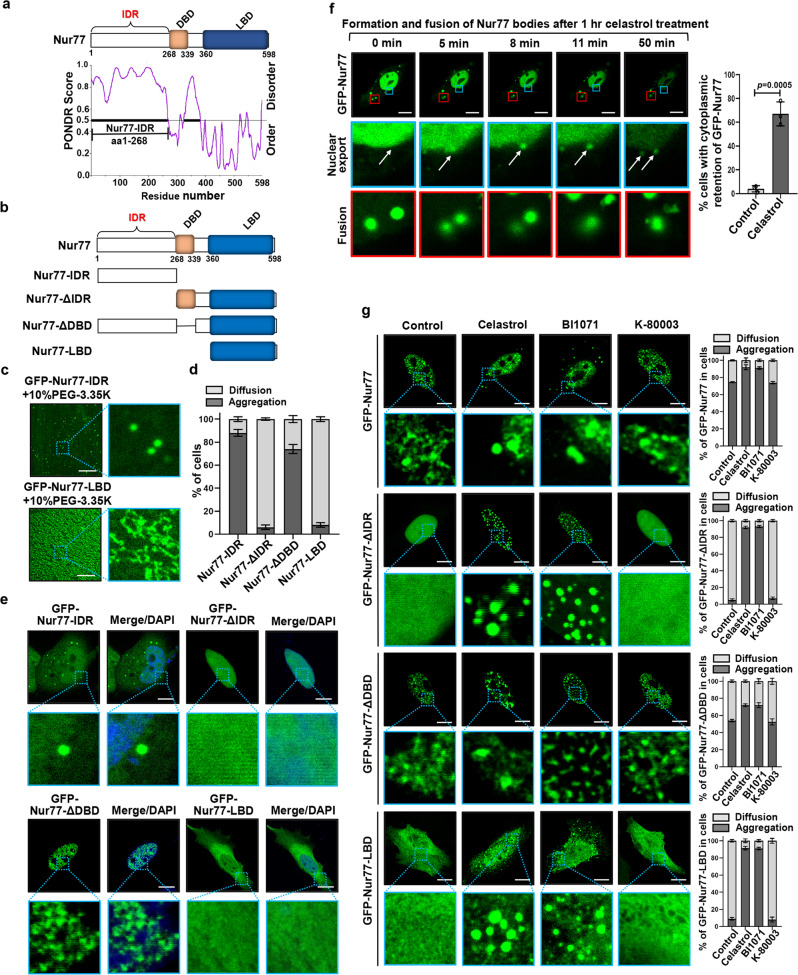
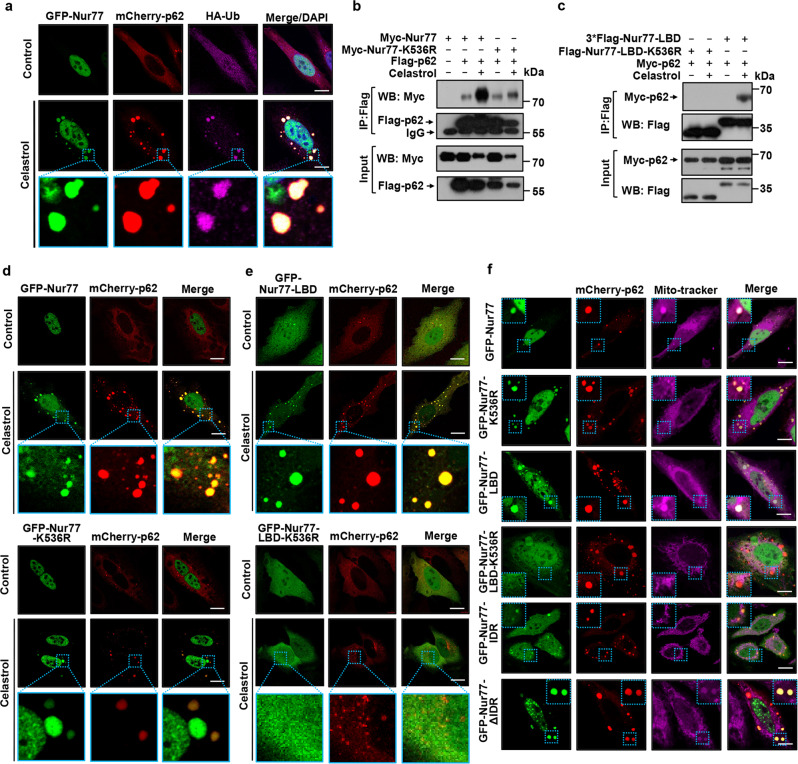
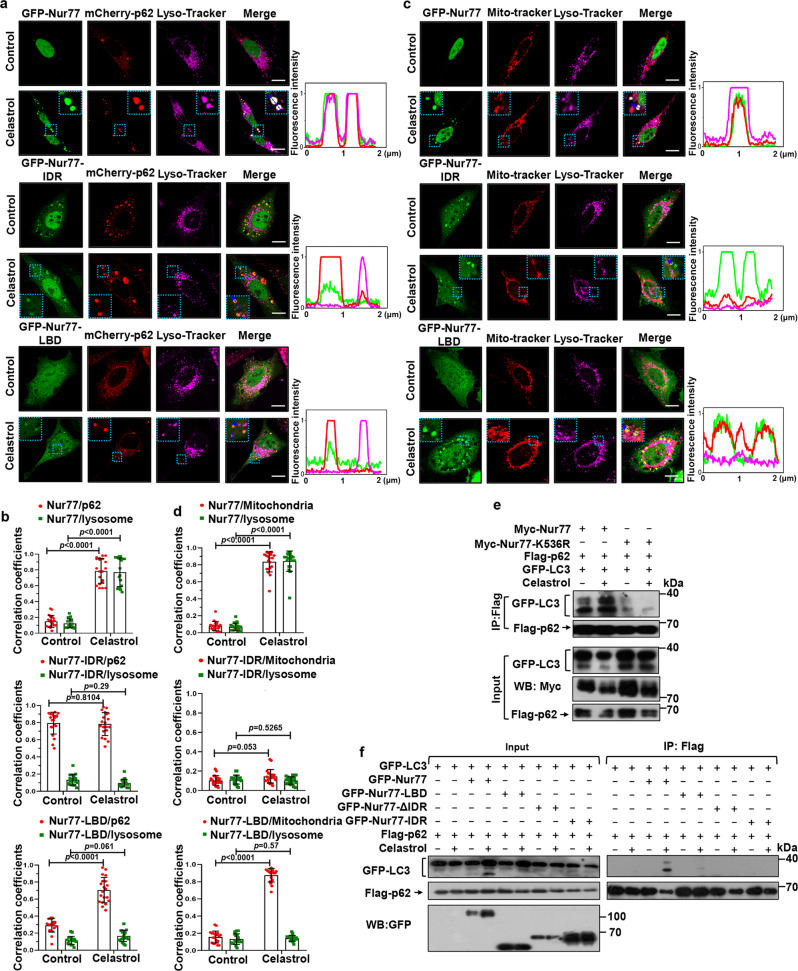
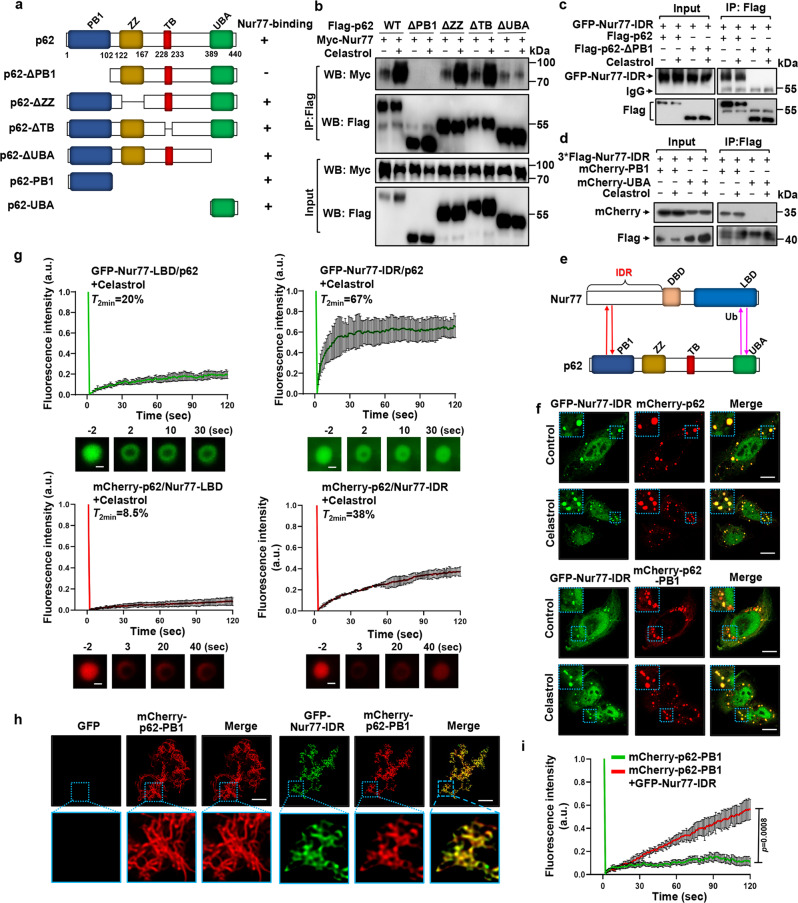
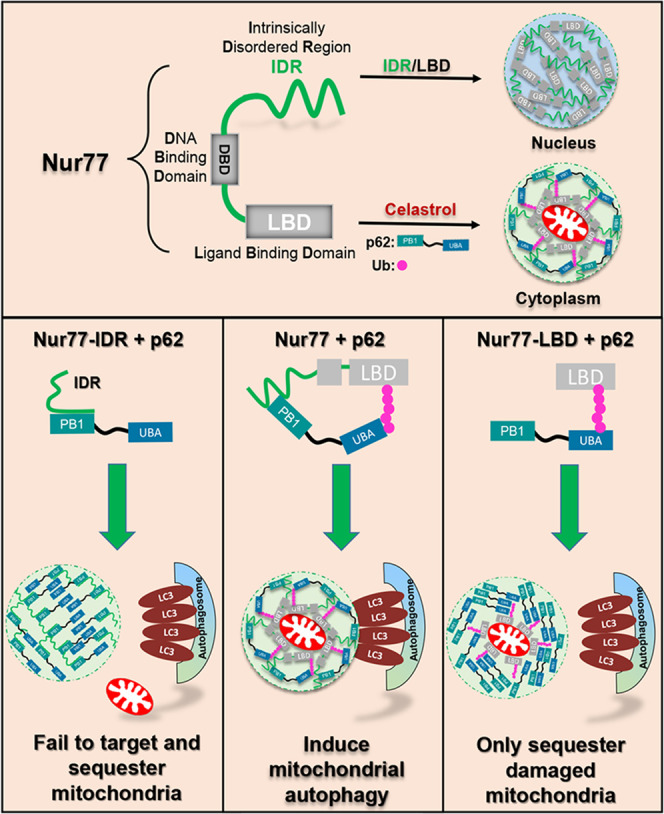
Liquid-liquid phase separation promotes the formation of membraneless condensates that mediate diverse cellular functions, including autophagy of misfolded proteins. However, how phase separation participates in autophagy of dysfunctional mitochondria (mitophagy) remains obscure. We previously discovered that nuclear receptor Nur77 (also called TR3, NGFI-B, or NR4A1) translocates from the nucleus to mitochondria to mediate celastrol-induced mitophagy through interaction with p62/SQSTM1. Here, we show that the ubiquitinated mitochondrial Nur77 forms membraneless condensates capable of sequestrating damaged mitochondria by interacting with the UBA domain of p62/SQSTM1. However, tethering clustered mitochondria to the autophagy machinery requires an additional interaction mediated by the N-terminal intrinsically disordered region (IDR) of Nur77 and the N-terminal PB1 domain of p62/SQSTM1, which confers Nur77-p62/SQSTM1 condensates with the magnitude and liquidity. Our results demonstrate how composite multivalent interaction between Nur77 and p62/SQSTM1 coordinates to sequester damaged mitochondria and to connect targeted cargo mitochondria for autophagy, providing mechanistic insight into mitophagy.


Conflict of interest statement

The authors declare no competing interests.

Figures

Fig. 1
Fig. 1. Nur77 and p62 are required for celastrol-induced mitophagy.
a Representative image of celastrol-induced mitophagy in HeLa, Nur77−/−HeLa, and Nur77−/−HeLa cells transfected with Myc-Nur77 by EGFP-mCherry-COX8 assay as described in Methods. Scale bar, 10 μm. b Representative images of celastrol-induced mitophagy in MEFs and p62−/−MEFs by EGFP-mCherry-COX8 assay as described in Methods. Scale bar, 10 μm. c Colocalization of Nur77, LC3, and p62 with mitochondria within mitophagosome/autolysosome. Upper panel: Electron micrographs of HeLa cells stained with 15 nm immunogold-conjugated Nur77 antibody to detect Nur77 (red), and 10 nm immunogold-conjugated p62 antibody to detect p62 (green). Bottom panel: Electron micrographs of HeLa cells stained with 15 nm immunogold-conjugated LC3 antibody to detect LC3, and 10 nm immunogold-conjugated p62 antibody to detect p62. Cells were treated for 1 h with celastrol. The blue dotted line indicates mitophagosome/autolysosome. Mito mitochondrion, Scale bar, 200 nm. d Representative images showing Hsp60, a mitochondrial marker, in the liver tissue from wild-type and Nur77−/−mice in aging model. Young mice, 8 weeks old. Aged mice, 2 years old. Scale bar, 10 μm. e Statistical analysis of mitochondrial size was represented from liver tissue. Left graph, n = 316, 253, 267, and 287, respectively; Right graph, n = 3 biologically independent samples. A two-tailed unpaired Student’s t-test was used for statistical analysis, and data were presented as mean values ± SEM. f The expression of Nur77 protein in the liver tissue from wild-type and Nur77−/−mice in the aging model. g Representative images of EGFP-mCherry-COX8 in the liver from wild-type or Nur77−/−mice in the aging model. Purple arrows indicate mitophagy. Scale bar, 2 μm. h Quantification of cells showing mCherry-COX8 accumulation on liver tissue. Two-tailed unpaired Student’s t-test was used for statistical analysis, and data were presented as mean values ± SEM (n = 5 mice per group). Data represent at least three independent experiments. Source data are provided as a Source Data file.
Fig. 2
Fig. 2. Celastrol promotes phase separation and liquidity of p62.
a Representative images showing the time-dependent effect on celastrol induction of cytoplasmic Nur77 body formation. Bottom panels: quantitative analysis of the number and size of Nur77/p62 body formation. Bottom left graph, n = 4 biologically independent samples; Bottom right graph, n = 20, 23, 25, and 19, respectively. Data were presented as mean values ± SEM. Scale bar, 10 μm. b Real-time images showing the formation and fusion of GFP-Nur77 and mCherry-p62 droplets in HeLa cells after treatment with celastrol (2 μM) for 1 h. White arrows indicate droplets formation and fusion (see also Supplementary Movie 1). Scale bar, 10 μm. c Representative images illustrating the role of celastrol in promoting p62 body formation in a Nur77-dependent manner immunostaining. Nur77−/−HeLa cells were also transfected with GFP-Nur77 to determine its effect on p62 body formation. The diameter of the biggest p62 puncta in each cell was measured. The number of p62 puncta >0.5 μm in each cell was assessed. A two-tailed unpaired Student’s t-test was used for statistical analysis, and data are presented as mean values ± SEM (n = 5 biologically independent samples). d FRAP analysis of the effect of Nur77 in regulating p62 mobility in HeLa cells. Data were presented as means ± SEM (n = 3 independent experiments). Scale bar, 1.5 μm. Data represent at least three independent experiments. Source data are provided as a Source Data file.
Fig. 3
Fig. 3. Nur77 phase separates into a liquid-like condensate.
a GFP-Nur77 (2 μM) undergoes phase separation. The size of Nur77 droplets was analyzed. Data were presented as mean values ± SEM (n = 3 independent experiments). Scale bar, 10 μm. b Top, changes in fluorescence intensity of GFP-Nur77 droplets after photobleaching were plotted over time. Bottom, representative images of fluorescence recovery. Data were presented as mean values ± SEM (n = 3 independent experiments). Scale bar, 1.5 μm. c Fusion of GFP-Nur77 droplets in 10% PEG-3.35 K. Scale bar, 20 μm. d Live imaging of GFP-Nur77 in HeLa cells. Scale bar, 5 μm. e Time course analysis of GFP-Nur77 nuclear body recovery after photobleaching in HeLa cells. Representative images of fluorescence recovery are shown. Data were presented as mean values ± SEM (n = 3 independent experiments). Scale bar, 1.5 μm. f Three-dimensional (3D) images of Nur77 nuclear assemblies. An enlarged view of inset is also shown. Scale bar, 5 μm. g Fixed imaging of Myc-Nur77 in HeLa cells. Scale bar, 5 μm. h Endogenous Nur77 displays nuclear puncta in HeLa cells revealed by immunostaining with anti-Nur77. Scale bar, 5 μm. Data represent at least three independent experiments. Source data are provided as a Source Data file.
Fig. 4
Fig. 4. Nur77 phase separation is dependent on N-terminal IDR domain.
a Intrinsic disorder tendency of Nur77. IDR intrinsically disordered region, DBD DNA-binding domain, LBD ligand-binding domain. b Schematic representation of Nur77 and its mutants. c In vitro phase separation of GFP-Nur77-IDR and GFP-Nur77-LBD (2 μM). Scale bar, 10 μm. d Quantification of Nur77 mutant droplets formation in absence of celastrol in HeLa cells. Data were presented as mean values ± SEM (n = 3 independent experiments). e Representative images of Nur77 mutant droplets formation in absence of celastrol in HeLa cells. Scale bar, 10 μm. f Representative real-time images showing the formation and fusion of cytoplasmic GFP-Nur77 droplets after treatment with celastrol (2 μM) for 1 h in HeLa cells (see also Supplementary Movie 4). Right: quantification of the cytoplasmic retention of GFP-Nur77 protein. A two-tailed unpaired Student’s t-test was used for statistical analysis, and data were presented as mean values ± SEM (n = 3 independent experiments). Scale bar, 10 μm. g Droplet formation of GFP-Nur77 and mutants in HeLa cells treated with the indicated compounds (2 μM). Left: Representative droplet images of transfected GFP-Nur77 and mutants. An enlarged view of the inset is also shown. Scale bar, 10 μm. Right: Quantification of droplet formation of GFP-Nur77 and mutants. Data represent at least three independent experiments. Source data are provided as Source Data file.
Fig. 5
Fig. 5. Ubiquitinated Nur77 interacts with p62 to sequester damaged mitochondria.
a Immunofluorescence images of GFP-Nur77, mCherry-p62, and HA-Ub transfected in HeLa cells treated with or without celastrol. Data illustrate the colocalization of Nur77 with p62 and Ub in the presence of celastrol. Scale bar, 10 μm. b, c Interaction of indicated Nur77 or deubiquitinated mutant (K536R) and p62 was analyzed in HeLa cells treated with or without celastrol by co-immunoprecipitation (co-IP) assay. d, e Immunofluorescence images showing the effect of celastrol-induced Nur77 ubiquitination on mCherry-p62 droplet formation. Scale bar, 10 μm. f Representative images showing ubiquitination-dependent colocalization of Nur77 with p62 and mitochondria in HeLa cells treated with celastrol. Scale bar, 10 μm. Data represent at least three independent experiments. Source data are provided as Source Data file.
Fig. 6
Fig. 6. Nur77-LBD is insufficient to mediate celastrol-induced mitophagy.
a–d Representative images showing colocalization of Nur77 or mutants with p62, mitochondria, and lysosome in HeLa cells after celastrol treatment. The blue arrow indicates line profiles of fluorescence intensities including Pearson’s correlation coefficients shown in b and d. A two-tailed unpaired Student’s t-test was used for statistical analysis, and data were presented as mean values ± SEM (n = 20 biologically independent samples). Dotted box: higher magnification of indicated region. Scale bar, 10 μm. e Mutating K536 in Nur77 inhibits celastrol-induced interaction between p62 and LC3. HeLa cells transfected with the indicated expression plasmids were treated with or without 2 μM celastrol and 20 ng/mL TNFα. Interaction of Flag-p62 with GFP-LC3 was examined by co-IP assay. f Characterization of domain requirement of Nur77 for promoting celastrol-induced p62 interaction with LC3. HeLa cells transfected with the indicated Flag-p62, GFP-LC3, and GFP-Nur77 or mutant were treated with celastrol and TNFα for 1 h and analyzed for Flag-p62 interaction with GFP-LC3 by co-IP assay. Data represent at least three independent experiments. Source data are provided as Source Data file.
Fig. 7
Fig. 7. IDR interaction with PB1 promotes liquidity of p62 condensates.
a Schematic representation of p62 and mutants and their interaction with Nur77. PB1 Phox/Bem1p protein-protein binding domain. ZZ zinc-finger domain, TB TRAF6 binding domain, UBA ubiquitin-associated domain. bd Interaction of Nur77 and p62, as well as their mutants, was analyzed in HeLa cells treated with or without celastrol by co-IP assay. e Multivalent interaction between Nur77 and p62. The interaction between the IDR of Nur77 and PB1 of P62 is ligand-independent (red), whereas the interaction between LBD of Nur77 and UBA of p62 depends on celastrol that triggers Nur77-LBD ubiquitination (pink). f Immunofluorescence images showing colocalization of GFP-Nur77-IDR with mCherry-p62 or mCherry-p62-PB1 after treatment with or without celastrol. Scale bar, 10 μm. g FRAP analysis of the effect of Nur77-IDR in regulating p62 mobility in HeLa cells. Data were presented as mean values ± SEM (n = 3 independent experiments). Scale bar, 1.5 μm. h Representative images showing the effect of GFP-Nur77-IDR on the filamentous structures of mCherry-p62-PB1 when mCherry-p62-PB1 was incubated with GFP or GFP-Nur77-IDR at intermediate molar ratio (1:2). Scale bar, 10 μm. i FRAP analysis of the effect of GFP-Nur77-IDR on mCherry-p62-PB1 mobility in vitro. Two-tailed unpaired Student’s t-test was used for statistical analysis, and data were presented as mean values ± SEM (n = 3 independent experiments). Data represent at least three independent experiments. Source data are provided as Source Data file.
Fig. 8
Fig. 8. Graphic summary of Nur77 phase separation and its role in celastrol-induced mitophagy by promoting the liquidity of p62 condensates.
The phase separation of Nur77 and p62/SQSTM1 triggered by their multivalent interaction sequesters damaged mitochondria and directs cargo mitochondria to the autophagic machinery. DBD DNA-binding domain, LBD ligand-binding domain, IDR intrinsically disordered region, PB1 Phor and Bem1p, UBA ubiquitin-associating, Ub ubiquitin.

References

    1. Palikaras K, Lionaki E, Tavernarakis N. Mechanisms of mitophagy in cellular homeostasis, physiology and pathology. Nat. Cell Biol. 2018;20:1013–1022. doi: 10.1038/s41556-018-0176-2. - DOI - PubMed
    1. Green DR, Galluzzi L, Kroemer G. Mitochondria and the autophagy-inflammation-cell death axis in organismal aging. Science. 2011;333:1109–1112. doi: 10.1126/science.1201940. - DOI - PMC - PubMed
    1. Villa E, Marchetti S, Ricci JE. No parkin zone: mitophagy without parkin. Trends Cell Biol. 2018;28:882–895. doi: 10.1016/j.tcb.2018.07.004. - DOI - PubMed
    1. Sun N, Youle RJ, Finkel T. The mitochondrial basis of aging. Mol. Cell. 2016;61:654–666. doi: 10.1016/j.molcel.2016.01.028. - DOI - PMC - PubMed
    1. Johansen T, Lamark T. Selective autophagy mediated by autophagic adapter proteins. Autophagy. 2011;7:279–296. doi: 10.4161/auto.7.3.14487. - DOI - PMC - PubMed

Publication types

MeSH terms