Clinical Trial
. 2021 Oct 13;12(1):5958.
doi: 10.1038/s41467-021-26266-z.

Specific gut microbiome signatures and the associated pro-inflamatory functions are linked to pediatric allergy and acquisition of immune tolerance

Affiliations
Clinical Trial

Specific gut microbiome signatures and the associated pro-inflamatory functions are linked to pediatric allergy and acquisition of immune tolerance

Francesca De Filippis et al. Nat Commun. .

Abstract

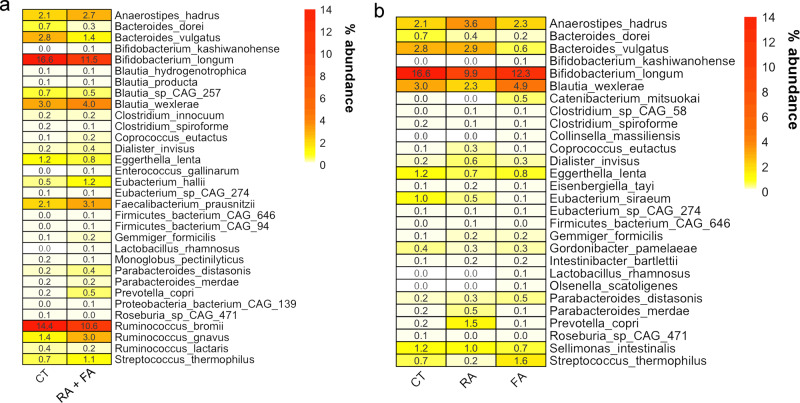
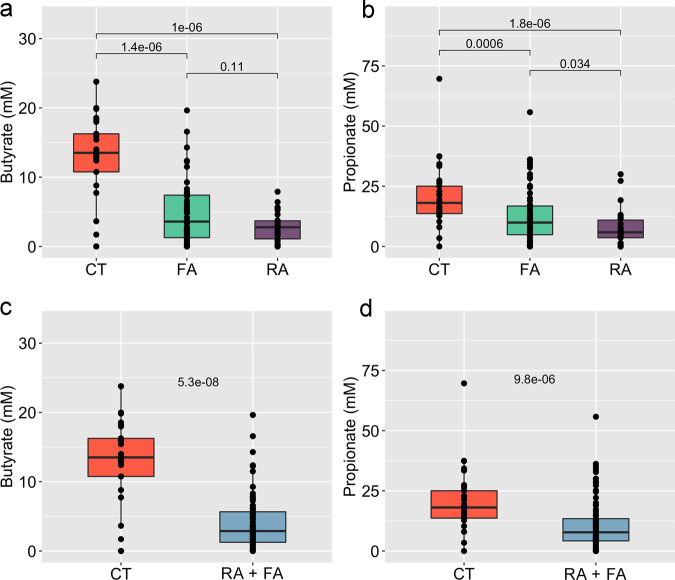
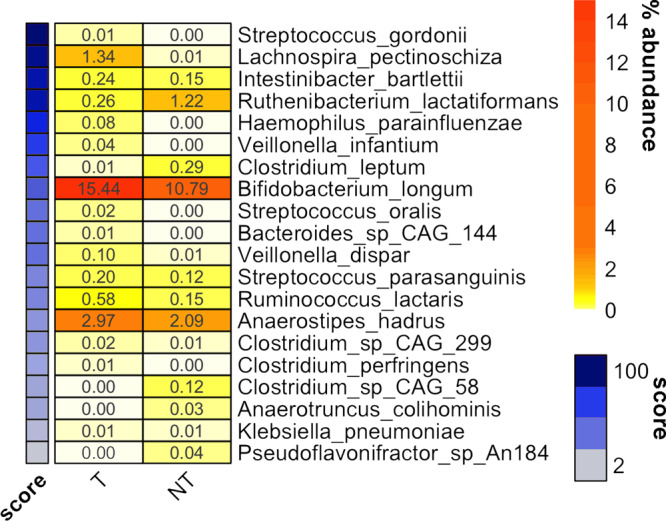
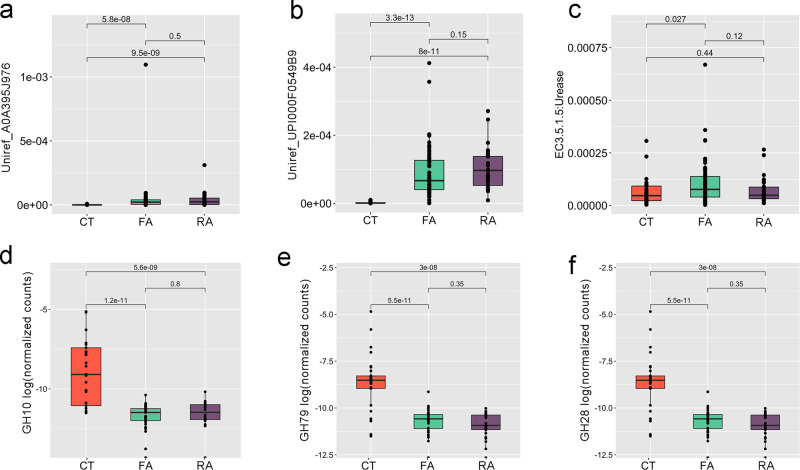
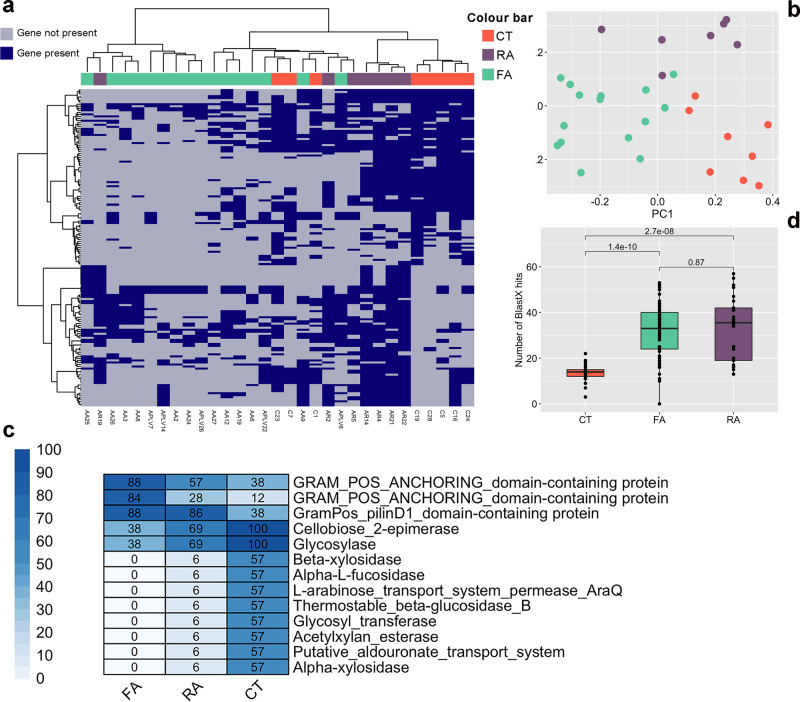
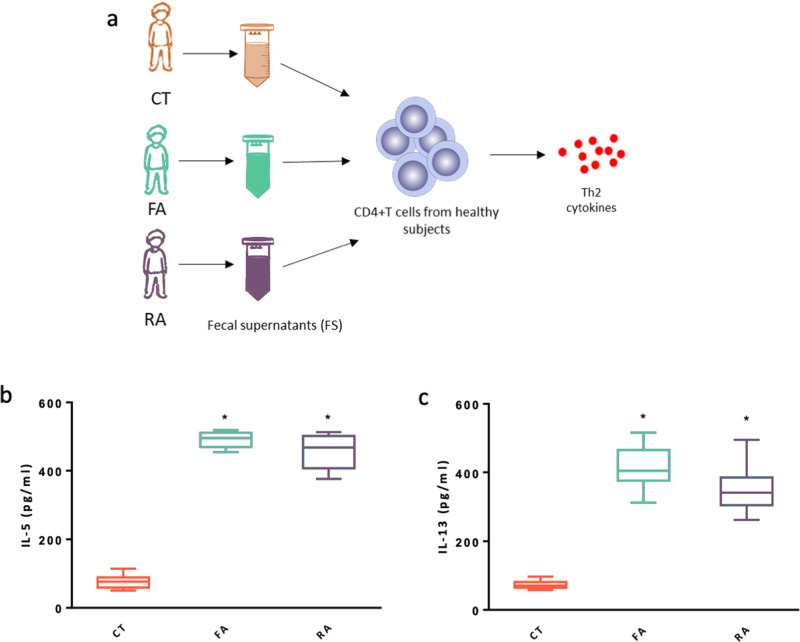
Understanding the functional potential of the gut microbiome is of primary importance for the design of innovative strategies for allergy treatment and prevention. Here we report the gut microbiome features of 90 children affected by food (FA) or respiratory (RA) allergies and 30 age-matched, healthy controls (CT). We identify specific microbial signatures in the gut microbiome of allergic children, such as higher abundance of Ruminococcus gnavus and Faecalibacterium prausnitzii, and a depletion of Bifidobacterium longum, Bacteroides dorei, B. vulgatus and fiber-degrading taxa. The metagenome of allergic children shows a pro-inflammatory potential, with an enrichment of genes involved in the production of bacterial lipo-polysaccharides and urease. We demonstrate that specific gut microbiome signatures at baseline can be predictable of immune tolerance acquisition. Finally, a strain-level selection occurring in the gut microbiome of allergic subjects is identified. R. gnavus strains enriched in FA and RA showed lower ability to degrade fiber, and genes involved in the production of a pro-inflammatory polysaccharide. We demonstrate that a gut microbiome dysbiosis occurs in allergic children, with R. gnavus emerging as a main player in pediatric allergy. These findings may open new strategies in the development of innovative preventive and therapeutic approaches. Trial: NCT04750980.


Conflict of interest statement

The authors declare no competing interests.

Figures

Fig. 1
Fig. 1. Microbial signatures in allergic children gut microbiome.
Heatplot reporting the average relative abundance (%) of microbial taxa significantly different between healthy (CT) and allergic children (a) or healthy children (CT) and children with food (FA) or respiratory (RA) allergies (b), as defined by Wilcoxon test (FDR q < 0.1).
Fig. 2
Fig. 2. Short-chain fatty acids are depleted in the gut of allergic children.
Box plots showing the concentration of butyrate (a, c) and propionate (b, d) in faecal samples of allergic and healthy children. Allergic children are included in a unique group (c, d) or separated according to the type of allergy (a, b). The significance was tested by applying pairwise Wilcoxon test. Data are obtained from n = 29, 55 and 30 biologically independent samples for CT (healthy controls), FA (food allergy) and RA (respiratory allergy), respectively. Boxes represent the interquartile range (IQR) between the first and third quartiles, and the line inside represents the median (2nd quartile). Whiskers denote the lowest and the highest values within 1.5 x IQR from the first and third quartiles, respectively.
Fig. 3
Fig. 3. Gut microbiome features may predict the development of immune tolerance.
Heatplot reporting the average relative abundance (%) of microbial taxa significantly different between food allergy children developing (T) or not (NT) immune tolerance upon 36 months of exclusion diet, as defined by Wilcoxon test (FDR q < 0.1). Taxa are ordered according to the feature importance score from Random Forest classification model, indicated in the side colored bar.
Fig. 4
Fig. 4. Gut microbiome of allergic children shows a higher inflammatory potential and a reduced ability to degrade complex polysaccharides.
Box plots showing the relative abundance of microbial genes involved in lipopolysaccharide biosynthesis (a, b), urea (c) and fiber degradation (df) in healthy (CT), food (FA) and respiratory (RA) allergic children. Data of (ac) are reported as relative abundance (number of reads/total number of reads per sample) from HUMAnN3 analysis; data of (df) are reported as normalized counts [log10 (number of CAZy hits/total number of genes per sample)]. UniRef_ A0A395J976: O-antigen/teichoic acid export membrane protein; UniRef_UPI000F05499B: LPS biosynthesis protein. Boxes represent the interquartile range (IQR) between the first and third quartiles, and the line inside represents the median (2nd quartile). Whiskers denote the lowest and the highest values within 1.5 x IQR from the first and third quartiles, respectively. The significance was tested by applying pairwise Wilcoxon test. Data are obtained from n = 29, 55, and 30 biologically independent samples for CT, FA and RA, respectively.
Fig. 5
Fig. 5. Allergic children harbor a different R. gnavus pangenome.
a Presence and absence of 155 R. gnavus genes significantly different between healthy (CT), food (FA) and respiratory (RA) allergic children (blue, present; gray, absent). The significance was tested by applying paired chi-squared tests. b Principal coordinates analysis based on presence/absence of the 155 significant genes. c Heatplot showing the prevalence (%) of selected significant genes in the three children groups (CT, healthy controls; FA, food allergy; RA, respiratory allergy). The complete list of the 155 significant genes and their prevalence is reported in Supplementary Data 2. d Box plots showing the number of hits (> 90% identity over 50% of query length) against R. gnavus genes involved in the production of a pro-inflammatory polysaccharide. Boxes represent the interquartile range (IQR) between the first and third quartiles, and the line inside represents the median (2nd quartile). Whiskers denote the lowest and the highest values within 1.5 x IQR from the first and third quartiles, respectively. The significance was tested by applying pairwise Wilcoxon test. Data are obtained from n = 29, 55, and 30 biologically independent samples for CT (healthy controls), FA (food allergy) and RA (respiratory allergy), respectively.
Fig. 6
Fig. 6. Fecal supernatants from FA and RA children elicit a pro-allergic Th2 cytokines response in human CD4+ T cells.
As depicted in the figure, peripheral blood CD4+ T cells from healthy children (n = 3) were exposed to fecal supernatants obtained from fecal samples collected from CT, FA and RA subjects (n = 3/group) (a). Stimulation for 24 h with 100 µl (optimal dose) of fecal supernantants obtained from FA and RA patients, but not with fecal supernatants from CT, induced a significant increase in IL-5 (b) and IL-13 (c) production by CD4+ T cells. Each fecal supernatant was tested in triplicate on three different peripheral blood CD4+ T cells samples. Data are expressed as mean ± standard deviation. *p = 0.0001, as defined by paired t-test comparing CT vs FA and CT vs RA. (a) was generated using GraphPad Prism v. 7.0.

References

    1. Loh W, Tang MLK. The epidemiology of food allergy in the global context. Int J. Environ. Res. Public Health. 2018;15:2043. doi: 10.3390/ijerph15092043. - DOI - PMC - PubMed
    1. Berni Canani R, et al. Gut microbiome as target for innovative strategies against food allergy. Front Immunol. 2019;10:191. doi: 10.3389/fimmu.2019.00191. - DOI - PMC - PubMed
    1. Pascal M, et al. Microbiome and allergic diseases. Front Immunol. 2018;9:1584. doi: 10.3389/fimmu.2018.01584. - DOI - PMC - PubMed
    1. Plunkett CH, Nagler CR. The influence of the microbiome on allergic sensitization to food. J. Immunol. 2017;198:581–589. doi: 10.4049/jimmunol.1601266. - DOI - PMC - PubMed
    1. Barcik W, Boutin RCT, Sokolowska M, Finlay BB. The role of lung and gut microbiota in the pathology of asthma. Immunity. 2020;52:241–255. doi: 10.1016/j.immuni.2020.01.007. - DOI - PMC - PubMed

Publication types

MeSH terms

Supplementary concepts

Associated data