. 2021 Oct 13;12(1):5962.
doi: 10.1038/s41467-021-26263-2.

Disordered breathing in a Pitt-Hopkins syndrome model involves Phox2b-expressing parafacial neurons and aberrant Nav1.8 expression

Affiliations

Disordered breathing in a Pitt-Hopkins syndrome model involves Phox2b-expressing parafacial neurons and aberrant Nav1.8 expression

C M Cleary et al. Nat Commun. .

Abstract

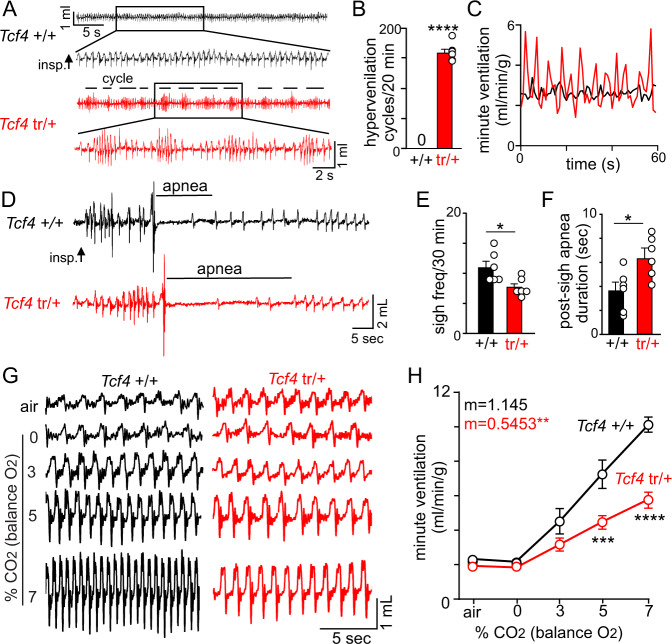
Pitt-Hopkins syndrome (PTHS) is a rare autism spectrum-like disorder characterized by intellectual disability, developmental delays, and breathing problems involving episodes of hyperventilation followed by apnea. PTHS is caused by functional haploinsufficiency of the gene encoding transcription factor 4 (Tcf4). Despite the severity of this disease, mechanisms contributing to PTHS behavioral abnormalities are not well understood. Here, we show that a Tcf4 truncation (Tcf4tr/+) mouse model of PTHS exhibits breathing problems similar to PTHS patients. This behavioral deficit is associated with selective loss of putative expiratory parafacial neurons and compromised function of neurons in the retrotrapezoid nucleus that regulate breathing in response to tissue CO2/H+. We also show that central Nav1.8 channels can be targeted pharmacologically to improve respiratory function at the cellular and behavioral levels in Tcf4tr/+ mice, thus establishing Nav1.8 as a high priority target with therapeutic potential in PTHS.


Conflict of interest statement

The authors declare no competing interests.

Figures

Fig. 1
Fig. 1. Survival and locomotor abnormalities exhibited by Tcf4tr/+ mice.
A Mouse images and summary data show that Tcf4tr/+ and Tcf4tr/tr mice are smaller and weigh less early in development compared to Tcf4+/+ control mice (day 3: F2,27 = 56.86, p < 0.0001; day 20: T28 = 3.378, p = 0.0022, data are presented as mean values ± SEM); however, by 44 days of age Tcf4tr/+ and Tcf4+/+ are of similar size (n = 30 animals/15 each genotype, T28 = 0.6590, p > 0.05, paired t-test, data are presented as mean values ± SEM). B Survival curves show that ~30% of Tcf4tr/tr mice are born dead and reach 100% lethality by 4 days of age. Tcf4tr/+ also exhibit early high mortality but those reaching weaning age tended to survive at least two months. C Representative locomotor activity maps of Tcf4+/+ and Tcf4tr/+ mice (40–50 days of age) during a 30-min periods following placement in a novel open field arena. D, E summary data show that Tcf4tr/+ traveled further (D n = 15 biologically independent animals, mixed sex, T14 = 4.008, p = 0.0013, paired t-test, data are presented as mean values ± SEM) and more frequently entered the center region (middle 50% of total area) (E n = 15 biologically independent animals, mixed sex, T14 = 2.559, p = 0.0227, paired t-test, data are presented as mean values ± SEM) compared to Tcf4+/+. Asterisk (*) indicate different between genotypes (unpaired t-test). One symbol = p < 0.05, two symbols = p < 0.01, three symbols = p < 0.001, four symbols = p < 0.0001.
Fig. 2
Fig. 2. Tcf4tr/+ mice exhibit unstable breathing under baseline conditions and a blunted ventilatory response to CO2.
A Traces of respiratory activity show that under room air conditions Tcf4tr/+ mice exhibit frequent cycles (designated by a horizontal line) of hyperventilation followed by a period of reduced respiratory activity. Note that this pattern of activity was not observed in Tcf4+/+ mice. B summary plot showing the number of hyperventilation cycles that occurred over 20 min; Tcf4tr/+ mice ranged from 5.9 to 9.1 cycles/min. (N = 6 biologically independent animals/genotype, T5 = 25.31, p < 0.0001, one sample t-test, data are presented as mean values ± SEM). C Traces of minute ventilation (same animals as A) show the unstable periodic nature of respiratory activity exhibited by Tcf4tr/+ mice compared to control. D Traces of respiratory activity under room air conditions from a Tcf4+/+ and Tcf4tr/+ mouse show examples of post-sigh apnea in each genotype. E, F Summary data show that under room air conditions Tcf4tr/+ mice exhibited less frequent sighs (E n = 6 biologically independent animals/genotype, T10 = 2.774, p = 0.0197, data are presented as mean values ± SEM) and longer duration post-sigh apnea (F n = 6 biologically independent animals/genotype, T10 = 2.490, p = 0.0344, data are presented as mean values ± SEM) compared to Tcf4+/+ mice. G Traces of respiratory activity from a Tcf4+/+ and Tcf4tr/+ mouse in room air and during exposure to 0–7% CO2 (balance O2). H Plot of minute ventilation shows that Tcf4tr/+ mice have a severely blunted CO2/H+ response compared to control mice (n = 5 biological independent animals/genotype, F1,4 = 22.22, p = 0.0092, data are presented as mean values ± SEM). Asterisk (*) indicate the different between genotypes (t-test or two-way ANOVA followed by Tukey’s multiple comparison test). Linear regressions were compared by two-tailed analysis of covariance (ANCOVA). One symbol = p < 0.05, two symbols = p < 0.01, three symbols = p < 0.001, four symbols = p < 0.0001.
Fig. 3
Fig. 3. Hypercapnia fails to stimulate active expiration in anesthetized Tcf4tr/+ mice.
Diaphragm and abdominal EMG activity was measured in isoflurane (1.5%) anesthetized Tcf4+/+ and Tcf4tr/+ (50 days old) during exposure to graded increases in CO2. A Traces of raw and integrated (∫) diaphragm and abdominal EMG activity show that Tcf4+/+ mice treated with saline (30 µL; I.P.) respond to 5 and 7% CO2 with proportional increases in DiaEMG and AbdEMG activity. Conversely, saline (30 µL; I.P.) treated Tcf4tr/+ mice show a diminished DiaEMG response to CO2 and completely lacked AbdEMG activity, even at 7% CO2. Systemic (I.P.) administration of PF-04531083 (40 mg/kg) increased CO2-dependent DiaEMG but not AbdEMG activity in Tcf4tr/+ mice. B, C Summary data show effects of CO2 on DiaEMG amplitude (B F2,10 = 40.74, p < 0.0001, two-way ANOVA) and frequency (C F2,10 = 27.96, p < 0.0001, two-way ANOVA) in Tcf4+/+ and Tcf4tr/+ mice (n = 6 biologically independent animals/genotype, data are presented as mean values ± SEM). D, E summary data show effects of CO2 on AbdEMG amplitude (D F2,10 = 145.0, p < 0.0001, two-way ANOVA) and frequency (E F2,10 = 655.4, p < 0.0001, two-way ANOVA) in Tcf4+/+ and Tcf4tr/+ mice (n = 6 biologically independent animals/genotype, data are presented as mean values ± SEM). These results are consistent with anatomical evidence that Phox2b+ neurons in the lateral parafacial region are severely depleted in Tcf4tr/+ mice, and the possibility that these cells are a key determinant of expiratory activity (i.e., function as expiratory pFL neurons). Asterisk (*) indicate the different from 0% CO2 within condition; #, different between genotypes/conditions. One symbol = p < 0.05, two symbols = p < 0.01, three symbols = p < 0.001, four symbols = p < 0.0001 (two-way RM-ANOVA with Tukey’s multiple comparison test).
Fig. 4
Fig. 4. Morphological and projection abnormalities of Phox2b+ parafacial neurons in Tcf4tr/+ mice.
A Left side, t-distributed stochastic neighbor embedding (t-SNE) plot shows the single-cell transcriptome for ventral parafacial neurons; cell types that co-express both Slc17a6 and Phox2b are color coded by cluster (cluster 1 is blue, cluster 2 is orange, and cluster 3 is green). Middle, UMAP plots showing expression of Tcf4 (top) and Atoh1 (bottom) in sub-clusters of Slc17a6+ and Phox2b+ neurons. Right, violin plots show cluster-specific differential gene expression (gene expression from 0 to 4 counts/cell is on the y-axis). Clusters 1–2 are putative RTN chemoreceptors based on expression of Phox2b, Nmb, Gpr4, and Kcnk5. Cluster 3 shows a profile consistent with C1 pre-sympathetic neurons including tyrosine hydroxylase (Th) and Phox2b but not Gpr4, Kcnk5, or Nmb. Tcf4 is expressed by clusters 1–3 but only co-localized with Atoh1 in clusters 1–2. B Coronal sections from a Tcf4+/+ mouse show parafacial neurons that express Tcf4 transcripts (cyan) and Atoh1 transcripts (yellow). Right, summary of fluorescent in situ hybridization results (n = 3, 12 days of postnatal) show that 89% of Tcf4 labeling in the parafacial region co-localized with Atoh1 labeling (green indicates co-labeled Tcf4 and Atoh1 cells, yellow indicates Tcf4 transcript only). C Photomicrographs of coronal sections from a Tcf4+/+ and Tcf4tr/+ mouse show Phox2b-immunoreactivity (Phox2b-IR, red) in the caudal (top) and rostral (bottom) parafacial regions (values denote distance behind bregma, co-localized with blue DAPI signal). Regions of interest penetrated ~75 µm dorsally from the ventral surface and spanned 600 µm medially from the trigeminal, the lateral most 150 µm was considered the pFL. Right: Summary data (n = 3 mice/genotype) show the distribution of Phox2b-IR soma across the caudal to rostral (y axis; eight slices total per animal) and medial to lateral (x-axis) extent of the parafacial region. D Summary data show that Phox2b-IR is diminished in the pFL (T4 = 8.510, p = 0.0010) and to a lesser extent in the RTN (T4 = 5.439, p = 0.0055) from Tcf4tr/+ mice (n = 5 biologically independent animals/genotype, data are presented as mean values ± SEM). Also note that Phox2b-IR neurons tended to clump in the medial parafacial region of Tcf4tr/+ (arrow). E, AAV2-Ef1α-DIO-hChR2(H134R)-EYFP was injected bilaterally into the medial parafacial region of Phox2bCre::Ai14::Tcf4+/+ (control) and Phox2bCre::Ai14::Tcf4tr/+ mice and labeled puncta were imaged in the pre-BötC. Photomicrographs and summary data (F, left) (n = 3 mice/genotype) show in control tissue that most (97%) green-labeled puncta make close associations with Sst-IR (purple in images and pie chart) pre-BötC neurons. Conversely, tissue from Phox2bCre::Ai14::Tcf4tr/+ mice shows the opposite labeling pattern; 96% of green-labeled puncta (bottom) do not co-localize with Sst-labeled pre-BötC neurons (F right, gray area in pie chart). **p < 0.01 (unpaired t-test).
Fig. 5
Fig. 5. Chemosensitive RTN neurons in slices from Tcf4tr/+ mice show reduced CO2/H+ sensitivity at the cellular and synaptic levels.
A, B Traces of firing rate and segments of holding current from chemosensitive RTN neurons in slices from control (A) and Tcf4tr/+ (B) mice show typical levels of activity for each genotype under control conditions (5% CO2, pH 7.3) and during exposure to 10% CO2 (pH 7.0). Inset, double-immunolabeling shows that a Lucifer Yellow-filled CO2/H+ sensitive neuron (green) in a slice from a Tcf4tr/+ mouse is immunoreactive for Phox2b (cyan). We confirmed that 6/6 CO2/H+ activated neurons in slices from Tcf4tr/+ mice are Phox2b-IR. Scale bar = 25 µm. C, D Summary data (n = 13 cells/genotype) shows that RTN chemoreceptors in slices from Tcf4tr/+ exhibit normal activity under baseline conditions (C n = 13 cells/genotype, eight biologically independent animals/genotype, T24 = 0.3118, p > 0.05, data are presented as mean values ± SEM) but have a reduced firing response to 10% CO2 (D n = 9 cells/genotype, five biologically independent animals/genotype, T17 = 2.378, p = 0.0294, data are presented as mean values ± SEM). E Traces of holding current (Ihold = −60 mV) from chemosensitive RTN neurons in slices from Tcf4+/+ and Tcf4tr/+ mice shows spontaneous excitatory synaptic current (sEPSC) events under control conditions and during exposure to 10% CO2 or CNQX (10 µM). F, G summary (n = 8 cells/genotype, five biologically independent animals/genotype, data presented as mean values ± SEM) cumulative distribution plots of sEPSC inter-event interval (bin size: 250 ms) and bar graphs of mean sEPSC frequency under each experimental condition show that sEPSC frequency was diminished in Tcf4tr/+ under control conditions (T15 = 2.417, p = 0.0289) and during exposure to 10% CO2 (T15 = 3.126, p = 0.0061) compared to control. H, I Cumulative distribution plots of sEPSC amplitude (bin size: 5 pA) and bar graphs of mean sEPSC amplitude under each condition show that CO2 minimally affects sEPSC amplitude in either genotype (control: n = 10 biologically independent animals, F2,25 = 0.042, p > 0.05, Tcf4tr/+: n = 9 biologically independent animals, F2,25 = 0.386, p > 0.05, data are presented as mean values ± SEM). *p < 0.05, **p < 0.01 (paired t-test for comparison in D and paired one-way ANOVA for FI).
Fig. 6
Fig. 6. Pharmacological blockade of Nav1.8 increases baseline activity and CO2/H+-sensitivity of RTN chemoreceptors in slices from Tcf4tr/+.
A Trace of firing rate and segments of holding current from chemosensitive RTN neuron in a slice from a Tcf4tr/+ mouse shows that bath application of PF-04531083 (abbreviated PF-04; 1 µM) increased baseline activity and the firing response to 10% CO2. B, C Summary data (n = 7 cells) shows that PF-04531083 increased baseline activity by ~1 Hz (B) (T6 = 5.729, p = 0.0012, data are presented as mean values ± SEM) and nearly doubled the firing response to CO2 (C) (T6 = 3.669, p = 0.0105, data are presented as mean values ± SEM). Asterisk (*) indicate different from control at p < 0.05 (one symbol) or p < 0.01 (two symbols) (paired t-test).
Fig. 7
Fig. 7. Systemic application of a Nav1.8 blocker improved baseline breathing in Tcf4tr/+ mice.
For these experiments we characterized respiratory activity in Tcf4+/+ and Tcf4tr/+ mice ~1.5 h after systemic (I.P.) administration of saline (30 µL) or PF-04531083 (abbreviated PF-04; 40 mg/kg, a selective Nav1.8 channel blocker that crosses blood brain barrier). A Traces of respiratory activity under room air conditions show that Tcf4tr/+ mice that received PF-04531083 (orange) exhibit fewer cycles of hyperventilation (designated by a horizontal line) compared to those that received saline (red). Conversely, control mice showed stable respiratory activity following injections of saline (black) or PF-04531083 (gray). B Traces of minute ventilation (same animals as A) show the pattern of respiratory activity after saline or PF-04531083 injections. Note that PF-04531083 stabilized breathing in Tcf4tr/+ compared to saline. C Summary plot shows that PF-04531083 treatment decreased the number of hyperventilation cycles exhibited by Tcf4tr/+ mice (n = 6 biologically independent animals/genotype, T5 = 5.168, p = 0.0036, data are presented as mean values ± SEM). DF Respiratory traces (D) and summary data show that PF-04531083 increased sigh frequency (E n = 6 biologically independent animals/genotype, T5 = 2.825, p = 0.0369, data are presented as mean values ± SEM) and reduced the duration of post-sigh apnea (F n = 6 biologically independent animals/genotype, T5 = 4.885, p = 0.0045, data are presented as mean values ± SEM) in Tcf4tr/+ under room air conditions. Asterisk (*) indicate the difference between genotypes (unpaired t-test) at p < 0.05 (one symbol) or p < 0.01 (two symbols).
Fig. 8
Fig. 8. Central Nav1.8 channels can be targeted to improve CO2/H+-dependent respiratory activity in Tcf4tr/+ mice.
A Traces of respiratory activity from saline (black) or PF-04531083 (gray) treated Tcf4+/+ and saline (red) or PF-04531083 (orange) treated Tcf4tr/+ mice during exposure to room air, 100% O2 and 3–7% CO2 (balance O2). B Summary plots of minute ventilation show that PF-04531083 improved CO2-dependent respiratory output in Tcf4tr/+ mice (0–7% CO2 slope: 0.59 ± 0.08 saline vs. 0.79 ± 0.10 PF-04531083; n = 5 biologically independent animals, p = 0.0314, data are presented as mean values ± SEM) to a level not different from Tcf4+/+ mice (0–7% CO2 slope: 1.11 ± 0.1; n = 5 biologically independent animals, p > 0.05, data are presented as mean values ± SEM). C Summary plots of minute ventilation show that systemic application of PF-06305591 (2 mg/kg, a selective Nav1.8 channel blocker that does not readily cross the blood brain barrier) minimally effected respiratory activity in both genotypes (0–7% CO2 slope: 0.56 ± 0.06 saline vs. 0.50 ± 0.09 PF-06305591; n = 5 biologically independent animals/genotype, p > 0.05, data are presented as mean values ± SEM) (Tcf4tr/+ mice injected with Pf-06305591 are indicated with blue). D Traces of raw and integrated (∫) diaphragm and abdominal EMG activity show that Tcf4tr/+ mice treated with saline (30 µL; I.P.) show a diminished DiaEMG response to CO2 and completely lacked AbdEMG activity, even at 7% CO2. Systemic (I.P.) administration of PF-04531083 (40 mg/kg) increased CO2-dependent DiaEMG but not AbdEMG activity in Tcf4tr/+ mice. E, F Summary data show effects of CO2 on DiaEMG amplitude (E n = 6 biologically independent animals/genotype, data are presented as mean values ± SEM) and frequency (F n = 6 biologically independent animals/genotype, data are presented as mean values ± SEM) in Tcf4tr/+ mice that received saline or PF-04531083. These results are entirely consistent with the respiratory phenotype exhibited by awake Tcf4tr/+ mice under control conditions and after PF-04531083 treatment (Fig. 7). Asterisk (*) indicate the different between genotypes; #, used to distinguish difference between PF-04531083 injected mice of both genotypes. ^, different from 0% CO2 within condition (DiaEMG). One symbol = p < 0.05, two symbols = p < 0.01, three symbols = p < 0.001, four symbols = p < 0.0001 (two-way RM-ANOVA with Tukey’s multiple comparison test).
Fig. 9
Fig. 9. Central Nav1.8 channels can be targeted to improve locomotor abnormalities in Tcf4tr/+ mice.
A Locomotor activity maps from Tcf4+/+ and Tcf4tr/+ mice treated with saline, PF-04531083, or PF-06305591, movement was recorded for 30 min following placement in a novel open field arena. B Summary plots for distance traveled over 30 min depicts Tcf4+/+ mice injected with PF-04531083 (black) or PF-06305591 (gray) and Tcf4tr/+ mice injected with PF-04531083 (orange) or PF-06305591 (blue). These data show that Tcf4tr/+ treated with PF-04531083 exhibited locomotor activity similar to Tcf4+/+ (n = 8 biologically independent animals/genotype, T14 = 1.452, p > 0.05, data are presented as mean values ± SEM), whereas those that received PF-06305591 remained hyperactive compared to either experimental group (n = 8 biologically independent animals/genotype, T14 = 5.492, p < 0.0001, data are presented as mean values ± SEM). Note that PF-04531083 minimally affected respiratory or locomotor activity in control mice. Asterisk (*) indicate the different between injected mice of the same genotype (unpaired t-test). One symbol = p < 0.05, two symbols = p < 0.01, three symbols = p < 0.001, four symbols = p < 0.0001.

References

    1. Sweatt JD. Pitt-Hopkins syndrome: intellectual disability due to loss of TCF4-regulated gene transcription. Exp. Mol. Med. 2013;45:e21. doi: 10.1038/emm.2013.32. - DOI - PMC - PubMed
    1. de Winter CF, et al. Phenotype and natural history in 101 individuals with Pitt-Hopkins syndrome through an internet questionnaire system. Orphanet J. Rare Dis. 2016;11:37. doi: 10.1186/s13023-016-0422-2. - DOI - PMC - PubMed
    1. Goodspeed K, et al. Pitt-Hopkins syndrome: a review of current literature, clinical approach, and 23-patient case series. J. Child Neurol. 2018;33:233–244. doi: 10.1177/0883073817750490. - DOI - PMC - PubMed
    1. Marangi G, Zollino M. Pitt-Hopkins syndrome and differential diagnosis: a molecular and clinical challenge. J. Pediatr. Genet. 2015;4:168–176. doi: 10.1055/s-0035-1564570. - DOI - PMC - PubMed
    1. Hasi M, et al. The role of the TCF4 gene in the phenotype of individuals with 18q segmental deletions. Hum. Genet. 2011;130:777–787. doi: 10.1007/s00439-011-1020-y. - DOI - PMC - PubMed

Publication types

MeSH terms

Supplementary concepts