. 2021 Oct 13;11(1):20281.
doi: 10.1038/s41598-021-99838-0.

The network interplay of interferon and Toll-like receptor signaling pathways in the anti-Candida immune response

Affiliations

The network interplay of interferon and Toll-like receptor signaling pathways in the anti-Candida immune response

Ranieri Coelho Salgado et al. Sci Rep. .

Abstract

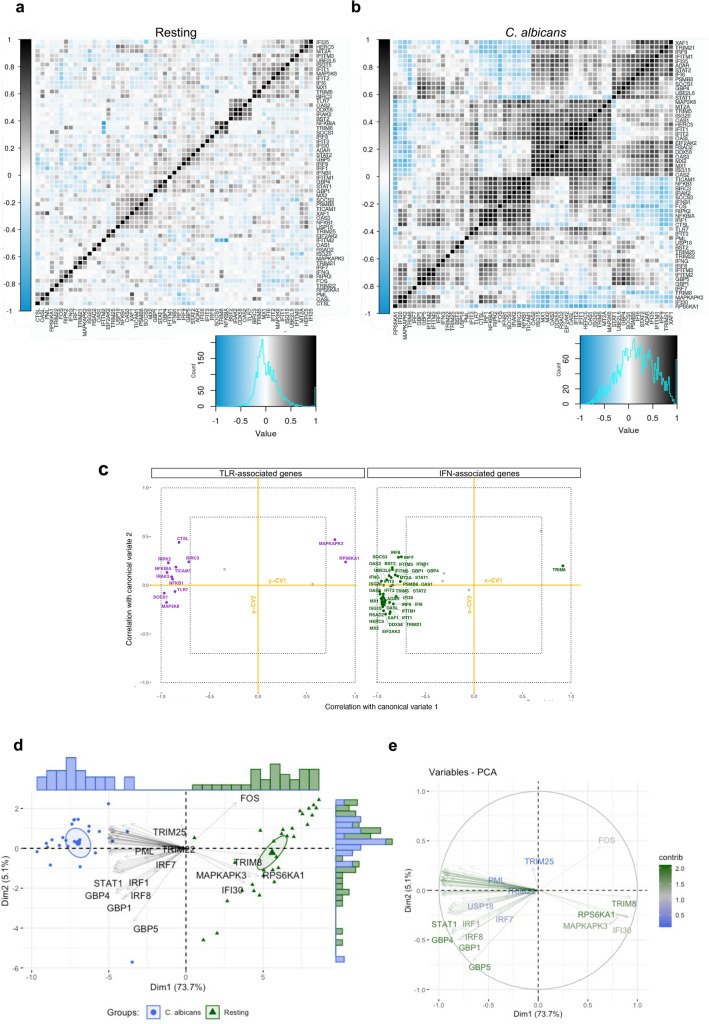
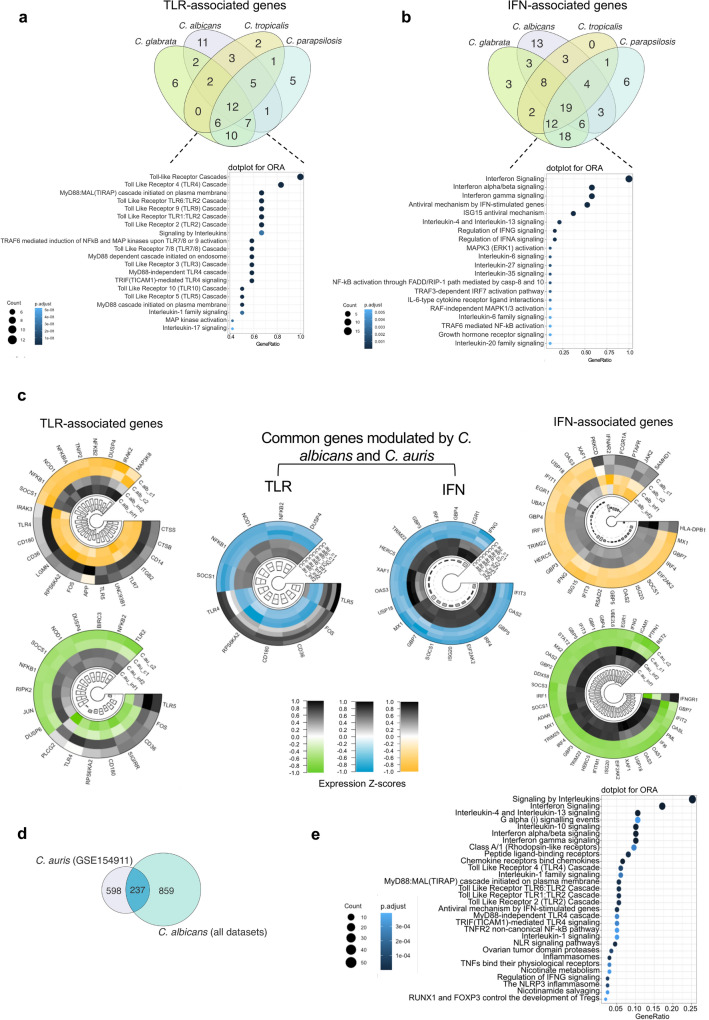
Fungal infections represent a major global health problem affecting over a billion people that kills more than 1.5 million annually. In this study, we employed an integrative approach to reveal the landscape of the human immune responses to Candida spp. through meta-analysis of microarray, bulk, and single-cell RNA sequencing (scRNA-seq) data for the blood transcriptome. We identified across these different studies a consistent interconnected network interplay of signaling molecules involved in both Toll-like receptor (TLR) and interferon (IFN) signaling cascades that is activated in response to different Candida species (C. albicans, C. auris, C. glabrata, C. parapsilosis, and C. tropicalis). Among these molecules are several types I IFN, indicating an overlap with antiviral immune responses. scRNA-seq data confirmed that genes commonly identified by the three transcriptomic methods show cell type-specific expression patterns in various innate and adaptive immune cells. These findings shed new light on the anti-Candida immune response, providing putative molecular pathways for therapeutic intervention.


Conflict of interest statement

The authors declare no competing interests.

Figures

Figure 1
Figure 1
Multilayered induction of TLR and IFN signaling pathways in response to C. albicans. (a), UMAP visualization of scRNAseq profiles colored according to cell cluster. (b) and (c), UMAP of resting and C. albicans-activated cell groups. DEGs, differentially expressed genes; IFN, interferon; ORA, overrepresentation analysis; scRNAseq, single-cell RNA sequencing; TLR, Toll-like receptor; UMAP, uniform manifold approximation and projection. (d), Dot plot showing pathways associated with the immune response to C. albicans, as obtained by ORA of DEGs. (e), Coexpression modules significantly enriched (M1-M11, and M13) in PBMCs (resting n = 30; C. albicans infected n = 24; dataset GSE42606). (f) and (g) Network representation of M1 and M2 with hubs (most connected genes) colored based on coexpression (blue color), coexpression and interactions (green color), or interactions only (dark-red color). (h) and (i), Enrichment representation obtained by modular genes coexpression in M1 and M2 showing significantly (− Log10 transformed adjusted p value) enriched signaling pathways. IFN, interferon; TLR, Toll-like receptor.
Figure 2
Figure 2
C. albicans activates common TLR- and IFN-associated genes in peripheral blood leukocytes. (a) The upper plot displays the number (set size) of DEGs present in each dataset (y-axis: WBCs, GSE65088, and GSE114180; PBMCs: GSE42606 and GSE154911) and their intersections. Black bubbles, present in rows, mark the dataset, which refers to the amount present in the blue columns, with intersections between two or more groups being shown. (b), Hierarchical clustering of the 44 common DEGs demonstrating gene expression patterns across different studies. The size and color of circles correspond to − Log10 transformed adjusted p value and Log2-fold change (Log2FC), respectively. Blue represents downregulated DEGs, and red indicates upregulated DEGs. The cutoff applied to identify the down/upregulated genes was Log2FC <  − 1/ > 1 and adjusted p value < 0.05. Rows and columns were clustered based on cosine similarity between Log2FC values. (c), GOplot of selected immunological pathways and associated genes. (d), Heatmap of common and specific latent factors across studies. Heatmaps contain genes presenting positive and negative loadings ranging from − 1 to 1. DEGs, differentially expressed genes; PBMCs, peripheral blood mononuclear cells; WBCs, white blood cells.
Figure 3
Figure 3
C. albicans activate common TLR and IFN signaling pathways across different leukocyte populations. (ac), Proportional Venn diagrams displaying the number of DEGs present in each dataset grouped by cell type and their intersections: datasets of WBCs (a), PBMCs (b), and moDCs (c). (d), The intersection plot highlights the number of common DEGs across different cell groups (Venn diagrams were created using CorelDraw2019, available at coreldraw.com). (e), Hierarchical clustering exhibiting pathways enriched in common biological processes across studies (Suppl. Table S10). (f) Further analysis of TLR- and IFN-associated pathways. In both heatmaps, the size of the circles corresponds to the adjusted p value transformed into -Log10, and the color intensity indicates the number of genes in each biological process and pathway across studies. (g) Network demonstrating interactions between TLR- and IFN-associated DEGs/signaling pathways with other molecules and signaling cascades classically associated with antifungal immune responses. Enrichment analysis was performed using Reactome. Circular nodes represent pathways, and their size denotes the number of genes enriching the pathways. Colored squares represent the cellular location of genes. Genes interacting with more than 5 pathways are named. The interaction network was built using NAViGaTOR software. DEGs, differentially expressed genes; moDCs, monocyte-derived dendritic cells; IFN, interferon; PBMCs, peripheral blood mononuclear cells; TLR, Toll-like receptor; WBCs, whole Blood Cells.
Figure 4
Figure 4
Relationship between molecules associated with TLR and IFN signaling cascades. (a) and (b), Correloplot of DEGs associated with TLR and IFN signaling cascades in PBMCs (GSE42606) in the (a), absence or (b), presence of C. albicans. Histograms of Pearson’s correlation coefficient, containing negative and positive correlations from 1 to − 1, respectively. (c) Estimated correlations of TLR- and IFN-associated DEGs versus their corresponding first 2 canonical variates (x-CV1 and x-CV2 for IFN-associated genes; y-CV1 and y-CV2 for TLR-associated genes). Gray-colored variables (with names omitted) are those with correlation coefficients ≤ 0.7 in two corresponding canonical variates. Inner dotted lines limit the canonical correlation coefficient between − 0.7 and 0.7; outer dotted lines limit the coefficient between − 1 and 1. (d) and (e), PCA was used for stratification analysis of resting and C. albicans-infected PBMCs based on TLR- and IFN-associated DEGs. (d), Of note, individuals with similar expression values for these DEGs are grouped together; (e) Variables with positive correlation are pointing to the same side of the plot; negatively correlated variables point to opposite sides. DEGs, differentially expressed genes; IFN, interferon; PBMCs, peripheral blood mononuclear cells; TLR, Toll-like receptor.
Figure 5
Figure 5
Induction of interplay between TLR and IFN signaling pathways by other Candida species. Venn diagram showing the transcriptional overlap between (a), TLR- and (b), IFN-associated DEGs and the signaling pathways enriched in response to nonalbicans Candida species (C. glabrata, C. parapsilosis, and C. tropicalis) in comparison to C. albicans (created using CorelDraw2019, available at coreldraw.com). (c), Circular heatmaps of RNAseq expression z-scores computed for log2 transformed DEGs (p value adj < 0.05, fold change > 1 and <  − 1) compare expression of TLR (left panels) and IFN (right panels) signaling pathways induced by C. albicans (green/gray heatmaps) or C. auris (yellow/gray heatmaps) all from GSE154911. Small circular heatmaps (blue/gray) demonstrate common DEGs modulated by C. abicans and C auris. Individual circular heatmaps were created using the R packages circlize and ComplexHeatmap; the figure layout was edited using CorelDraw2019. (d), Venn diagram showing the transcriptional overlap (an intersection containing 237 shared DEGs) induced by C. auris and C. albicans (those 1096 genes found across all studies: Suppl. Table S11). (e), Dotplot of enriched signaling pathways by the 237 shared DEGs. DEGs, differentially expressed genes; IFN, interferon; ORA, overrepresentation analysis; TLR, Toll-like receptor.
Figure 6
Figure 6
The interactome of DEGs enriched in signaling pathways involved in the anti-Candida immune response and its association with inborn errors of immunity. (a), Relationships (edges) among the 1096 DEGs (nodes) found across all studies (Suppl. Table S11). Subnetworks (semicircles) represent genes associated with IEI causing increased susceptibility to candidiasis; 34 purple node genes are shared with the group of 1096 DEGs, and 66 green nodes represent those not found in the Candida datasets. Blue nodes are highlighted genes with more than 200 partners of interaction. Colored squares and circles represent the cell location of genes. The interaction network was built using NAViGaTOR software. (b), Network of hubs present in (a). (c), Proportional Venn diagram (created using CorelDraw2019, available at coreldraw.com) of interferon types associated with the group of 1096 DEGs. Interferome analysis revealed 878 IFN-regulated genes modulated by IFN types I, II, and III, as shown in the Venn diagram. DEGs, differentially expressed genes; IFN, Interferon; IEIs, inborn errors of immunity; TLR, Toll-like receptor.
Figure 7
Figure 7
Common TLR- and IFN-associated DEGs and signaling pathways across microarray, bulk, and single-cell RNA-seq datasets. (a), Heatmap using expression values from scRNAseq of DEGs also present in microarray and bulk studies; the cell condition and group are indicated by different colors. (b), Hierarchical clustering of average expression comparing resting and C. albicans-activated cells. (c), Hierarchical clustering showing common pathways selected from Fig. 1d across the cell groups; the size of circles corresponds to adjusted p value transformed into − Log10, and the color intensity indicates the number of genes in each pathway across the cell groups. DEGs, differentially expressed genes; IFN, interferon; TLR, Toll-like receptor; scRNA-seq, single-cell RNA sequencing.
Figure 8
Figure 8
Schematic view summarizing studies and the interplay between TLR and IFN signaling pathways in the immune response to C. albicans. The pathways shown are reported in the literature (created using BioRender.com). IFN, interferon; TLR, Toll-like receptor.

Similar articles

Cited by

References

    1. Chow NA, et al. Multiple introductions and subsequent transmission of multidrug-resistant Candida auris in the USA: A molecular epidemiological survey. Lancet Infect. Dis. 2018;18:1377–1384. doi: 10.1016/S1473-3099(18)30597-8. - DOI - PMC - PubMed
    1. World Health Organization. GLASS report: early implementation 2017–2018. https://www.who.int/publications/i/item/9789241515061 (2019).
    1. Casadevall A. Don’t forget the fungi when considering global catastrophic biorisks. Heal. Secur. 2017;15:341–342. doi: 10.1089/hs.2017.0048. - DOI - PMC - PubMed
    1. Warnock DW. Fungal diseases: An evolving public health challenge. Med. Mycol. 2006;44:697–705. doi: 10.1080/13693780601009493. - DOI - PubMed
    1. Meis JF, Chowdhary A. Candida auris: A global fungal public health threat. Lancet Infect. Dis. 2018;18:1298–1299. doi: 10.1016/S1473-3099(18)30609-1. - DOI - PubMed

Publication types