

Deep learning on fundus images detects glaucoma beyond the optic disc
- PMID: 34645908
- PMCID: PMC8514536
- DOI: 10.1038/s41598-021-99605-1
Deep learning on fundus images detects glaucoma beyond the optic disc
Erratum in
-
Author Correction: Deep learning on fundus images detects glaucoma beyond the optic disc.Sci Rep. 2023 Dec 5;13(1):21456. doi: 10.1038/s41598-023-48939-z. Sci Rep. 2023. PMID: 38052987 Free PMC article. No abstract available.
Abstract
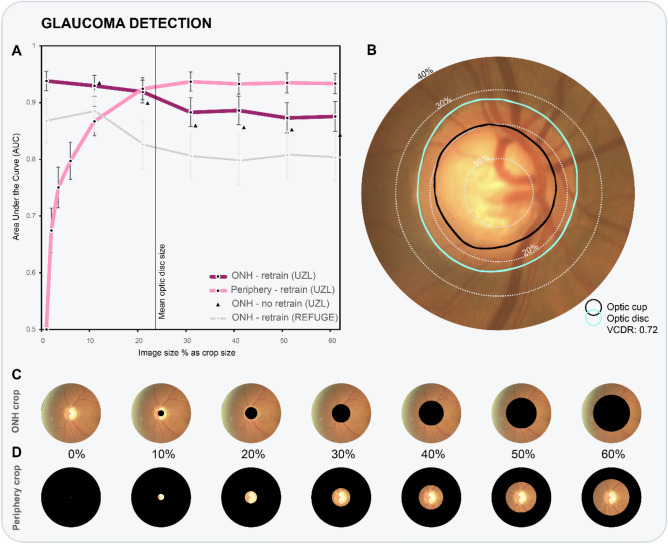
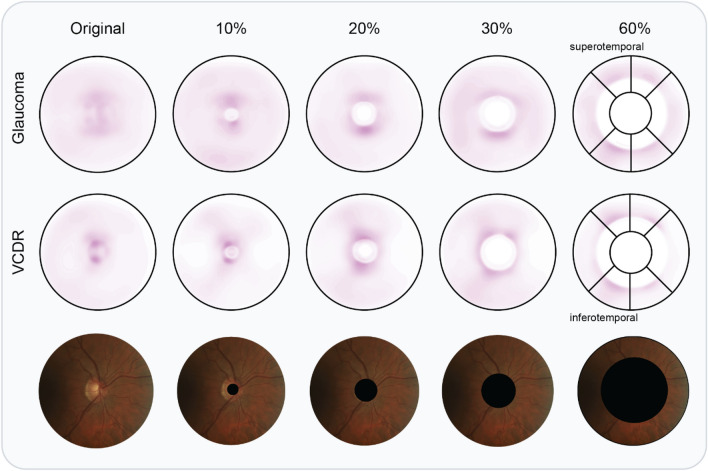
Although unprecedented sensitivity and specificity values are reported, recent glaucoma detection deep learning models lack in decision transparency. Here, we propose a methodology that advances explainable deep learning in the field of glaucoma detection and vertical cup-disc ratio (VCDR), an important risk factor. We trained and evaluated deep learning models using fundus images that underwent a certain cropping policy. We defined the crop radius as a percentage of image size, centered on the optic nerve head (ONH), with an equidistant spaced range from 10-60% (ONH crop policy). The inverse of the cropping mask was also applied (periphery crop policy). Trained models using original images resulted in an area under the curve (AUC) of 0.94 [95% CI 0.92-0.96] for glaucoma detection, and a coefficient of determination (R2) equal to 77% [95% CI 0.77-0.79] for VCDR estimation. Models that were trained on images with absence of the ONH are still able to obtain significant performance (0.88 [95% CI 0.85-0.90] AUC for glaucoma detection and 37% [95% CI 0.35-0.40] R2 score for VCDR estimation in the most extreme setup of 60% ONH crop). Our findings provide the first irrefutable evidence that deep learning can detect glaucoma from fundus image regions outside the ONH.
© 2021. The Author(s).
Conflict of interest statement
No outside entities have been involved in the study design, in the collection, analysis and interpretation of data, in the writing of the manuscript, nor in the decision to submit the manuscript for publication. I.S. is co-founder, shareholder, and consultant of Mona.health, a KU Leuven/VITO spin-off to which three of the described models were transferred. Under their terms of employment at KU Leuven, R.H. and M.B.B. are entitled to stock options in Mona.health. The study design was conceptualized in light of the PhD thesis of R.H., prior to the model transfer. The KU Leuven investigators have a free research licence to the three transferred models.
Figures

References
-
- Ocular Hypertension Treatment Study Group. European Glaucoma Prevention Study Group. Gordon MO, et al. Validated prediction model for the development of primary open-angle glaucoma in individuals with ocular hypertension. Ophthalmology. 2007;114(1):10–19. doi: 10.1016/j.ophtha.2006.08.031. - DOI - PMC - PubMed
Publication types
MeSH terms
LinkOut - more resources
Full Text Sources
Medical
