. 2021 Oct 13;11(1):20302.
doi: 10.1038/s41598-021-99874-w.

Ten years of pluviometric analyses in Italy for civil protection purposes

Affiliations

Ten years of pluviometric analyses in Italy for civil protection purposes

Matteo Del Soldato et al. Sci Rep. .

Abstract

The concept of climate change has grown in recent decades, influencing the scientific community to conduct research on meteorological parameters and their variabilities. Research on global warming, as well as on its possible economic and environmental consequences, has spread over the last 20 years. Diffused changes in trends have been stated by several authors throughout the world, with different developments observed depending on the continent. Following a period of approximately 40 days of almost continuous rain that occurred from October to November 2019 across the Italian territory and caused several hazards (e.g., floods and landslides), a relevant question for decision-makers and civil protection actors emerged regarding the relative frequencies of given rainfall events in the Warning Hazard Zones (WHZs) of Italy. The derived products of this work could answer this question for both weather and hydrogeological operators thanks to the frequency and spatio-temporal distribution analyses conducted on 10-year daily rainfall data over the entire Italian territory. This work aspires to be an additional tool used to analyse events that have occurred, providing further information for a better understanding of the probability of occurrence and distribution of future events.


Conflict of interest statement

The authors declare no competing interests.

Figures
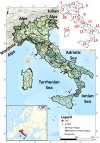
Figure 1
Figure 1
Localization of the area of interest with discrimination of the Regional Decentralized Functional Centre (R-CFD) zones that are autonomous only for hydrogeological warnings (in light green) and the R-CFD zones that are autonomous for both weather forecasting and hydrogeological warnings (in dark green). The map was generated using ESRI ArcGIS Pro 2.5.0 (https://www.esri.com/en-us/home). 1-Valle d’Aosta; 2-Piemonte; 3-Lombardia; 4-Trentino-Alto Adige; 5-Veneto; 6-Friuli-Venezia Giulia; 7-Emilia-Romagna; 8-Marche; 9-Umbria; 10-Abruzzo; 11-Molise; 12-Puglia; 13-Basilicata; 14-Calabria; 15-Campania; 16-Lazio; 17-Toscana; 18-Liguria; 19-Sicilia; 20-Sardegna Regions. In the first image, the Central Functional Centre (CFC) in Rome and the locations of all rain gauges analysed in the presented study are also reported with black dots.
Figure 2
Figure 2
Spatial distribution of the rainfall frequency for each Warning Hydrogeological Zone (WHZ) from 1 January 2010 to 31 December 2019 over the entire Italian territory. The maps were generated using ESRI ArcGIS Pro 2.5.0 (https://www.esri.com/en-us/home). The maps show the spatial distributions of the rainfall frequencies falling within the Low (a), Medium (b), High (c), Very high (d) and Heavy rain (e) intensity classes.
Figure 3
Figure 3
Pluviometric frequency analysis for five WHZs characterized by relevant values in all intensity classes: Friu-A, Piem-B, Ligu-E, Tosc-L and Cala-6. The map was generated using ESRI ArcGIS Pro 2.5.0 (https://www.esri.com/en-us/home). For the higher intensity classes, zoomed images are provided for better visualization.
Figure 4
Figure 4
Number of damaging events (a, floods; b, landslides) and funds allocated for remediation works (c, floods; d, landslides). (data obtained from ISPRA).
Figure 5
Figure 5
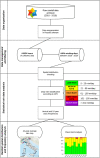
Flowchart of the adopted methods in the investigation and frequency analysis. The flowchart was generated using Lucidchart (https://www.lucidchart.com/pages/).

References

    1. Incerti G, Feoli E, Giovacchini A, Salvati L, Brunetti A. Analysis of bioclimatic time series and their neural network-based classification to characterize drought risk patterns in south Italy. Int. J. Biometeorol. 2007;51:253–263. doi: 10.1007/s00484-006-0071-6. - DOI - PubMed
    1. Helldén U, Tottrup C. Regional desertification: a global synthesis. Global Planet. Change. 2008;64:169–176. doi: 10.1016/j.gloplacha.2008.10.006. - DOI
    1. De Luca C, Furcolo P, Rossi F, Villani P, Vitolo C. Extreme rainfall in the Mediterranean. Science. 2010;2:19.
    1. Zhou X, Wang Y. Dynamics of land surface temperature in response to land-use/cover change. Geogr. Res. 2011;49:23–36. doi: 10.1111/j.1745-5871.2010.00686.x. - DOI
    1. Kiely, G, Albertson, JD, Parlange, MB. Recent trends in diurnal variation of precipitation at Valencia (1998).