. 2021 Oct;598(7880):293-297.
doi: 10.1038/s41586-021-03868-7. Epub 2021 Oct 13.

Superior robustness of anomalous non-reciprocal topological edge states

Affiliations

Superior robustness of anomalous non-reciprocal topological edge states

Zhe Zhang et al. Nature. 2021 Oct.

Abstract

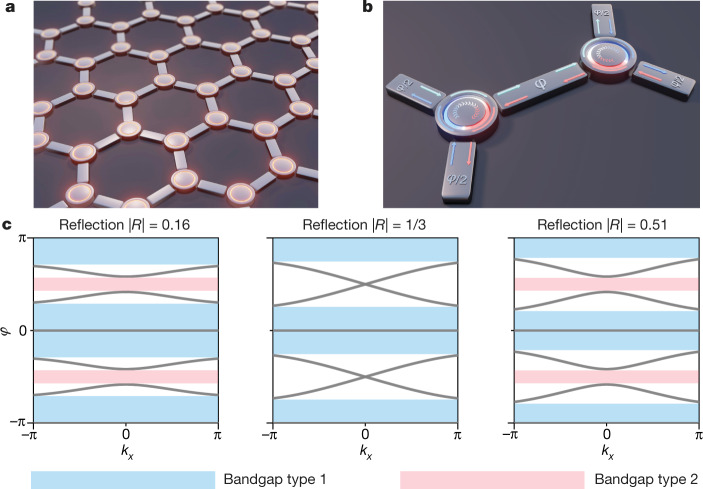
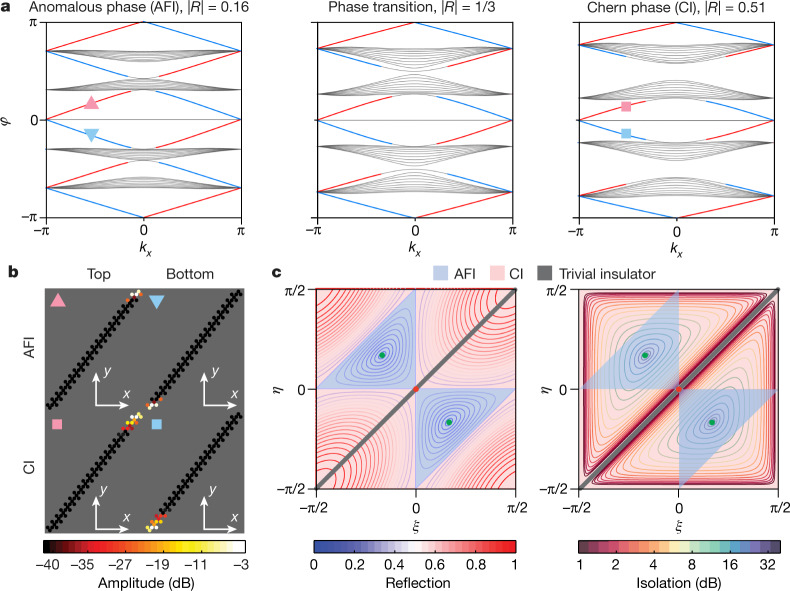
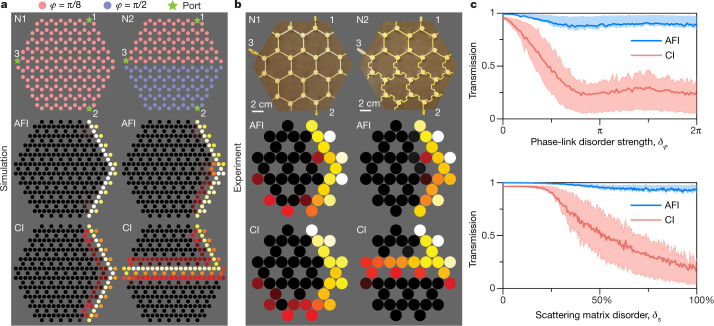
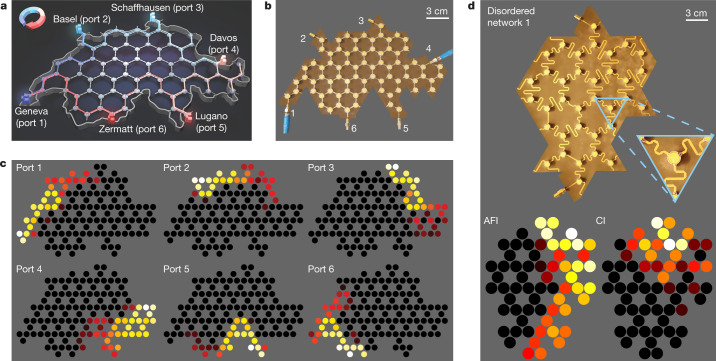
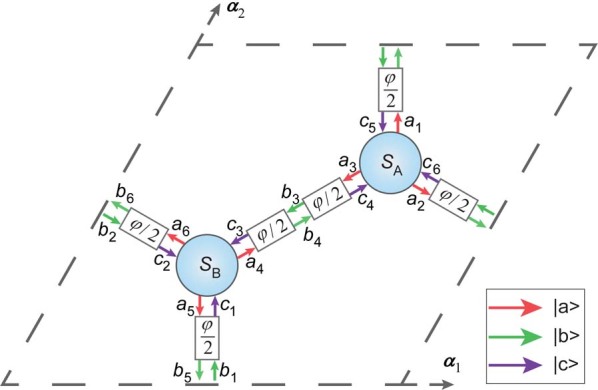
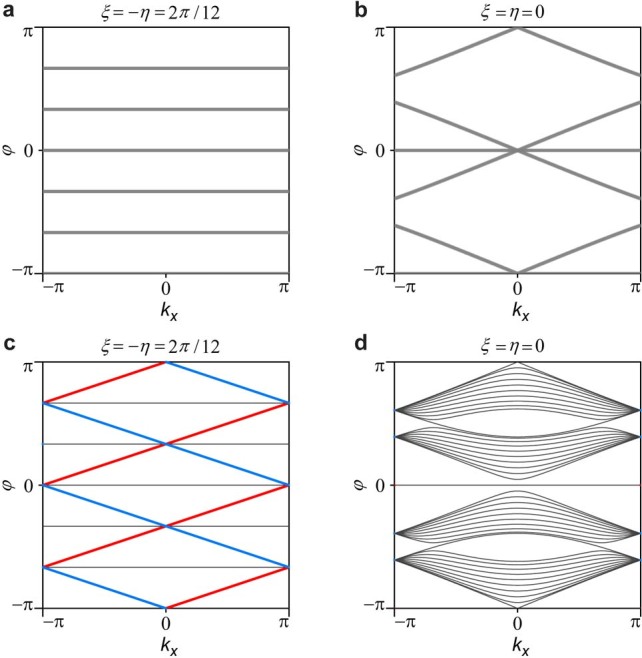
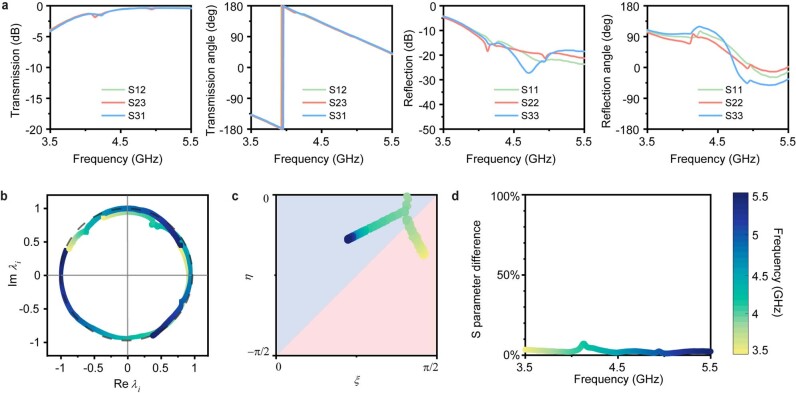
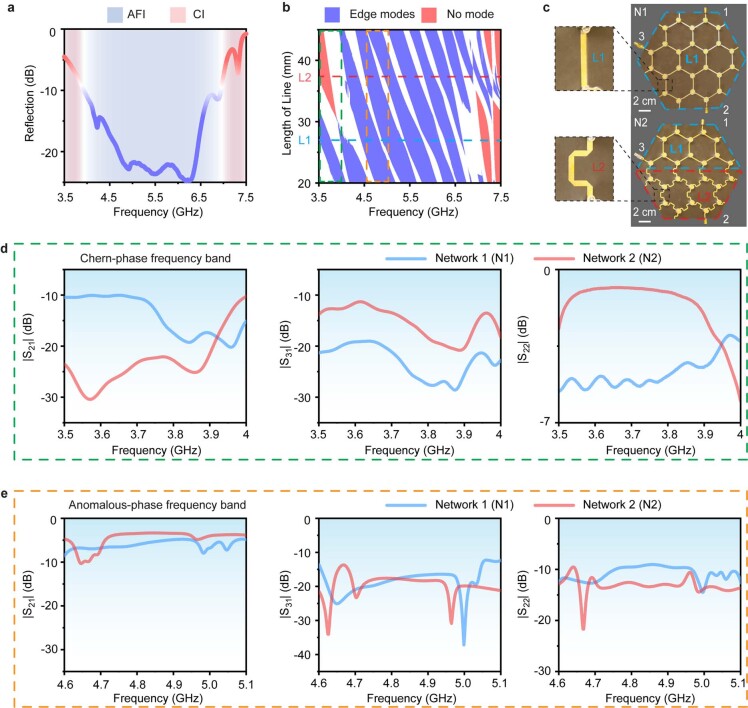
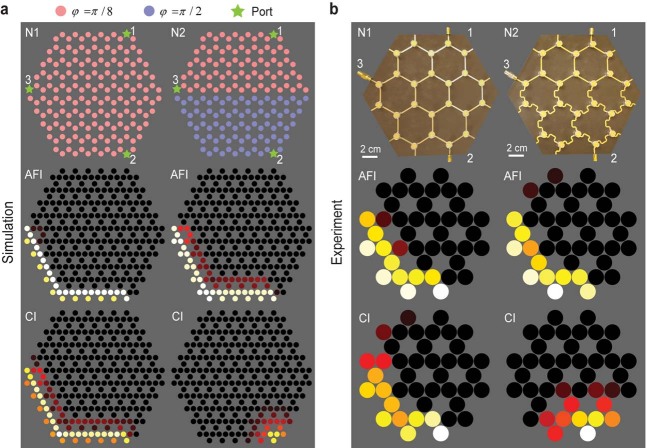
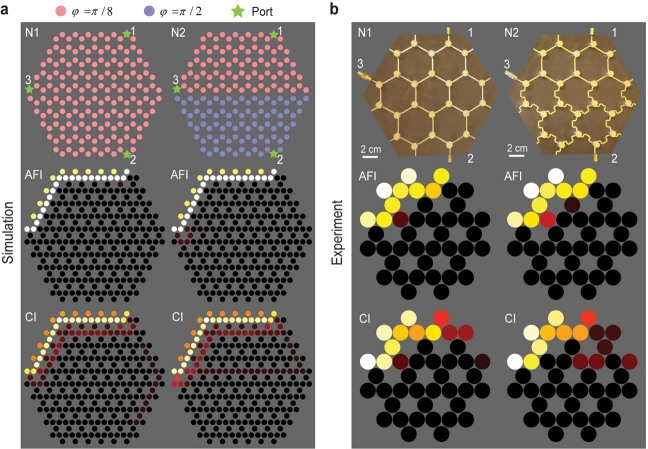
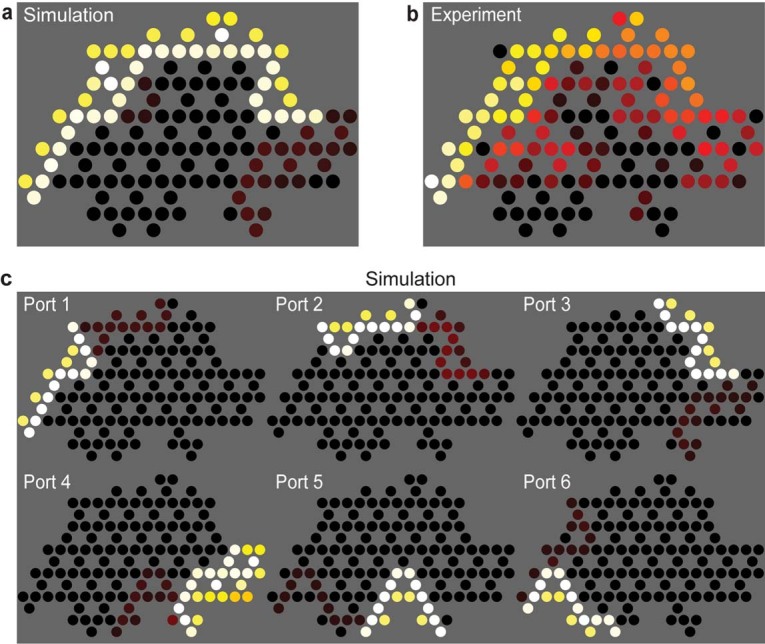
Robustness against disorder and defects is a pivotal advantage of topological systems1, manifested by the absence of electronic backscattering in the quantum-Hall2 and spin-Hall effects3, and by unidirectional waveguiding in their classical analogues4,5. Two-dimensional (2D) topological insulators4-13, in particular, provide unprecedented opportunities in a variety of fields owing to their compact planar geometries, which are compatible with the fabrication technologies used in modern electronics and photonics. Among all 2D topological phases, Chern insulators14-25 are currently the most reliable designs owing to the genuine backscattering immunity of their non-reciprocal edge modes, brought via time-reversal symmetry breaking. Yet such resistance to fabrication tolerances is limited to fluctuations of the same order of magnitude as their bandgap, limiting their resilience to small perturbations only. Here we investigate the robustness problem in a system where edge transmission can survive disorder levels with strengths arbitrarily larger than the bandgap-an anomalous non-reciprocal topological network. We explore the general conditions needed to obtain such an unusual effect in systems made of unitary three-port non-reciprocal scatterers connected by phase links, and establish the superior robustness of anomalous edge transmission modes over Chern ones to phase-link disorder of arbitrarily large values. We confirm experimentally the exceptional resilience of the anomalous phase, and demonstrate its operation in various arbitrarily shaped disordered multi-port prototypes. Our results pave the way to efficient, arbitrary planar energy transport on 2D substrates for wave devices with full protection against large fabrication flaws or imperfections.


Conflict of interest statement

The authors declare no competing interests.

Figures

Fig. 1
Fig. 1. Topological non-reciprocal wave network and its bulk band structure.
a, We consider a unitary scattering network made of three-port non-reciprocal elements, described by asymmetric unitary scattering matrices. b, Unit cell of the honeycomb lattice, highlighting the signals entering the non-reciprocal elements, their 120° rotational symmetry, and the reciprocal phase delay φ imparted by the links. The network is described by a unitary unit-cell scattering operator S(k) defining a Floquet unitary mapping with quasi-energy φ. c, Evolution of the Floquet band structure on increasing the level of reflection of the non-reciprocal elements from |R| = 0.16 (leftmost panel, with angular parameter values ξ = −η = 2.5π/12) to |R| = 0.51 (rightmost panel, ξ = −η = 3.5π/12). While the type 1 bandgaps do not change much, at |R| = 1/3 (centre panel, ξ = −η = π/4), the type 2 bandgap closes, symptomatic of a topological phase transition.
Fig. 2
Fig. 2. Anomalous and Chern topological phases in non-reciprocal wave networks.
a, Band structure of a supercell with periodic boundary conditions along x and unitary reflection at the top and bottom. The parameters are the same as in Fig. 1c. The low-reflection case is the anomalous topological phase (an anomalous Floquet insulator, AFI), which features an edge mode in every quasi-energy gap. Conversely, the high-reflection case supports edge modes only inside the type 1 bandgaps, consistent with the Chern insulator (CI) phase. Edge modes localized to the top and bottom are shown in red and blue, respectively. The phase transition is depicted in the middle panel. b, Supercell with examples of the profiles of Chern and anomalous topological edge modes, corresponding to the markers in a. c, Topological phase diagrams in the (ξ, η) plane. The blue-shaded areas correspond to the anomalous phase, and the red-shaded areas to the Chern phase. Left, comparison with the iso-reflection contours of the individual scatterers, demonstrating the coincidence between the topological phase transition and the |R| = 1/3 contour. Right, comparison with the non-reciprocal isolation level of the individual scatterers |S21/S12|. On the thick grey diagonals in panel c, the scatterers are reciprocal and the type 1 bandgaps close. At the centre red point, all bandgaps close. The two green points represents the perfect circulator cases, either with right-handed circulation (upper-left point) or left-handed circulation (lower-right point).
Fig. 3
Fig. 3. Superior robustness of anomalous non-reciprocal topological edge transmission.
a, Numerical simulation of the steady-state energy propagation in finite non-reciprocal networks with different phase-link distributions. The signal is incident from port 1 (see top panel for positions of ports 1–3). The parameters used to generate the anomalous (centre panel) and Chern (bottom panel) phases are the same as in Figs. 1 and 2. Left column (network 1, N1), the phase-link distribution is uniform, with φ = π/8, and the energy can be transmitted to port 2 in both the anomalous and Chern phases. Right column (network 2, N2), we introduce an interface and abruptly change the value of φ to π/2 for the bottom part of the network. Only the anomalous phase is robust to this change, and keeps transmitting to port 2. In the Chern phase, the edge mode travels along the interface and reaches port 3. b, Experimental validation using microwaves in a network made of ferrite circulators. The colourmap represents the measured field amplitude distribution, where brighter colours correspond to a large field amplitude, and darker colours a low field amplitude. c, Top panel, transmission between ports 1 and 2 in a disordered system with randomly generated phase delays. The phases are uniformly drawn in an interval [−δφ/2, δφ/2] around φ = π/8. Solid lines represent the value of transmission averaged over 1,000 realizations of disorder, and the dashed lines are the first and last quartiles (Q1 and Q3). The anomalous edge transmission channel can survive disorder strengths up to a full 2π rotation. Bottom panel, same but for the case of scattering matrix disorder within a given topological phase (φ = π/8). Transmission in the anomalous channel is also more resilient to this disorder type. See Supplementary Information for particular field maps and other Chern cases.
Fig. 4
Fig. 4. Experiments on irregularly shaped and disordered networks.
a, We consider a network shaped like the map of Switzerland, and placed six ports on the external boundary at six city locations. b, Photograph of the associated prototype, showing ports 1–6. c, Experimental field maps upon sequential excitation of this six-port system. The network behaves as a six-port circulator despite its irregular shape, the random port locations and the high number of ports. d, Experimental validation of robust anomalous transmission in a two-port system with randomly disordered phase links under the largest possible disorder strength (δφ = 2π). Top, photograph of one of our prototypes. Bottom, measured field maps in the AFI and CI cases. The AFI edge mode reaches port 2, while the Chern one is blocked. The other four results are shown in Extended Data Fig. 9.
Extended Data Fig. 1
Extended Data Fig. 1. Detailed schematic of the unit cell of the non-reciprocal network and signal labelling convention.
We define three state vectors: |a >, |b >, and |c >, which represent scattering wave amplitudes propagating out, between and into the non-reciprocal elements, respectively. The total phase delay between two scatterers is φ.
Extended Data Fig. 2
Extended Data Fig. 2. Floquet band structures at two special points of the topological phase diagram.
a, b, Bulk band structures at the green (a) and centre (b) points of the phase diagram of Fig. 2c in the main text. The green point corresponds to a phase-rotation symmetric network of perfect matched circulators, thus in AFI phase. The red centre point represents a network of reciprocal resonant scatterers, with all bandgaps closed. c, d, Ribbon band structures corresponding to panel a and b, respectively. The perfect circulator network features flat bulk band with dispersionless edge modes regardless of the value of the quasi-energy φ, which can only occur in the AFI phase.
Extended Data Fig. 3
Extended Data Fig. 3. Experimental validation of the model assumptions.
a, C3 symmetry holds when S12 = S23 = S31 as well as S11 = S22 = S33, which is very well satisfied in the considered frequency range. b, Eigenvalues of the measured scattering matrix, with nearly-unitary behaviour over the entire experimental bandwidth. c, ξ and η parameters used to approximate the real scattering matrix with a C3-symmetric unitary matrix. The red area is the Chern phase, and the blue area the anomalous one. d, Error in % made by approximating the real scattering matrix with equation (4) over the entire bandwidth.
Extended Data Fig. 4
Extended Data Fig. 4. Experimental network design and measured scattering parameters.
a, Measured reflection spectrum of an individual ferrite circulator. The blue-shaded area represents the bandwidth of the anomalous phase, corresponding to low reflection (|R| < −9.5 dB = 20∙log10(1/3)). By contrast, the red-shaded area shows the Chern phase with high reflection (|R| > −9.5 dB). Topological phase transitions happen at around 3.9 GHz and 7 GHz. b, Topological bandgap map predicted from the individual scattering data, when varying the length of the microstrip connections and the operating frequency. The blue and red regions correspond to bandgaps with and without topological edge modes, respectively. The white regions represent bulk bands. c, Design details of the experimental networks probed in Fig. 3b of the main text. Network 1 (N1) has a uniform length distribution of microstrip lines with L = L1. For network 2 (N2), we introduce an interface and replace the bottom part with lines of different length L2. d, Measured amplitudes of the scattering parameters S21 (left), S31 (middle) and S22 (right) in the Chern-phase frequency band (green dashed box in panel b). e, Measured scattering parameters in the anomalous-phase frequency band (yellow dashed box in panel b).
Extended Data Fig. 5
Extended Data Fig. 5. Numerical and experimental field maps for excitation at port 2.
a, Numerical predictions for excitation at port 2 for the same system as in Fig. 3 of the main text. While the anomalous phase supports transmission to port 3 regardless of the phase link distribution, the Chern phase possesses a trivial bandgap at φ = π/2, and reflects all the energy incident from port 2, see bottom right plot (the field distribution exhibits exponential decay). b, Corresponding experimental data.
Extended Data Fig. 6
Extended Data Fig. 6. Numerical and experimental field maps for excitation at port 3.
a, Numerical predictions for excitation at port 3 for the same system as in Fig. 3 of the main text. Both the anomalous and Chern phases fall in topological bandgap at φ = π/2, leading to transmission to port 1. b, Corresponding experimental data.
Extended Data Fig. 7
Extended Data Fig. 7. Additional field maps for the anomalous topological Switzerland-shaped network.
We plot simulated (a) and experimental (b) transmissions from Geneva (port 1) to Davos (port 4) for the same network in Fig. 4 of the main text, leaving all other ports open. c, Numerical prediction corresponding to the experimental data shown in Fig. 4c of the main text.
Extended Data Fig. 8
Extended Data Fig. 8. Experimental setups for scattering parameter and field distribution measurements.
a, The setup consists of a vector network analyser (VNA) and three microwave non-reciprocal networks: the Switzerland-shaped network (left), N1 (middle), and N2 (right). b, Field map measurement with a coaxial probe for measuring fields on the microstrip lines.
Extended Data Fig. 9
Extended Data Fig. 9. Experimental validation of anomalous phase disorder robustness in four other prototypes with distinct disorder realizations.
a, Pictures of the prototypes, having the same irregular shape but different phase delay distributions implemented by varying the geometry of the serpentine links. b, Measured field maps in the AFI phase. c, Measured field maps in the CI phase.

References

    1. Hasan MZ, Kane CL. Topological insulators. Rev. Mod. Phys. 2010;82:3045–3067. doi: 10.1103/RevModPhys.82.3045. - DOI
    1. Thouless DJ, Kohmoto M, Nightingale MP, den Nijs M. Quantized Hall conductance in a two-dimensional periodic potential. Phys. Rev. Lett. 1982;49:405–408. doi: 10.1103/PhysRevLett.49.405. - DOI
    1. Kane CL, Mele EJ. Z2 topological order and the quantum spin Hall effect. Phys. Rev. Lett. 2005;95:146802. doi: 10.1103/PhysRevLett.95.146802. - DOI - PubMed
    1. Lu L, Joannopoulos JD, Soljačić M. Topological photonics. Nat. Photon. 2014;8:821–829. doi: 10.1038/nphoton.2014.248. - DOI
    1. Ozawa T, et al. Topological photonics. Rev. Mod. Phys. 2019;91:015006. doi: 10.1103/RevModPhys.91.015006. - DOI

Publication types