. 2021 Nov;599(7883):120-124.
doi: 10.1038/s41586-021-03986-2. Epub 2021 Oct 13.

Unravelling the collateral damage of antibiotics on gut bacteria

Affiliations

Unravelling the collateral damage of antibiotics on gut bacteria

Lisa Maier et al. Nature. 2021 Nov.

Abstract

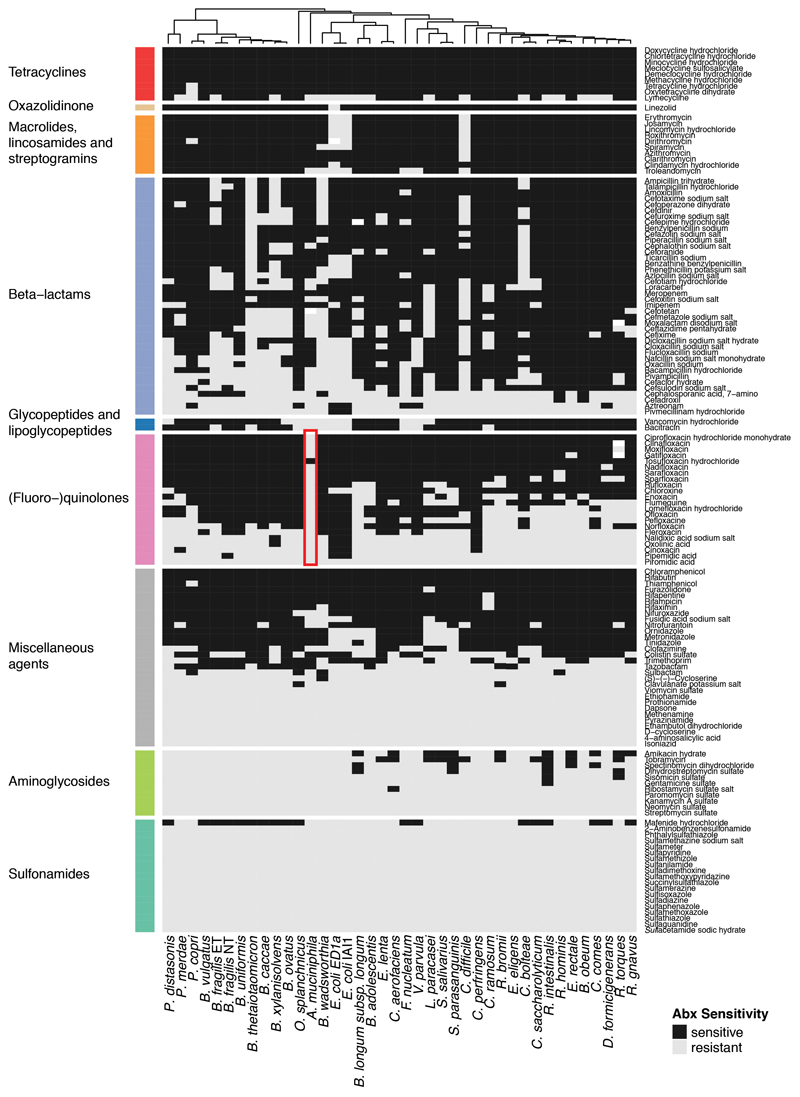
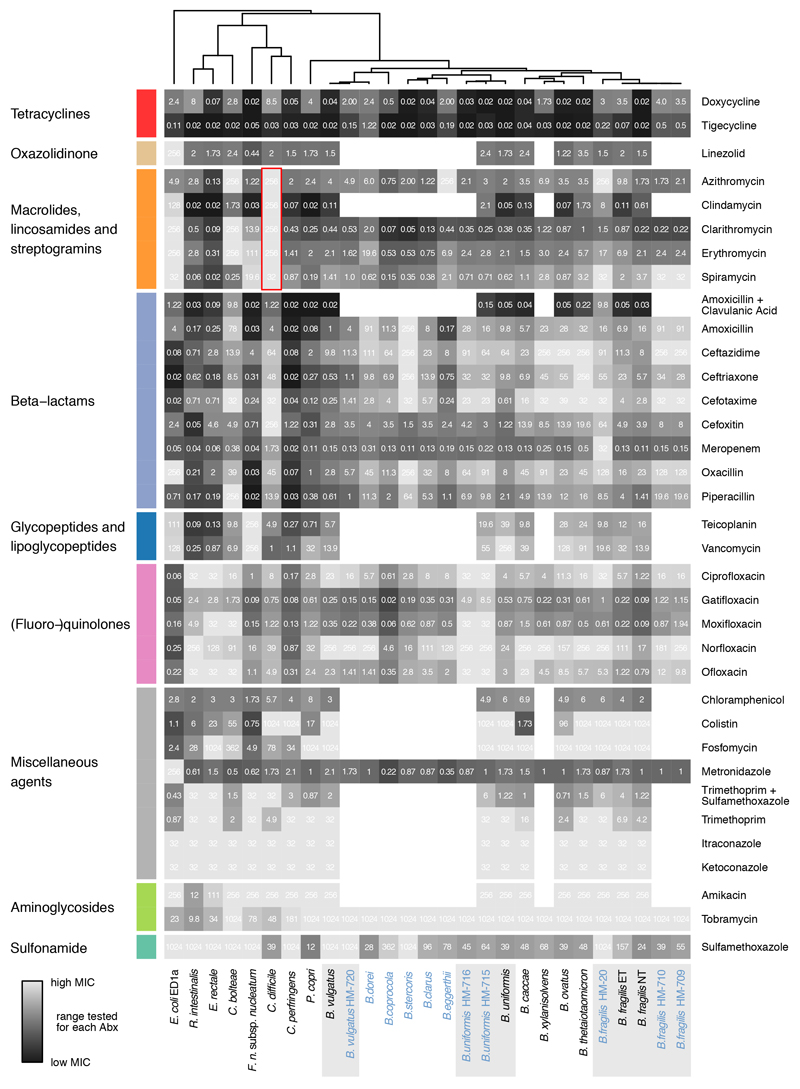
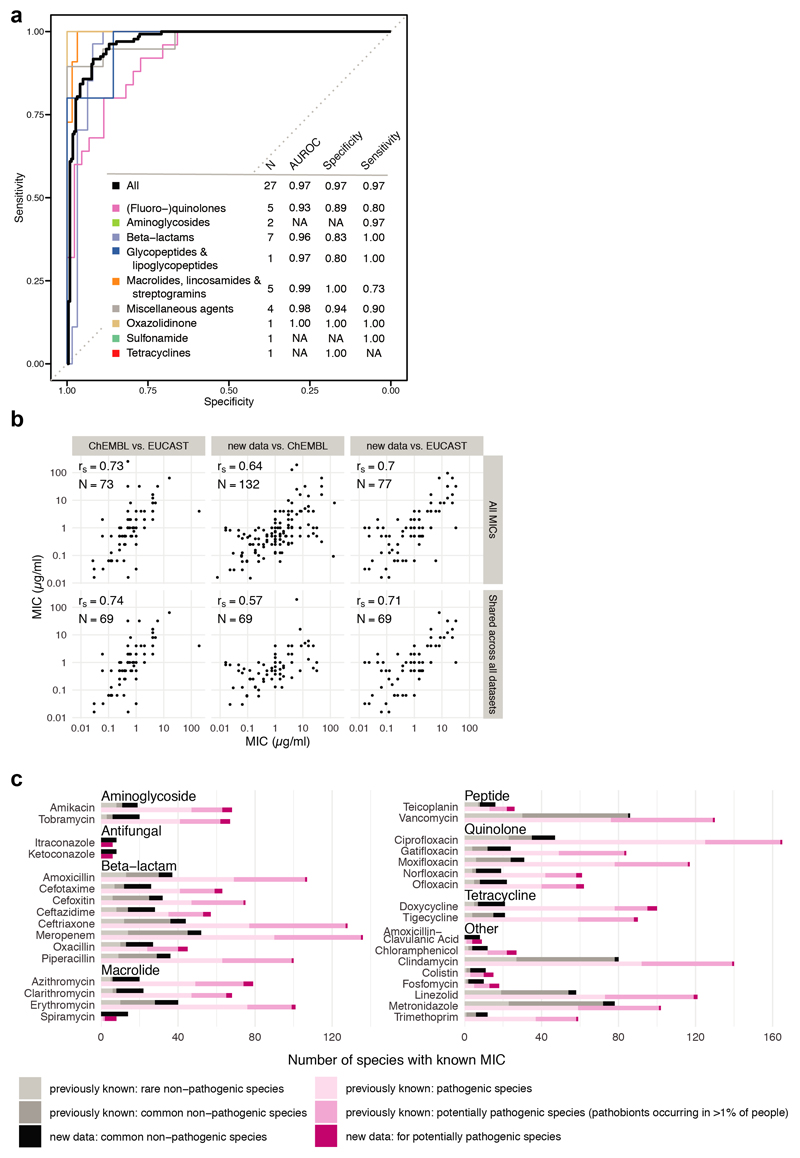
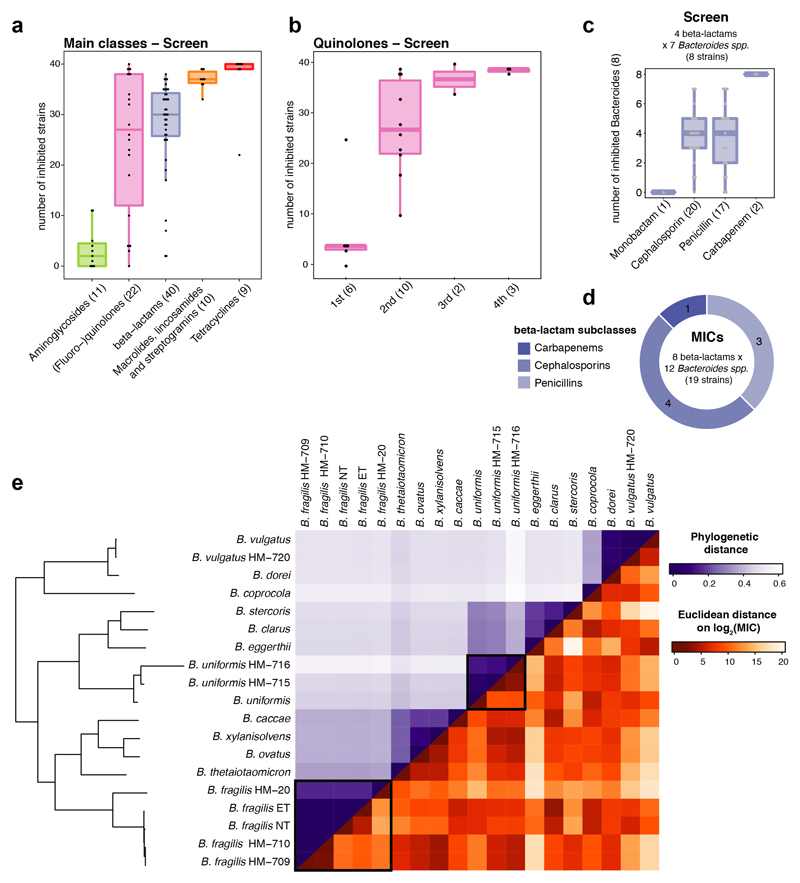
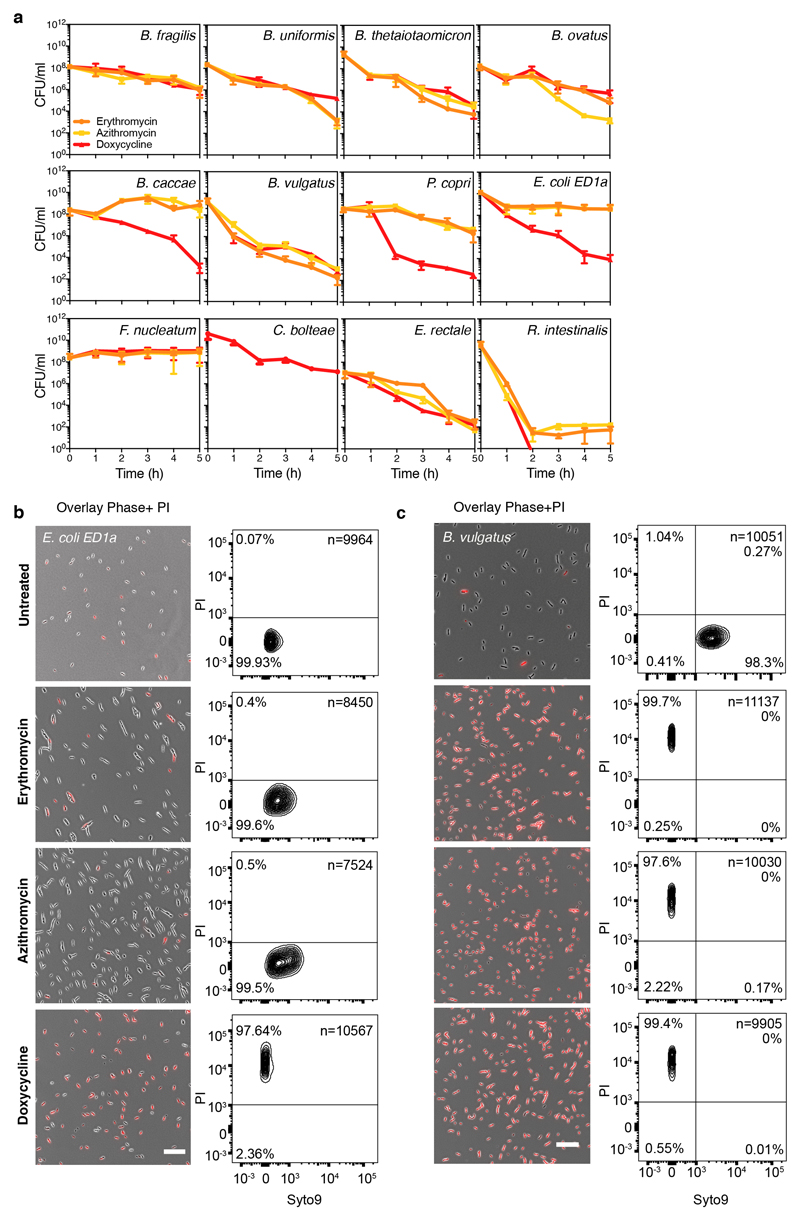
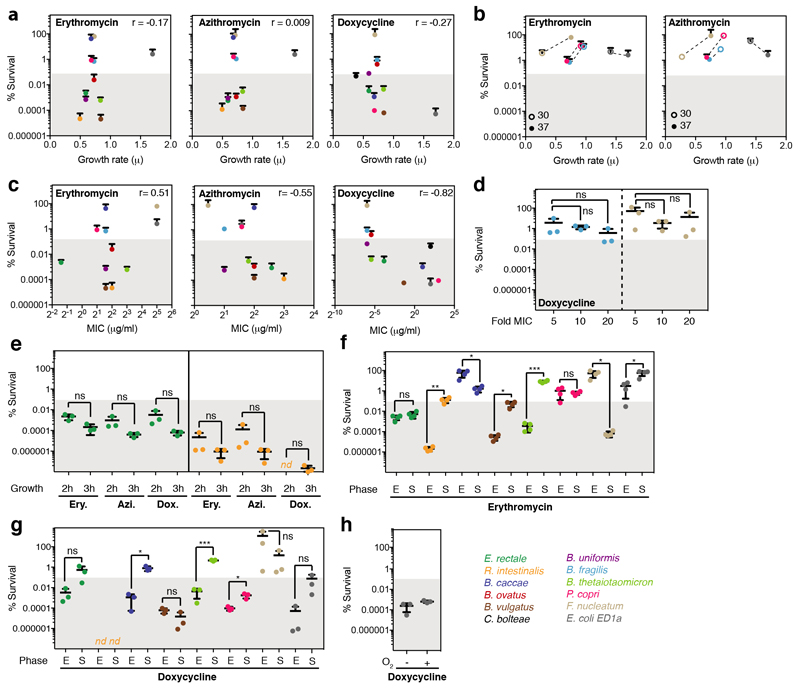
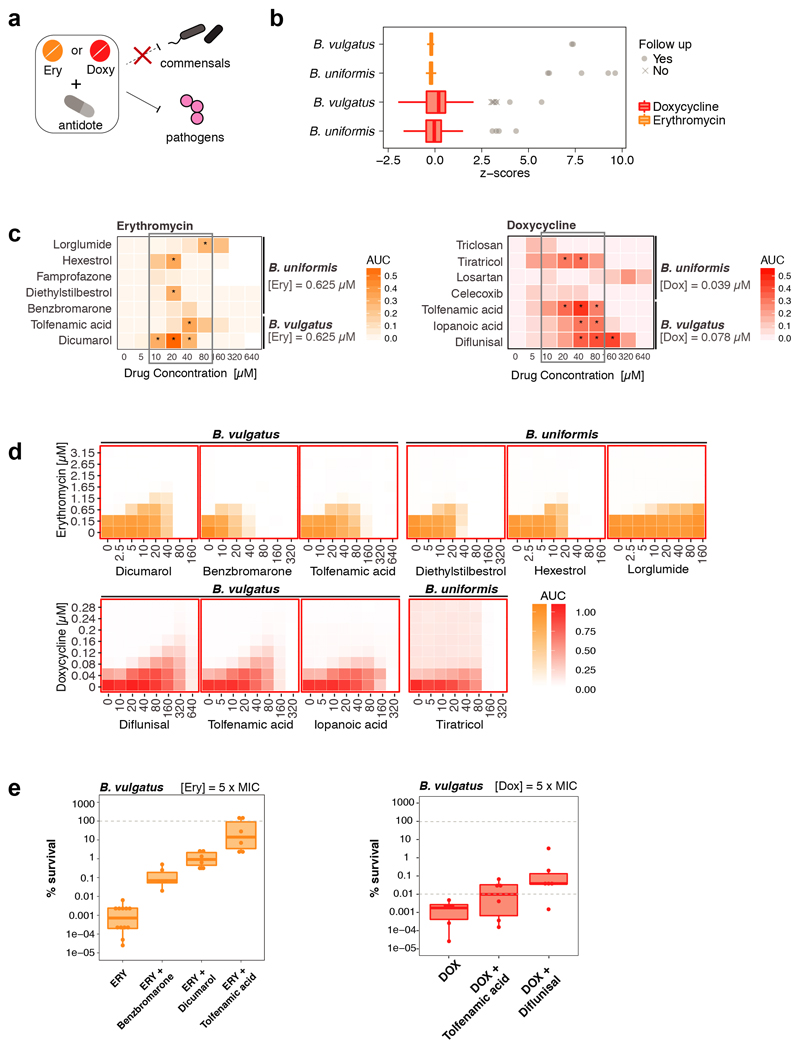
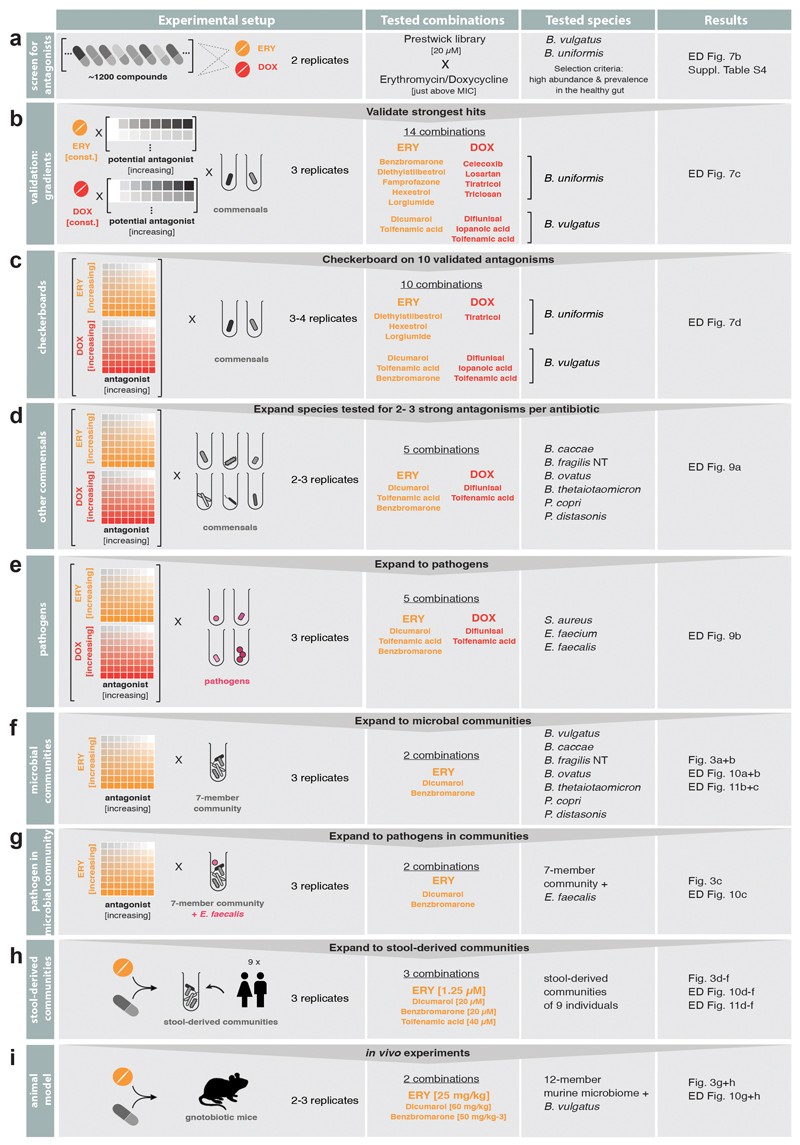
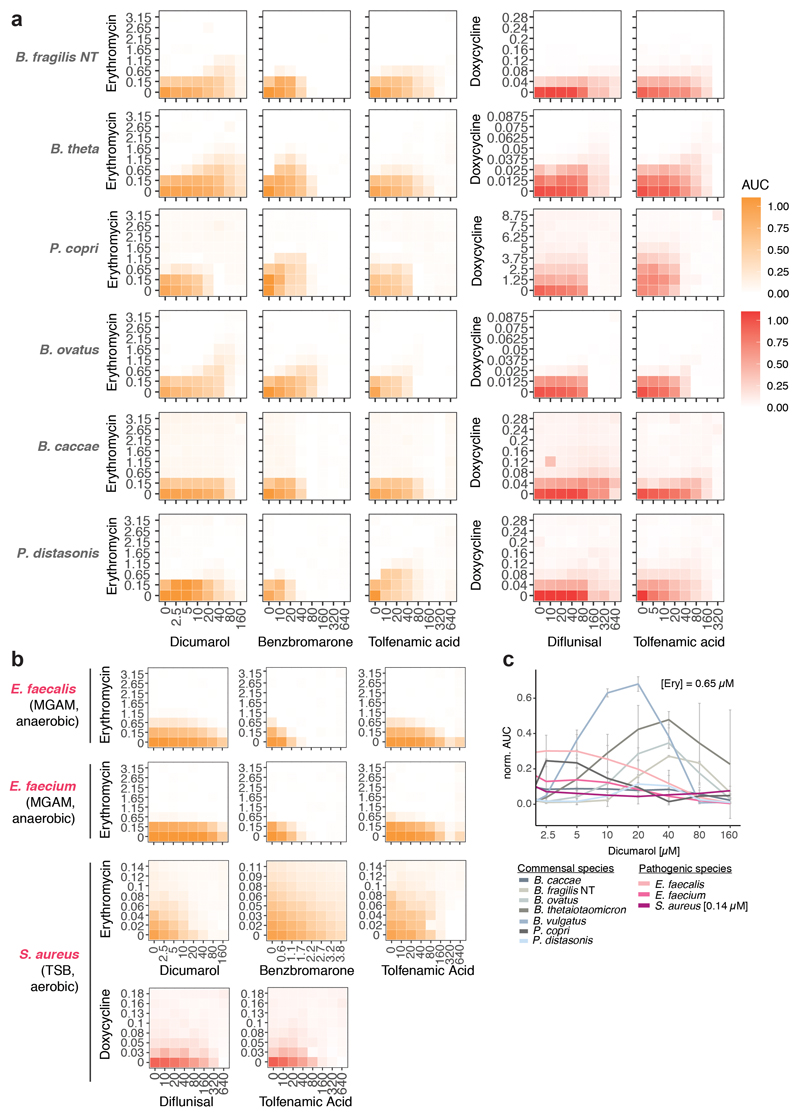
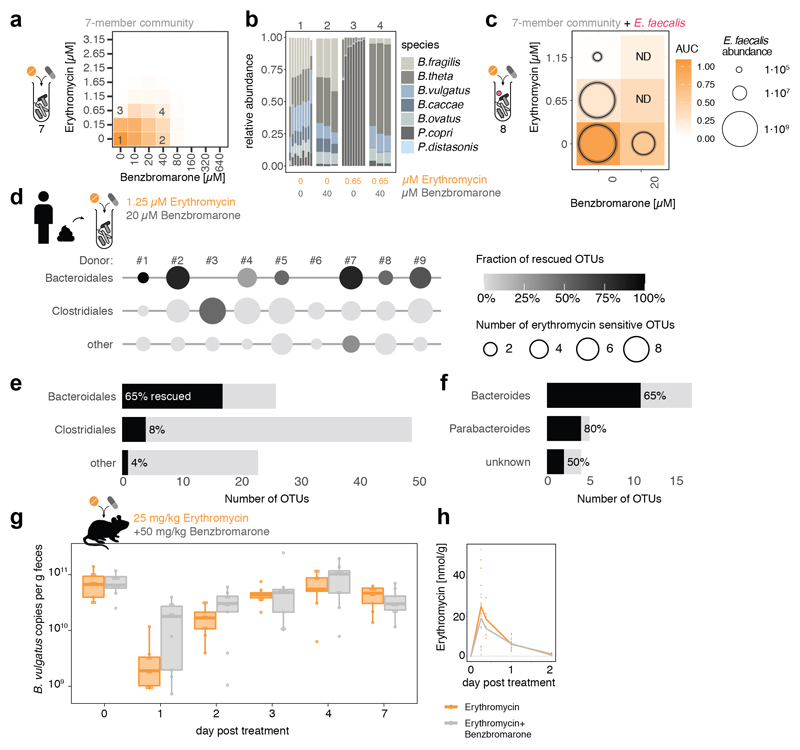
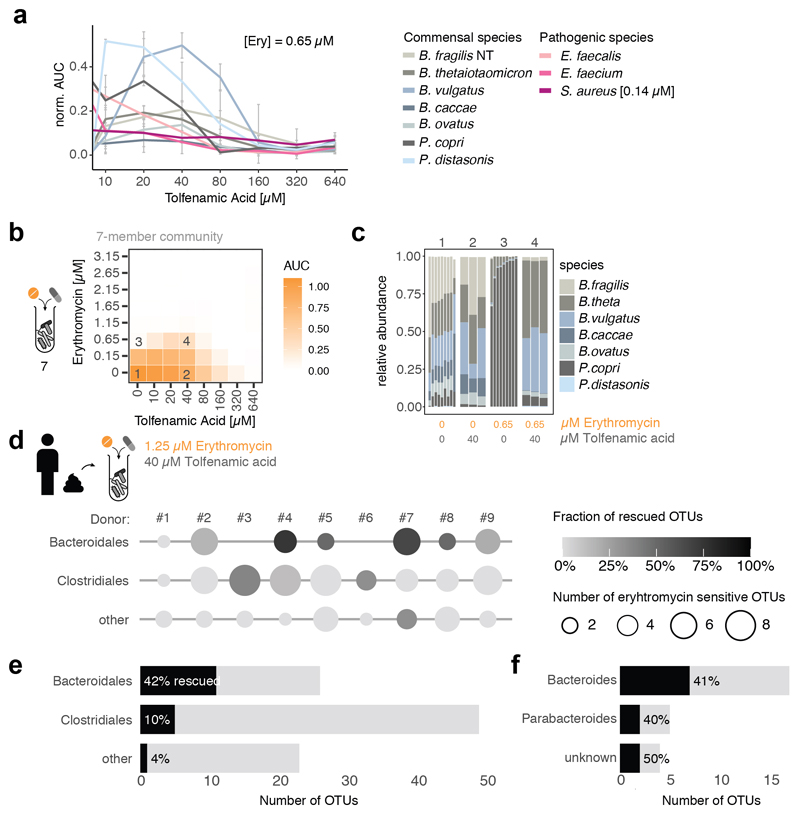
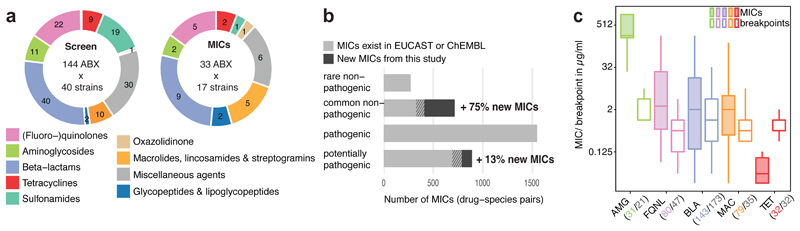
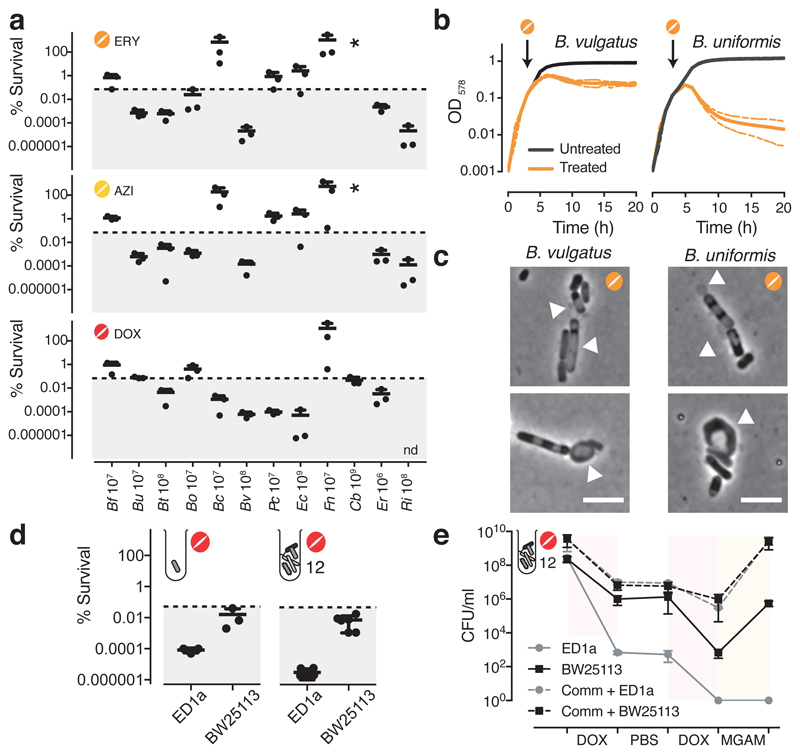
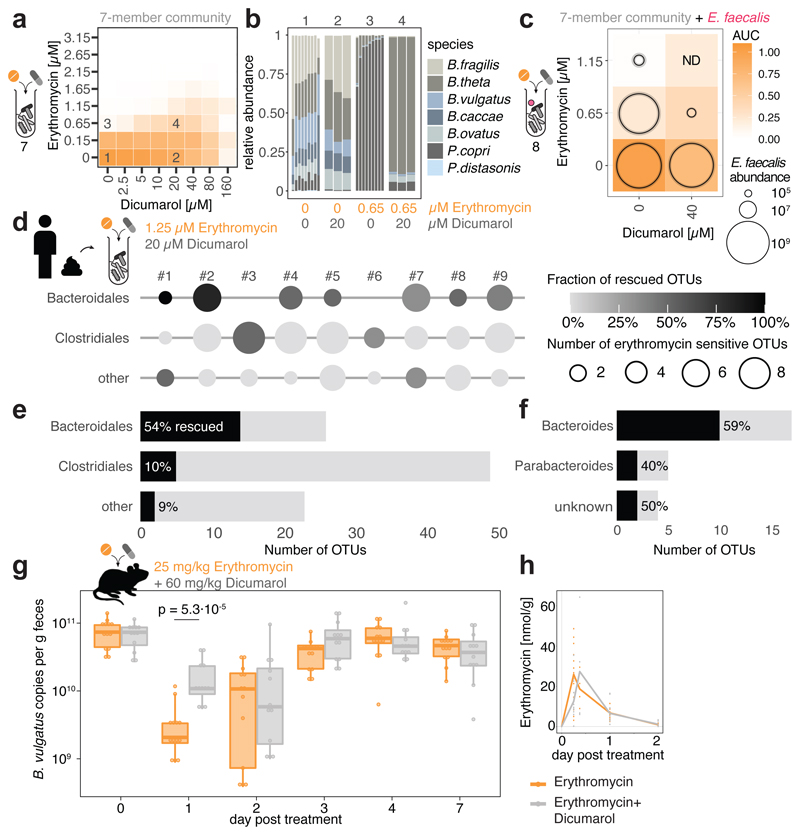
Antibiotics are used to fight pathogens but also target commensal bacteria, disturbing the composition of gut microbiota and causing dysbiosis and disease1. Despite this well-known collateral damage, the activity spectrum of different antibiotic classes on gut bacteria remains poorly characterized. Here we characterize further 144 antibiotics from a previous screen of more than 1,000 drugs on 38 representative human gut microbiome species2. Antibiotic classes exhibited distinct inhibition spectra, including generation dependence for quinolones and phylogeny independence for β-lactams. Macrolides and tetracyclines, both prototypic bacteriostatic protein synthesis inhibitors, inhibited nearly all commensals tested but also killed several species. Killed bacteria were more readily eliminated from in vitro communities than those inhibited. This species-specific killing activity challenges the long-standing distinction between bactericidal and bacteriostatic antibiotic classes and provides a possible explanation for the strong effect of macrolides on animal3-5 and human6,7 gut microbiomes. To mitigate this collateral damage of macrolides and tetracyclines, we screened for drugs that specifically antagonized the antibiotic activity against abundant Bacteroides species but not against relevant pathogens. Such antidotes selectively protected Bacteroides species from erythromycin treatment in human-stool-derived communities and gnotobiotic mice. These findings illluminate the activity spectra of antibiotics in commensal bacteria and suggest strategies to circumvent their adverse effects on the gut microbiota.


Conflict of interest statement

Competing interests

EMBL has filed a patent on using the antidotes identified in this study for prevention and/or treatment of dysbiosis and for microbiome protection (European patent application number EP19216548.8). LM, CVG, EC and AT are listed as inventors.

Figures

Extended Data Figure 1
Extended Data Figure 1. Effects of 144 antibiotics on 40 human gut commensals
Heat map according to sensitivity or resistance of each strain to the respective antibiotic at a concentration of 20 μM. Antibiotics are grouped according to drug classes and species are clustered according to their responses across the 144 antibiotics tested. Data is replotted from. Of note, Akkermansia muciniphila, a species associated with protection against different diseases and dysbiotic states, and even positive responses to immunotherapy, is resistant to nearly all quinolone antibiotics (red box). We consolidated this finding by MIC determination for Ciprofloxacin (>32 μg/ml), Gatifloxacin (>32 μg/ml), Moxifloxacin (>32 μg/ml), Norfloxacin (>256 μg/ml) and Ofloxacin (>32 μg/ml).
Extended Data Figure 2
Extended Data Figure 2. MICs for 20 species/27 strains on 35 antimicrobials
Heat map depicts MICs for each drug-strain pair in μg/ml. Heat map color gradient is adjusted to the MICs concentration range tested on the respective MIC test strip. Black depicts sensitivity and light grey resistance. Mean values across two biological replicates are shown (Suppl. Table 4). The species/strains from the screen are shown in black, additional strains to investigate intraspecies and intragenus variation within the Bacteroides genus are shown in blue. The grey background indicates that several strains per species were tested. Of note, C. difficile is particularly resistant to all tested macrolides and clindamycin (red box).
Extended Data Figure 3
Extended Data Figure 3. MIC dataset validates antibiotic sensitivity profiles from the screen and is consistent with publically available MICs
a. Receiver operating characteristic (ROC) curve analysis was performed to evaluate sensitivity and specificity of the screen using the MIC dataset. Results from the screen were considered as validated if MICs were below/above the 20 μM antibiotic concentration that was tested in the screen (allowing a two-fold error margin). N is the number of antibiotics that we tested both in the screen and determined MICs for; AUROC is the area under the characteristic ROC. TN denotes true negatives, FP false positives, TP true positives, FN false negatives. b. Comparison including Spearman correlation coefficients of the MICs from this study to MICs from the ChEMBL and EUCAST databases. Panels in the upper row: comparison between all MICs that are shared between the two indicated datasets. Panels in the lower row: comparison of the 69 MICs that are shared across all three datasets. Despite experimental differences, our MICs correlate well with available EUCAST/ChEMBL data. c. Number of the sum of new (this study) and already available MICs (EUCAST/ChEMBL) per drug according to antibiotic class and prevalence/virulence of the bacterial species. The new dataset expands MICs across the board and specifically fills the knowledge gap on non-pathogenic species.
Extended Data Figure 4
Extended Data Figure 4. Antibiotic classes exhibit distinct behaviours in gut bacterial species
a. Number of inhibited strains per antibiotic class (number of tested drugs per class in brackets). In total 40 strains were tested at a 20 μM antibiotic concentration. Boxes span the IQR and whiskers extend to the most extreme data points up to a max of 1.5 times the IQR. b. Number of inhibited strains per (fluoro-)quinolone drug generation. Number of tested drugs per generation is indicated in brackets - boxplots as in a. c-d. Overview of the number of drugs tested per β-lactam subclasses on Bacteroides species (spp) in screen (c) and for MICs (d). e. Heat map of phylogenetic relationship between Bacteroides spp (upper triangular matrix) ordered by phylogeny and their resistance profiles across β-lactam antibiotics (lower triangular matrix). Colors represent the pairwise phylogenetic distance and the Euclidean distance on the log2 transformed MICs for β-lactams. Examples of strains from the same species (B. fragilis / B. uniformis) that respond differently to β-lactam antibiotics, are highlighted.
Extended Data Figure 5
Extended Data Figure 5. Selective killing of macrolides and tetracyclines
a. Time-kill curves. The survival of 12 abundant gut microbes was assessed over a 5 hour-treatment with either erythromycin, azithromycin or doxycycline. The graph shows the mean±SD of 3 independent experiments. b. Live/dead staining of macrolide or tetracycline-treated E. coli ED1a and B. vulgatus. The left panel shows an overlay of phase contrast and fluorescence microscopy images of propidium iodide (PI)-stained E. coli ED1a or B. vulgatus before and 5 hours after erythromycin, azithromycin or doxycycline treatment. Cultures were concentrated before imaging; the scale bar is 10 μm. The right panel shows the corresponding quantification of live/dead-stained cells by flow cytometry with Sy to 9 on the x-axis (live cells) and PI on the y-axis (dead cells). As E. coli ED1a cells stain poorly with Sy to 9, we only quantified PI stained cells in this case. Both the total number of measured events (n) and the percentage of cells found in each region of the graph are indicated.
Extended Data Figure 6
Extended Data Figure 6. Assessing potential confounding factors for the killing capacities of erythromycin, azithromycin and doxycycline
a. Scatter plot of individual bacterial growth rates (μ) and percentage survival after a 5-hour treatment with 5-fold MIC of erythromycin, azithromycin or doxycycline. ris the Spearman correlation coefficient. Tested species are color-coded here and, in all panels thereafter as indicated at the bottom of this figure. b. B. fragilis (blue), F. nucleatum (beige), P. copri (pink) and E. coli ED1a (grey) survival was assessed after a 5h erythromycin and azithromycin treatment (5-fold MIC) at 30°C (slow growth) and 37°C (fast growth) - mean±SD of three independent experiments. No monotonic trend was observed. c. Scatter plot of MICs and % survival after a 5h treatment with 5-fold MIC of erythromycin, azithromycin or doxycycline. r is the Spearman correlation coefficient. Doxycycline exhibited a significant (p-value=0.0015) anti-correlation, i.e. more sensitive species to doxycycline (lower MIC) survived better when treated with antibiotic. Therefore, we tested further whether increasing the drug concentration in sensitive strains increased killing (panel d). d. B. fragilis (blue) and F. nucleatum (beige) survival after a 5-hour treatment as function of increasing doxycycline concentrations (mean±SD of three independent experiments). No significant differences observed. In all cases doxycycline remained bacteriostatic. Significance calculated by unpaired two-sided t-test here and in all panels thereafter. e. To evaluate whether outgrowth from stationary phase affected our results, we selected two slow-growing strains, E. rectale (green) and R. intestinalis (orange) and grew them for 2 or 3h after diluting from an overnight culture to an of OD578 0.01. Both strains were then treated for 5h with 5-fold MIC of erythromycin, azithromycin or doxycycline and their survival was assessed (mean±SD of three independent experiments). Although 3h grown cultures were killed slightly more effectively (difference is not statistically significant due to low number of replicates), this did not change the bactericidal or bacteriostatic characteristic of antibiotics. If anything, this means that we underestimate the killing for slow-growers, since all other experiments were performed with 2 h outgrowth. Nd: not detected (detection limit: 1 CFU/ml.) f-g. The survival of 8 selected gut microbes was measured after treating cells in exponential phase (E – 2h after dilution from an overnight culture) or in stationary phase (S – overnight growth) with 5-fold MIC of erythromycin (f) or doxycycline (g) for 5h (mean±SD of three independent experiments). Consistent with the knowledge that antibiotic killing requires active growth, survival is higher in stationary phase for most strains (but not all – see F. nucleatum) that erythromycin or doxycycline kills. ns = non-significant; *, ** and *** denote p-value <0.05, <0.01 and <0.001, respectively. nd as in e. h. E. coli ED1a survival was assessed after 5h treatment with 5-fold MIC of doxycycline in the presence or absence of oxygen. Killing was similar in both conditions.
Extended Data Figure 7
Extended Data Figure 7. Identification and validation of macrolide and tetracycline antagonists (antidotes) in B. vulgatus and B. uniformis
a. Schematic illustration of combinatorial screen concept: searching for antidote compounds that antagonize the antibacterial effect of erythromycin or doxycycline on commensal but not on pathogenic bacteria. b. Z-scores on bacterial growth for combinatorial drug exposure with antibiotic and 1197 FDA-approved drugs of Prestwick library (2 replicates). Compounds that successfully protected B. vulgatus and/or B. uniformis in the presence of antibiotic (z-score > 3) are indicated in gray. The strongest hits (circles) were validated in concentration-dependent assays (c-d). Box plots as in Fig. 1c. c. Validation of the strongest antagonistic interactions in independent experiments. Erythromycin and doxycycline concentrations were kept constant for each species and concentration ranges were tested for antagonist. Asterisks indicate that at least 25% of the bacterial growth (compared to no drug controls) could be rescued by the antagonist at a given concentration. Heat map depicts median growth across triplicates. d. For 10 of the validated antagonists, 8 x 8 checkerboard assays were performed to define better the range of the antagonistic interaction. Heat maps depict bacterial growth based on normalized median of AUCs of 3-4 replicates. Antagonistic interactions are framed in red (all). e. Percentage of surviving B. vulgatus cells were determined after 5h incubation with either erythromycin (3.25 μM) or doxycycline (0.4 μM) alone or in presence of benzbromarone (40 μM), dicumarol (20 μM), tolfenamic acid (40 μM) or diflunisal (80 μM). Data is based on three independent experiments. Boxplots are plotted as in Fig. 1c.
Extended Data Figure 8
Extended Data Figure 8. Schematic overview of screen for microbiome-protective antibiotic antidotes
Workflow with decision process on which erythromycin and doxycycline antagonists to move on to next evaluation step.
Extended Data Figure 9
Extended Data Figure 9. Antidotes work on further gut commensals, but do not compromise antibiotic efficacy on relevant pathogens
a. 8 x 8 checkerboard assays to investigate if antidote is also protective for additional gut commensals. All combinations were tested in MGAM medium under anaerobic conditions. Heat map depicts bacterial growth based on median AUCs from 2-3 independent replicates. Concentrations are stated in μM. b. 8 x 8 checkerboard assays to evaluate antidote effects on the activity of erythromycin and doxycycline in relevant pathogenic species. The gastrointestinal pathogens E. faecalis and E. faecium were tested under anaerobic conditions. S. aureus, a cause of extra-intestinal infections, such as bacteremia and infective endocarditis, was tested under aerobic conditions. Heatmaps depict mean normalized AUCs of three biological replicates. Antidotes exhibit either neutral or even slight synergistic effects with antibiotics. c. Dicumarol rescues commensal growth (n=2, anaerobic conditions) in a concentration-dependent manner. Erythromycin still retains its activity against pertinent pathogens such as E. faecium, E. faecalis (n=3, anaerobic conditions) and S. aureus (n=3, aerobic conditions) - see Suppl. Table 1 for strains used. 0.65 μM (~0.5 μg/ml) erythromycin is within range of the MIC breakpoints for Staphylococcus (1 μg/ml) and Streptococci groups A, B, C & G (0.25 μg/ml). Error bars depict standard deviation.
Extended Data Figure 10
Extended Data Figure 10. The antidote benzbromarone selectively protects Bacteroides species from erythromycin in microbial communities
a. The same7-member synthetic gut microbial community as in Fig. 3a can be protected from erythromycin by the antidote benzbromarone. Heatmaps depict median bacterial growth based on normalized AUCs of the community of three replicates. b. Community compositions in selected erythromycin-benzbromarone concentration combinations (1-4 referring to checkerboard tiles in a) demonstrate that benzbromarone alone does not alter the community structure, but rescues some Bacteroides species and largely the community composition from erythromycin treatment. Depicted as in Fig. 3b - control and erythromycin alone experiments same as in Fig. 3b. c. When the Bacteroidales community contains the pathogen E. faecalis, benzbromarone rescues community growth upon erythromycin treatment, but enhances the ability of erythromycin to target E. faecalis. Plotted as in Fig. 3c. d-f. In complex human-stool derived communities from nine healthy donors (column #1 – 9), benzbromarone protects 65% of Bacteroidales OTUs from erythromycin, and at least one Bacteroidales OTU per individual (2 biological X 2 technical replicates). Plotted as in Fig. 3d. The fractions of rescued OTUs per order (e) and for Bacteroidales OTUs per genus (f) across all nine donors indicate that primarily Bacteroides species are rescued. g. In gnotobiotic mice colonized with a defined 12-member mouse microbiome and B. vulgatus, administration of benzbromarone slightly (albeit not significantly, two-sided Mann-Whitney U test) mitigates the temporal decrease in fecal B. vulgatus counts that erythromycin causes. Mice received a single oral dose of erythromycin (N=9) or erythromycin + benzbromarone (N=9) in two independent experiments. Data of the erythromycin-treated group is partially overlapping with data shown in Fig. 3g as experiments were conducted in parallel. Boxes are plotted as in Fig. 1c. h. Both groups of mice show similar fecal erythromycin concentrations over the course of the experiment shown in g.
Extended Data Figure 11
Extended Data Figure 11. The antidote tolfenamic acid protects Bacteroides species from erythromycin in microbial communities
a. Tolfenamic acid rescues commensal growth (based on median AUCs, N=2) at clinical relevant erythromycin concentrations in a concentration-dependent manner (anaerobic conditions). Erythromycin still retains its activity against pertinent pathogens such as E. faecium, E. faecalis (based on median AUCs, N=3, anaerobic conditions) and S. aureus ([erythromycin]=0.14 μM, N=3, aerobic conditions). Error bars depict standard deviation. b. The same 7-member synthetic gut microbial community as in Fig. 3a can be protected from erythromycin by the tolfenamic acid. Heat maps depict median bacterial growth based on normalized AUCs of the community of 3 replicates. c. Community compositions in selected erythromycin-tolfenamic acid concentration combinations (1-4 referring to checkerboard tiles in b) demonstrate that tolfenamic acid alone does not alter the community structure, but rescues some Bacteroides species and largely the community composition from erythromycin treatment. Depicted as in Fig. 3b – control and erythromycin alone experiments same as in Fig. 3b. d-f. In complex human-stool derived communities from 9 healthy donors (column #1 – 9), tolfenamic acid can rescue 42% of the erythromycin-sensitive Bacteroidales OTUs (2 biological X 2 technical replicates). Data is plotted as in Fig. 3d. Bars depict the absolute numbers of erythromycin-sensitive OTUs and the percentage of rescued OTUs per order (e) or genus (f) across all nine individuals.
Figure 1
Figure 1. Activity spectrum of antibiotic classes on human gut commensals
a. Overview of antibiotics tested in initial screen at 20 μM concentration and validated by MIC determination in this study. b. Comparison of measured MICs (dark grey) to available ones from public databases (light grey). Shaded areas represent the overlap. Species are classified as “common” if they are present in the gut microbiome of more than 1% of 727 healthy individuals. c. MICs of drug-species pairs per antibiotic class (color scheme as in a) are depicted next to EUCAST clinical (susceptibility) breakpoints for pathogens. Numbers of drug-species pairs (MICs; colored) and antibiotic per class (EUCAST clinical breakpoints; grey) are shown in brackets. Boxes span the IQR and whiskers extend to the most extreme data points up to a max of 1.5x IQR, y-axis is log2 scale.
Figure 2
Figure 2. Macrolides and tetracyclines kill some human gut commensal species
a. The survival of 12 abundant human gut microbial species was measured after 5h treatment with erythromycin, azithromycin or doxycycline at 5-fold MIC concentrations (mean+SD of 3 independent experiments). CFUs/ml before treatment were set to 100%. Absolute values are indicated next to strain abbreviations – Bf: B.fragilis; Bu: B.uniformis; Bt: B.thetaiotaomicron; Bo: B.ovatus; Bc: B.caccae; Bv: B.vulgatus; Pc: P.copri; Ec: E.coli ED1a; Fn: F.nucelatum; Cb: C.bolteae; Er: E.rectale; Ri: R.intestinalis. Shaded area denotes bactericidal threshold; nd "not detected" (detection limit: 1 CFU/ml); “*“ resistant strains. Species are plotted according to phylogeny. b. Erythromycin causes lysis in B. vulgatus and B. uniformis. Strains were grown for 3h (arrow) before adding (orange) or not (black) 15 μg/ml erythromycin (5-fold MIC). Growth curves depict mean±SD (dashed line) of 3 independent experiments. c. Erythromycin induces blebbing, cytoplasmic shrinkage and lysis (white arrows) in B. vulgatus and B. uniformis. Represenative images of phase contrast videos (Supplementary Material) acquired after erythromycin treatment; scale bar5 μm. d. The commensal E. coli ED1a is more susceptible to doxycycline killing than lab E. coli (BW25113), despite both strains having same MIC (4 μg/ml). Survival of E. coli strains was measured in monocultures or as part of 12-member communities (all species from panel a) after 5h treatment with 5-fold MIC doxycycline (mean±SD of 3-6 independent experiments). CFUs/ml before treatment were set to 100%. e.E. coli ED1a, but not BW25113, is eliminated from community after two rounds of doxycycline treatment. A 12-member community (same as d) containing either E. coli ED1a or BW25113 was treated with doxycycline for 5h (5-fold E. coli MIC), washed with PBS, treated again with doxycycline, and re-grown in MGAM. CFUs/ml were counted to assess community (dashed lines) and E. coli (solid lines) survival - shown the mean±SD of 3 independent experiments.
Figure 3
Figure 3. Dicumarol selectively protects Bacteroides species from erythromycin in microbial communities
a. Checkerboard assay with a synthetic 7-member gut microbial community of Bacteroidales species (B. caccae, B. fragilis NT, B. ovatus, B. thetaiotaomicron, B. vulgatus, P. copri, P. distasonis) indicates that dicumarol rescues overall community growth. Heat map depicts median growth across triplicates. b. Community compositions in selected erythromycin-dicumarol concentration combinations (1-4 referring to checkerboard tiles in a) demonstrate that dicumarol alone does not alter community structure, but rescues Bacteroides species from erythromycin (primarily B. thetaiotaomicron and B. ovatus, consistent with Extended Data Fig. 9a). Depicted are relative abundances of individual replicates as determined by 16S rRNA sequencing and rescaled to 100%. c. When the Bacteroidales community contains the pathogen E. faecalis, the antidote dicumarol rescues community growth upon erythromycin treatment, but allows erythromycin to still target E. faecalis (even enhances its activity). Tiles show medians of normalized community growth and circles within tiles represent the mean±SD CFU/ml of E. faecalis (3 biological X 2 technical replicates; initial inoculum: 1.25·106 CFU/ml). ND: not detected (detection limit:104 CFU/ml). d-f. In complex human-stool derived communities from 9 healthy donors, dicumarol protects most Bacteroidales Operational Taxonomic Units from erythromycin (per order – e; per genus – f), and at least one Bacteroidales OTU per individual. Circle diameter depicts the number of OTUs per order inhibited by erythromycin, and gradient fill the fraction of these OTUs rescued by dicumarol (2 biological X 2 technical replicates). All Bacteroidales of donors #3 and #6 are resistant to the erythromycin concentrations used. g. Administration of dicumarol mitigates the decrease in fecal B. vulgatus counts that erythromycin causes in gnotobiotic mice colonized with a 12-member mouse microbiome and B. vulgatus. The mice were treated once orally with either erythromycin (N=13) or erythromycin/dicumarol (N=12) in three independent experiments. Boxes are plotted as in Fig. 1c. Only p-values for significant differences (two-sided Mann-Whitney U test) between two groups of mice at same day are shown. h. Fecal erythromycin concentrations and kinetics do not differ between the two groups of mice.

References

    1. Blaser MJ. Antibiotic use and its consequences for the normal microbiome. Science. 2016;352:544–545. doi: 10.1126/science.aad9358. - DOI - PMC - PubMed
    1. Maier L, et al. Extensive impact of non-antibiotic drugs on human gut bacteria. Nature. 2018;555:623–628. doi: 10.1038/nature25979. - DOI - PMC - PubMed
    1. Cho I, et al. Antibiotics in early life alter the murine colonic microbiome and adiposity. Nature. 2012;488:621–626. doi: 10.1038/nature11400. - DOI - PMC - PubMed
    1. Cox LM, et al. Altering the intestinal microbiota during a critical developmental window has lasting metabolic consequences. Cell. 2014;158:705–721. doi: 10.1016/j.cell.2014.05.052. - DOI - PMC - PubMed
    1. Ruiz VE, et al. A single early-in-life macrolide course has lasting effects on murine microbial network topology and immunity. Nat Commun. 2017;8:518. doi: 10.1038/s41467-017-00531-6. - DOI - PMC - PubMed

(Method part)

    1. Milanese A, et al. Microbial abundance, activity and population genomic profiling with mOTUs2. Nat Commun. 2019;10:1014. doi: 10.1038/s41467-019-08844-4. - DOI - PMC - PubMed
    1. Feng Q, et al. Gut microbiome development along the colorectal adenoma-carcinoma sequence. Nat Commun. 2015;6:6528. doi: 10.1038/ncomms7528. - DOI - PubMed
    1. Vogtmann E, et al. Colorectal Cancer and the Human Gut Microbiome: Reproducibility with Whole-Genome Shotgun Sequencing. PLoS One. 2016;11:e0155362. doi: 10.1371/journal.pone.0155362. - DOI - PMC - PubMed
    1. Wirbel J, et al. Meta-analysis of fecal metagenomes reveals global microbial signatures that are specific for colorectal cancer. Nat Med. 2019;25:679–689. doi: 10.1038/s41591-019-0406-6. - DOI - PMC - PubMed
    1. Yu J, et al. Metagenomic analysis of faecal microbiome as a tool towards targeted non-invasive biomarkers for colorectal cancer. Gut. 2017;66:70–78. doi: 10.1136/gutjnl-2015-309800. - DOI - PubMed

Publication types

MeSH terms