. 2021 Oct;598(7881):510-514.
doi: 10.1038/s41586-021-03965-7. Epub 2021 Oct 13.

Mutant clones in normal epithelium outcompete and eliminate emerging tumours

Affiliations

Mutant clones in normal epithelium outcompete and eliminate emerging tumours

B Colom et al. Nature. 2021 Oct.

Abstract

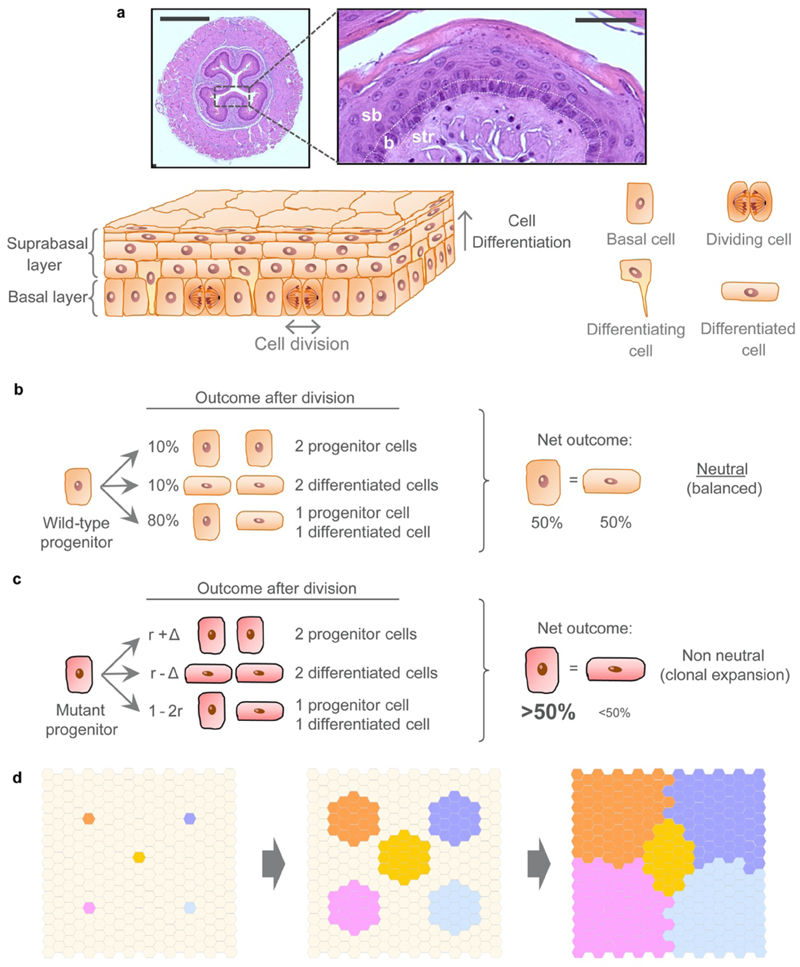
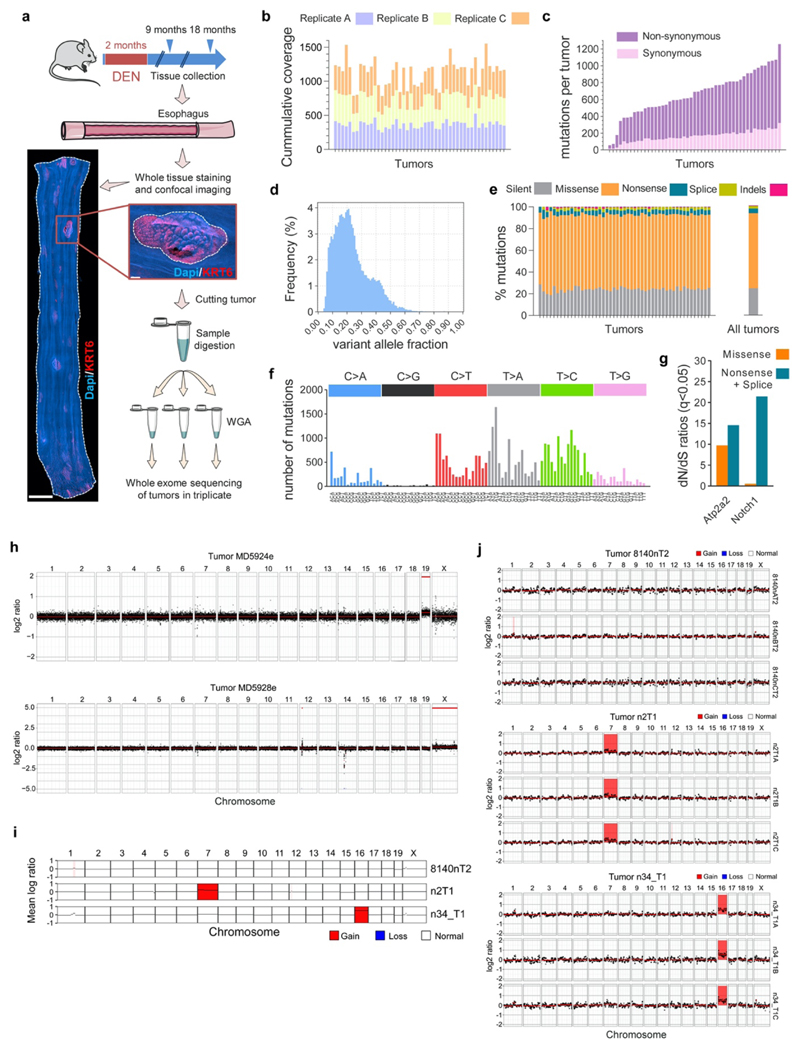
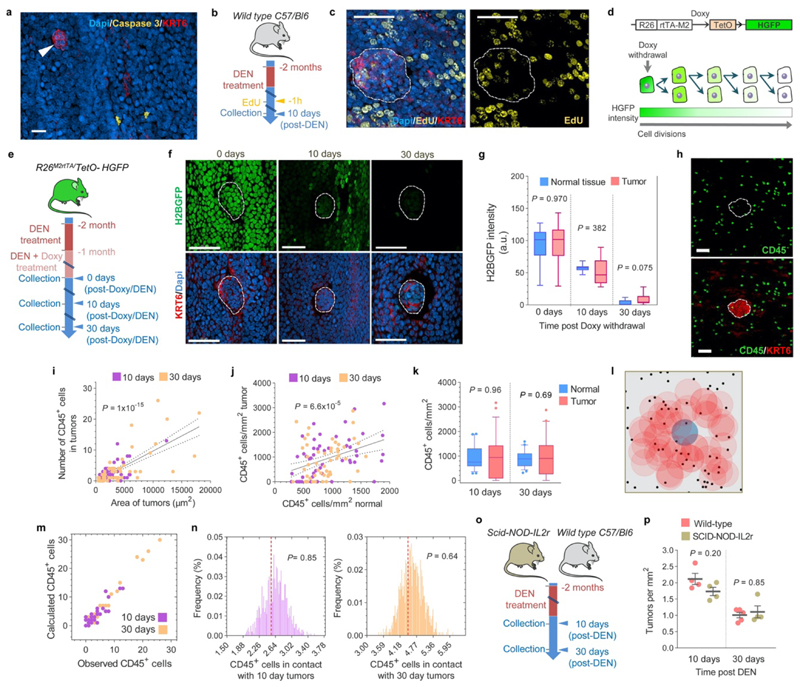
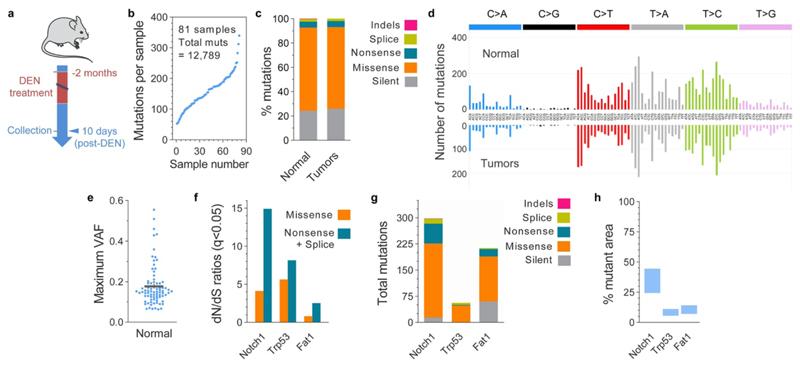
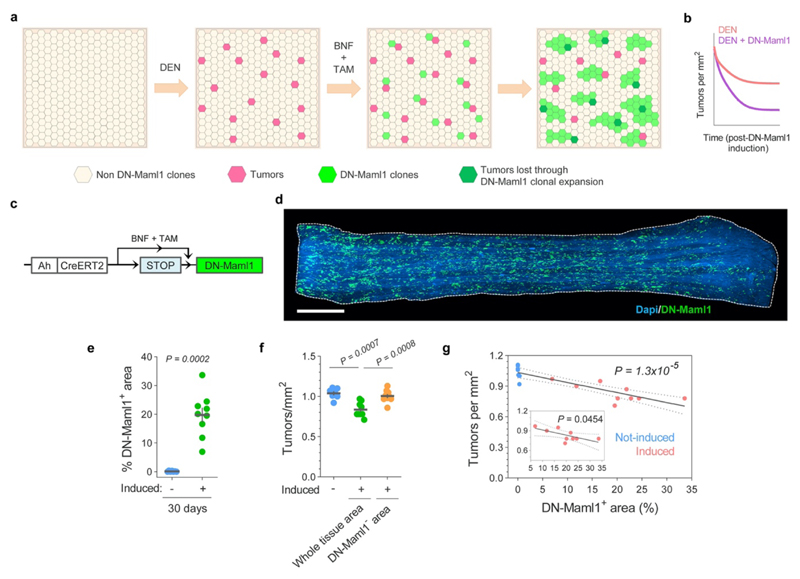
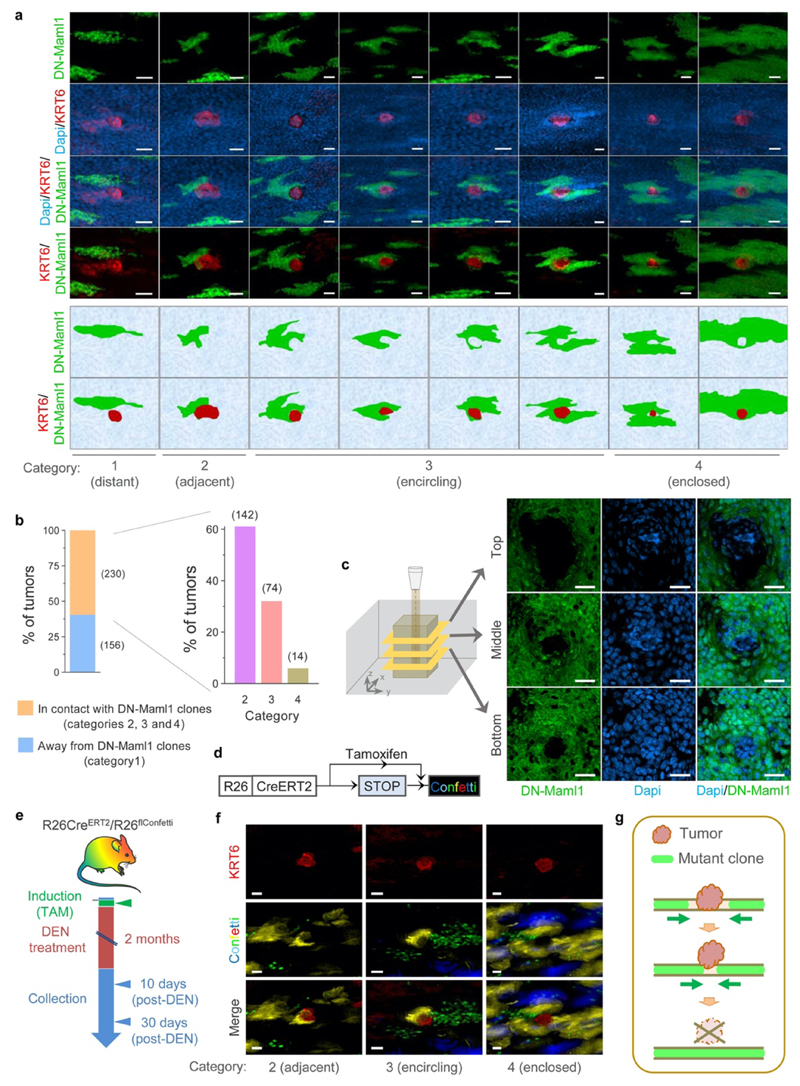
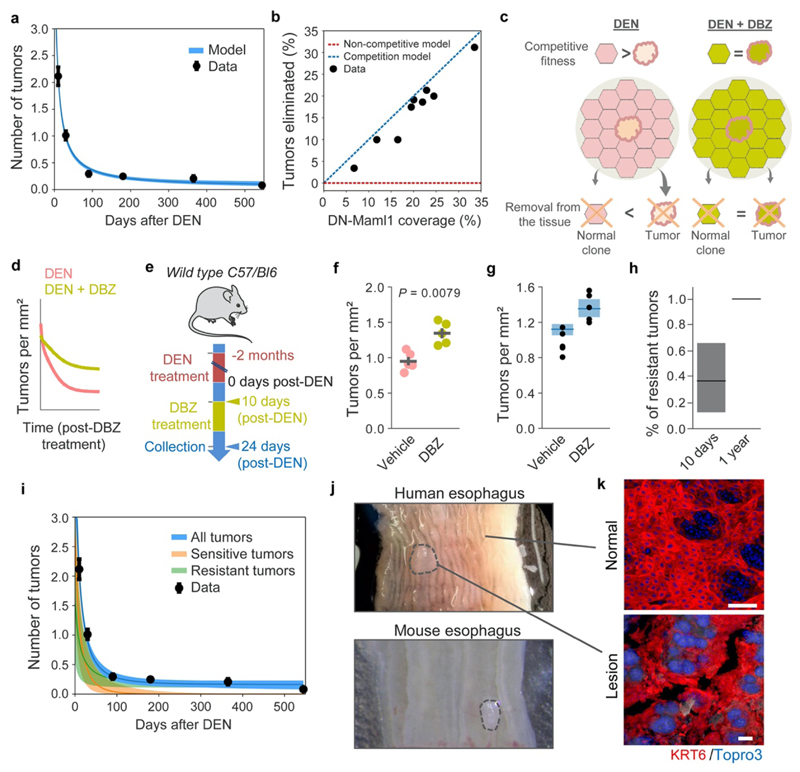
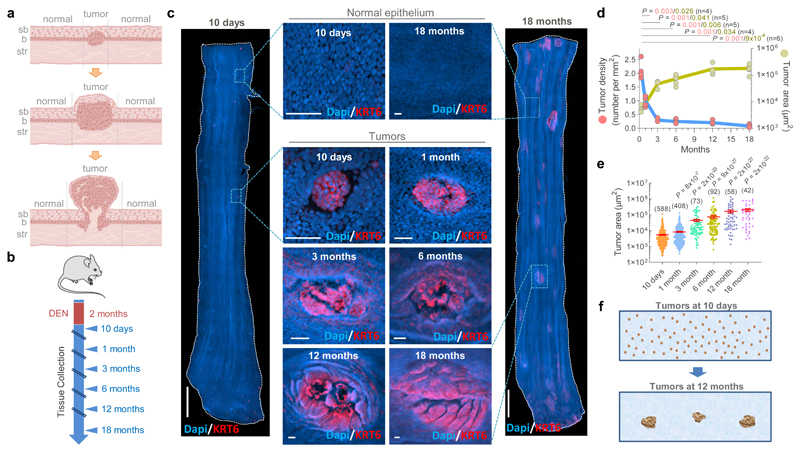
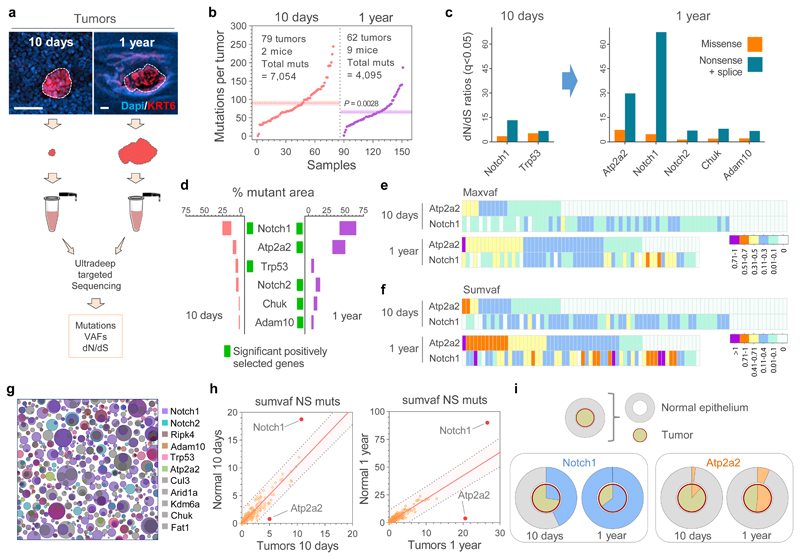
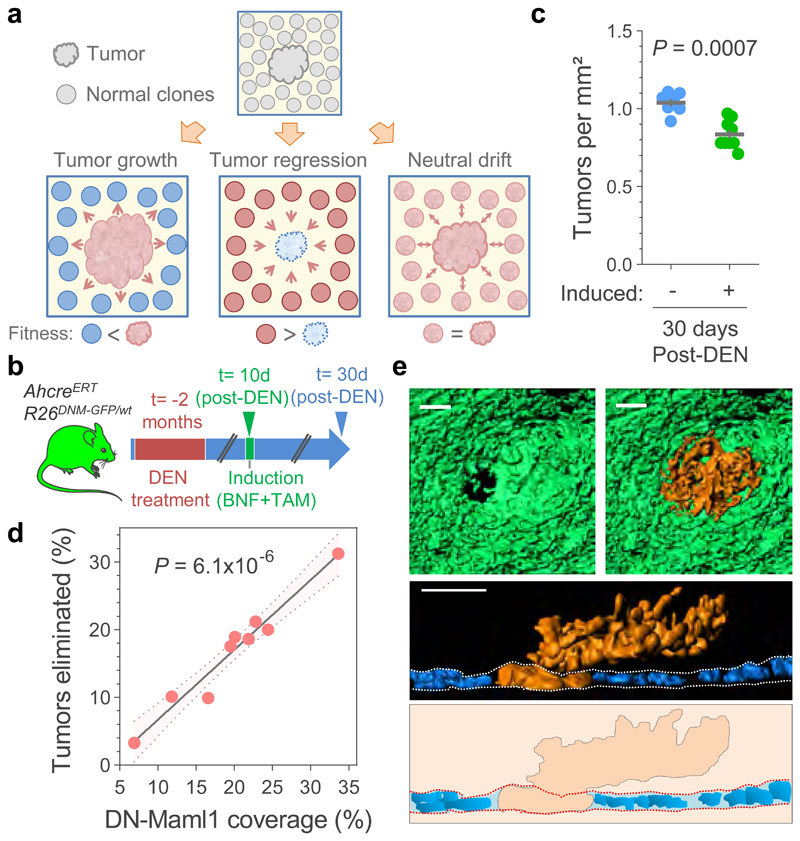
Human epithelial tissues accumulate cancer-driver mutations with age1-9, yet tumour formation remains rare. The positive selection of these mutations suggests that they alter the behaviour and fitness of proliferating cells10-12. Thus, normal adult tissues become a patchwork of mutant clones competing for space and survival, with the fittest clones expanding by eliminating their less competitive neighbours11-14. However, little is known about how such dynamic competition in normal epithelia influences early tumorigenesis. Here we show that the majority of newly formed oesophageal tumours are eliminated through competition with mutant clones in the adjacent normal epithelium. We followed the fate of nascent, microscopic, pre-malignant tumours in a mouse model of oesophageal carcinogenesis and found that most were rapidly lost with no indication of tumour cell death, decreased proliferation or an anti-tumour immune response. However, deep sequencing of ten-day-old and one-year-old tumours showed evidence of selection on the surviving neoplasms. Induction of highly competitive clones in transgenic mice increased early tumour removal, whereas pharmacological inhibition of clonal competition reduced tumour loss. These results support a model in which survival of early neoplasms depends on their competitive fitness relative to that of mutant clones in the surrounding normal tissue. Mutant clones in normal epithelium have an unexpected anti-tumorigenic role in purging early tumours through cell competition, thereby preserving tissue integrity.


Conflict of interest statement

Competing interests: Authors declare no competing interests.

Figures

Extended Data Figure 1
Extended Data Figure 1. Architecture and dynamics of murine esophageal epithelium.
(a) H&E images and schematic of the mouse esophageal epithelium architecture and dynamics; b = basal cell layer (delineated by white dots), sb = suprabasal layers, str = stroma. Scale-bars: 500μm (left image), 50μm (inset). Dividing (progenitor) cells are confined to the basal layer. Differentiating cells exit the cell cycle, migrate out of the basal layer, through the suprabasal layers, and are finally shed into the lumen. (b-c) The single progenitor model (see Supplementary Note). All progenitor cells in the basal layer are functionally equivalent and following division produce either: two progenitors that will persist in the tissue, two differentiating cells that will cease division, stratify and be lost, or one cell of each type. In homeostasis (b), the likelihood of the two progenitor and two differentiating cell outcomes is equal. Mutations (c) may tip the balance towards a non-neutral behavior, resulting in clonal growth if they favor proliferation of daughter cells. (d) Expansion of mutant clones is defined by their relative competitive fitness to adjacent clones. Initially, a fit “winner” mutant progenitor (colored) shows a fate bias towards proliferation and outcompetes its less fit “loser” surrounding cells, resulting in clonal expansion. Eventually, mutant clones begin to collide with each other until surrounded by similarly competitive mutants, at which point their cell fate reverts towards balance and their expansion slows (see Supplementary Note).
Extended Data Figure 2
Extended Data Figure 2. Characterization of Diethyl Nitrosamine (DEN) generated tumors.
(a, b) Confocal images of esophagus collected 10 days post-DEN treatment and stained with Dapi and KRT6. Images show top-down (a, b) and lateral (b) projections and illustrate typical morphological features and expression of KRT6 in tumors (arrowheads) and normal surrounding epithelium. (c) Quantification of the mean fluorescence intensity of KRT6 and Dapi in 10 days post-DEN tumors and the adjacent normal epithelium, measured from the images as shown. Two-sided Mann-Whitney test, n=48 tumors from 3 mice. (d) Percentage of tumors positive for KRT6 staining. The number of tumors analyzed for each time point is shown between brackets. (e) Confocal images of 10-days and 12-months post-DEN tumors showing increased expression of KRT17 (green). Images are representative of 31 and 29 tumors, from 3 and 7 mice, respectively. (f) H&E images of esophageal tumors (bottom images) and normal epithelium (top images) from tissues collected at the indicated time points post-DEN treatment. (g) Percentage of angiogenic tumors at the indicated time points post-DEN treatment. The number of tumors analyzed at each time point is shown in brackets. (h, i) Projected top-down and lateral confocal images of 10 day (h) and 9 months (i) post-DEN tumors immuno-stained for the endothelial cell marker CD31 and KRT6. Images are representative of 18 and 6 tumors, respectively. Scale-bars for panels (a-c), (e-f) and (h-i) are 50μm.
Extended Data Figure 3
Extended Data Figure 3. Collection of 10-day and 1-year esophageal tumors.
(a-b) Mouse esophagus was collected 10-days (a) or 1-year (b) post-DEN treatment. The esophagus was cut open longitudinally and the epithelium separated from the underlying muscle and stroma. The epithelium was flattened, fixed, stained with KRT6 (grey), mounted and 3D-imaged on a confocal microscope. Tumors were identified from the processed images and manually dissected under a fluorescent microscope and sequenced (see Methods).
Extended Data Figure 4
Extended Data Figure 4. Targeted sequencing of 10 days and 1 year tumors.
(a) Protocol: wild-type mice were treated with DEN for two months and the esophageal tumors collected 10-days or 1-year later. Tumors were then sequenced with a targeted approach (192 gene panel). (b) Area of 10-day and 1-year post-DEN tumors (n=89 and 64 tumors from 2 and 9 mice, respectively). Lines show mean ± s.e.m. (c) Mutational spectrum of 10-day and 1-year tumors. The bar plots illustrate the number of mutations in each of the 96 possible trinucleotides. The mutational spectrum of individual tumors is shown in (d). (e-f) Percentage of silent, missense, nonsense and splice mutations and indels identified in 10-day or 1-year tumors. Graphs show the values for individual tumors (e, each column is a tumor), or the average for all tumors at each time point (f). (g) Maximum VAF for mutations identified in each tumor at 10 days or 1 year post-DEN (n=80 and 63 tumors, respectively). Colored shadow illustrates VAF > 0.35, as an estimation for clonality. (h) Number of positively selected mutant genes in tumors at 10 days or 1 year post-DEN treatment (n=80 and 63 tumors, respectively). Lines show mean±s.e.m (two-tailed Mann-Whitney test). (i) Number and type of mutations in the positively selected genes identified by dN/dS analysis from 10-day or 1-year tumors. (j) Proportion of 10-day and 1-year tumors carrying nonsynonymous mutations in the indicated genes.
Extended Data Figure 5
Extended Data Figure 5. Whole exome sequencing, whole genome sequencing, and chromosomal alteration of surviving tumors.
(a) Wild-type mice received DEN for two months and the esophagus was collected 9 or 18 months after treatment (n=49 tumors from 16 mice). Tissues were stained for Dapi (blue) and KRT6 (red) and confocal imaged to identify tumors. Scale-bars=2mm (main), 150μm (inset). Individual tumors were manually cut under a fluorescent microscope, digested and separated in triplicates. Each triplicate was whole genome amplified (WGA) and whole exome sequenced. To exclude artefactual SNVs generated during WGA, only mutations shared by all three amplified triplicates were considered for further analysis. A total of 32,736 mutations, including silent, missense, nonsense and splice mutations and indels were identified. (b) Cumulative sequencing coverage of the whole exome triplicate samples. (c) Number of synonymous and non-synonymous mutations per tumor, ranked by mutation burden. (d) Distribution of the variant allele fraction (VAF) for the mutations common within triplicates in each tumor. (e) Percentage of silent, missense, nonsense and splice mutations and indels for individual tumors and for all tumors combined. (f) Mutational spectrum of tumors. The bar plots illustrate the percentage of mutations in each of the 96 possible trinucleotides. (g) dN/dS ratios for missense and truncating (nonsense + essential splice site) substitutions indicating genes under significant positive selection in the tumors (q<0.05, calculated with R package dNdScv). (h) Analysis of chromosomal copy number alterations (CNAs) by whole genome sequencing of 1-year post-DEN tumors (n=64 tumors from 9 mice). Only 2 tumors, MD5924e and MD5928e, exhibited CNAs. (i) Summary of chromosomal alterations found by whole exome sequencing data of 9 or 18 months post-DEN tumors (n=49 tumors from 16 mice). Only alterations present in all 3 whole genome amplified triplicates (j) were considered valid calls. 8140nT2 (top) is a representative example of a tumor without chromosomal alterations. 2 tumors, n2T1 and n34_T1, showed small alterations.
Extended Data Figure 6
Extended Data Figure 6. Early tumors are not eliminated by tumor cell apoptosis, abnormal proliferation or the immune system.
(a) Representative confocal image of a 10-day post-DEN esophageal epithelium immuno-stained for activated Caspase 3+ (Yellow) and KRT6 (red). No apoptotic cells were detected in the tumors (arrowhead) (n=23 tumors, 2 mice). Scale-bar: 20μm. (b) Protocol: wild-type mice were treated with DEN for two months and the tissues collected ten days later. Mice received EdU 1h before tissue collection. (c) Representative confocal images showing EdU incorporation (1h pulse) in tumors (dotted line) and the surrounding normal epithelium (n=22 tumors, 3 mice). Scale-bars: 20μm. (d) In vivo label-retaining assay using Rosa26M2rtTA/TetO-HGFP transgenic mice to measure the rate of progenitor cell division (see Methods). (e) Protocol: Rosa26M2rtTA/TetO-HGFP mice received DEN for one month followed by DEN+Doxy for another month. Tissues were collected at times 0, 10 and 30 days after Doxy/DEN withdrawal. (f-g) Representative confocal images (f) and quantification (g) of the histone-green fluorescent protein (H2BGFP) intensity in esophageal tumors (dotted lines) and the surrounding normal epithelium at the indicated time points post-Doxy withdrawal. Scale bars: 50μm. Graph shows median (central box line), 25th-75th percentiles (box) and 5th-95th percentiles (whiskers). Two-tailed Mann-Whitney test (n=10 images per group). (h) Confocal images depicting CD45+ (immune) cells (green) within a 10-days post-DEN tumor (white dotted line) and its adjacent normal epithelium. (i-j) Correlation between the size of tumors and the number of CD45+ cells within them (i) and the number of CD45+ cells in the tumor and the normal epithelium (j). Lines show the two-tailed Pearson correlations: R2=0.5039 (i), and R2=0.1464 (j), with 95% confidence interval (dotted lines). (k) Number of CD45+ cells per area of tumor or normal esophageal epithelium at 10- or 30-days post-DEN treatment. Graph shows median (central box line), 25th-75th percentiles (box), 5th-95th percentiles (whiskers) and outliers (dots). Two tailed Wilcoxon matched-pairs test, n=53 and 50 images, respectively. (l) Permutation analysis of leukocyte location within tumors, based on the experimental measurements obtained from (h). For each image, the location of CD45+ cells (black dots) was left intact while the location of the tumor (colored circles) was randomly shuffled (blue shows original location, red shows shuffled “phantom” tumors), and the number of immune cells in contact with the tumor was counted. This was repeated 1000 times to produce the expected distribution. (m) Calculated (within the original location) vs. experimentally observed number of CD45+ cells in 10- or 30-days post-DEN tumors. (n) Distribution of the average number of CD45+ cells in 10- or 30-days post-DEN tumors, obtained from the permutation analysis in (l). Red dotted line shows the experimentally observed average number of CD45+ cells within tumors at the indicated time-points. Statistics are two-tailed permutation tests (Methods). (o) Protocol: Wild-type and immunocompromised Scid-NOD-IL2r mice were treated with DEN for two months and the tissues collected 10 or 30 days post-DEN withdrawal. (p) Tumor density in mice collected 10-days (n=4) or 30-days (n=5 and 4, respectively) post-DEN treatment. Mean±s.e.m (two-tailed Mann-Whitney test).
Extended Data Figure 7
Extended Data Figure 7. Mutational landscape of normal esophageal epithelium at 10 days post-DEN treatment.
(a) Protocol: wild-type mice were treated for two months with DEN. 10 days after DEN withdrawal, normal epithelial samples matching the size of the tumors (Extended data Fig. 4b) were collected and sequenced with a targeted approach (192 gene panel). (b) Number of mutations per sample, including essential splice, frameshift, missense, nonsense and silent mutations (n=81 samples from 2 mice). (c) Percentage of mutation types identified in normal epithelium and tumors collected 10 days post-DEN treatment. (d) Mutational spectrum of 10-day post-DEN tumors and normal epithelium. The bar plots illustrate the number of mutations in each of the 96 possible trinucleotides. (e) Dots show the value of the mutation with maximum VAF identified in each sample (n=81 samples). Lines are mean ± s.e.m. (f) dN/dS ratios for missense and truncating (nonsense + essential splice site) mutations of positively selected genes (dN/dS >1) (only significant genes are shown, q<0.05 calculated with R package dNdScv). (g) Number and type of mutations in the positively selected genes identified by dN/dS. (h) Estimated percentage of 10 days post-DEN normal epithelium carrying non-synonymous mutations in the positively selected genes. Range indicates upper and lower bound estimates.
Extended Data Figure 8
Extended Data Figure 8. Expansion of highly competitive clones in normal tissue eliminates early tumors.
(a) Cartoon illustrating the elimination of tumors due to competition with the highly competitive DN-Maml1 clones. Following the generation of tumors by DEN treatment, DN-Maml1 clones are induced by BNF and TAM injections. As DN-Maml1 clones in the normal epithelium expand they eliminate less fit tumors. (b) Qualitative representation of tumor dynamics following DN-Maml1 induction as compared to non-induced controls (see Supplementary Note). (c) In vivo genetic lineage tracing using AhcreERT/R26DNM–GFP/wt reporter mice. Upon injection of the drugs tamoxifen (TAM) and ß-napthoflavone (BNF), Cre-mediated recombination results in the heritable expression of the highly competitive dominant negative allele of Maml-1 fused to GFP fluorescent protein (DN-Maml1), which will then be expressed in all the progeny of the single marked cells, generating clusters of labelled mutant clones. (d) Confocal image (representative of 9 mice) of a DEN-treated AhcreERT/R26DNM–GFP/wt mouse whole esophageal epithelium, depicting DN-Maml1 clones (green). Mice were induced ten days after DEN withdrawal and esophagus collected twenty days later (as in Fig. 3b). Scale-bar: 2mm. (e) Percentage of epithelium covered by DN-Maml1 clones in induced and non-induced (control) mice (n=9 and 7 mice, respectively). Error-bars are mean±s.e.m (two-tailed Mann-Whitney test). (f) Number of tumors per mm2 of esophageal epithelium in control non-induced (n=7) and induced (n=9) AhcreERT/R26DNM–GFP/wt mice. Data for the induced mice is show as the number of tumors per mm2 of whole tissue area and per mm2 of area not covered by DN-Maml1 clones (DN-Maml1- area). Error-bars are mean±s.e.m. (two-sided Mann-Whitney test). (g) Correlation between the area covered by DN-Mam1 clones and the number of tumors in induced and non-induced AhcreERT/R26DNM–GFP/wt mice. Line shows the Pearson correlation (two-tailed, R2=0.7526) with 95% confidence interval (dotted lines). Inset shows the correlation of the induced mice only (R2=0.4577).
Extended Data Figure 9
Extended Data Figure 9. Spatial interaction between mutant clones in mutagenized normal epithelium and tumors.
(a) Confocal images and cartoons of esophageal epithelium from AhcreERT/R26DNM–GFP/wt mice treated with DEN for 2 months, induced 10-days post-DEN withdrawal and tissues collected 20-days later (as in Fig. 3b). The images show different categories of DN-Maml1 clones (green) interacting with early tumors (red). (b) Percentage of tumors in each category. Number of tumors in each group is shown between brackets (n=386 tumors from 9 mice). (c) Top-down confocal images depicting a DN-Maml1 clone surrounding a tumor (see also Fig. 3e). A smaller tumor surface area at the base is consistent with a process of extrusion by the expanding DN-Maml1 clone as illustrated in (g). (d) In vivo genetic lineage tracing using the multicolor confetti reporter allele in R26creERT2R26flConfetti mice. Injection of the drug tamoxifen (TAM), results in Cre-mediated inversion and excision recombination events in scattered single cells. This confers heritable expression of one of four fluorescent proteins (YFP, GFP, RFP or CFP) resulting in labelled clones. (e) Protocol: R26creERT2R26flConfetti mice were induced with TAM to label Confetti clones, followed by 2-months DEN treatment. Esophagi were collected 10 days or 30 days after DEN withdrawal. (f) Confocal images of Confetti clones surrounding early tumors (KRT6, shown in red) in the categories 2-4 as in (a), suggesting that tumor extrusion events may also take place in mutagenized epithelium in the absence of DN-Maml1 induced clones. Images are representative of 13 tumors from 8 mice. (g) Cartoon illustrating a potential mechanism of tumor extrusion by expanding mutant clones in the normal epithelium. Once the tumor footprint in the basal layer is displaced by expanding mutant clones in the adjacent normal tissue, the tumor will be shed. Scale-bars in panels (a), (c) and (f) are 25μm.
Extended Data Figure 10
Extended Data Figure 10. Increasing competitive fitness throughout the epithelium slows down tumor loss. Human esophageal lesions.
A stochastic drift model (Supplementary Note) fit to the observed number (mean±s.e.m) of tumors following DEN treatment. (b) Experimentally observed (black dots) and model predicted (dashed lines) % of tumors eliminated when highly fit mutant clones (such as DN-Maml1) are induced in esophageal epithelium following DEN-treatment. Dashed lines represent models where the induced mutant clones remove tumors they encounter (blue) or where tumor loss is independent of clones in the surrounding tissue (red) (Supplementary Note). (c) Cartoon illustrating the predicted effects of DBZ administration. When clones in the normal surrounding epithelium have a higher competitive fitness than the tumors, the probability that tumors will be eliminated from the tissue may be higher (left) than when administration of DBZ levels the competition between the clones and tumors (right). (d) Qualitative representation of tumor dynamics following DBZ vs. control treatment. (e) Protocol: wild-type mice were treated with DEN for two months. Ten days post-DEN withdrawal mice received DBZ or vehicle control. Tissues were harvested two weeks later. (f-g) Experimental (f) and simulated (g, Supplementary Note) tumors per mm2 of esophageal epithelium in DBZ and vehicle control treated mice (n=5 mice/group). Lines in (f) are mean±s.e.m (two-tailed Mann-Whitney test). Black dots in (g) show experimental data. (h-i) Numerical example (see Supplementary Note) of the model showing increased proportion of tumors resistant to displacement by mutant clones (h) and the decrease in tumor density following DEN-treatment (i). Experimental data depicts mean±s.e.m. (j) Images of human (top) and mouse (bottom) esophagus. Dotted lines delineate lesions. (k) Confocal images of human normal (top) and neoplastic (bottom) esophageal epithelium stained with KRT6 (red) and Topro3 (nuclei, blue). Scale-bars: 100μm. Simulations in (a, g, h and i) show the mean and range between the minimum-maximum outputs of the model run with the accepted parameters from Approximate Bayesian Computation (Methods).
Figure 1
Figure 1. Most esophageal tumors are lost over time.
(a) Cartoon depicting epithelial tumor formation and growth over time. Sb, subrabasal; b, basal; str, stroma. (b) Protocol: wild-type mice received the carcinogen Diethylnitrosamine (DEN) in drinking water. Esophagi were collected at the indicated time-points. (c) Examples of confocal images of the entire mouse esophageal epithelium collected at 10 days (left) or 18 months (right) post-DEN treatment, stained for Dapi (blue) and Keratin 6 (KRT6, red). Insets show esophageal normal epithelium (top images) or tumors (bottom images) from the indicated time points post-DEN treatment. Scale-bars: 2mm, insets: 50μm. (d) Tumor density (left axis) and size (right axis) at the indicated time-points post-DEN treatment. Statistics are two-tailed Welch’s t test vs 10-days (n=number of mice, shown in brackets). Colored lines connect the mean values. (e) Area of individual tumors at the indicated time points post-DEN treatment. Number of tumors per time point is indicated in brackets. Lines indicate mean±s.e.m. Statistics are two-tailed Mann Whitney test vs 10-days. (f) Cartoon illustrating tissue tumor clearance over time.
Figure 2
Figure 2. Sequencing of tumors and adjacent normal tissue.
(a) Esophageal tumors were collected 10-days or 1-year post-Diethylnitrosamine (DEN) treatment and ultra-deep targeted sequencing with a 192 gene bait-set performed. Scale-bars: 50μm. (b) Mutations per tumor, including essential splice, frameshift, missense, nonsense and silent mutations. Dotted lines and colored shadows indicate mean±s.e.m (two-tailed Mann-Whitney test). (c) dN/dS ratios for missense and truncating (nonsense + essential splice site) mutations of positively selected genes (dN/dS>1) in the 10 days and 1 year post-DEN tumors (only significant genes for each time point are shown, q<0.05 calculated with R package dNdScv). (d) Estimated percentage of tumor area carrying non-synonymous mutations in the positively selected genes (identified with green rectangles for each time point). Range indicates upper and lower bound estimates. (e, f) Heatmaps indicating the maximum (e) and summed VAF (f) for non-synonymous mutations in Atp2a2 and Notch1 in 10-day and 1-year post-DEN tumors. (g) Schematic representation of the mutant clones in normal esophageal epithelium collected 10 days post-DEN treatment. Only mutations of the positively selected genes (dN/dS>1) in normal or tumor samples at 10 days and 1 year are shown. The density and size of the clones are inferred from the sequencing data, and the nesting of clones and subclones is inferred from the data when possible and randomly allocated otherwise. (h) Correlations between the summed VAF of nonsynonymous mutations (NS muts) in the 192 genes sequenced from normal epithelium and tumors at 10-days (left) and 1-year (right) post-DEN treatment. Centre lines show two-tailed Pearson correlations (R2=0.8329; P=1.6x10-76) and R2=0.7081; P=3.2x10-53, respectively). Red dots indicate genes outside the 99% predicted band (colored area within grey dotted lines). (i) Percentage of area covered by Notch1 (blue, left graphs) and Atp2a2 (orange, right graphs) mutations in the normal epithelium (outer circles) versus the tumors (inner circles) collected at 10-days or 1-year post-DEN treatment.
Figure 3
Figure 3. Elimination of early tumors by expansion of mutant clones in the adjacent normal epithelium.
(a) Hypothesis: Tumor survival depends on their competitive fitness relative to that of the surrounding normal tissue, predicting 3 possible scenarios: 1) tumor cells are fitter than clones in the normal adjacent epithelium (left), tilting the balance towards tumor growth; 2) Tumor cells are less fit than the adjacent normal epithelium (middle), resulting in tumor regression and elimination, and 3) cells in tumor and adjacent normal epithelium are equally fit (right), resulting in neutral drift. (b) Protocol: AhcreERT/R26DNM–GFP/wt mice received DEN for two months. 10 days after DEN withdrawal DN-Maml1 clones were induced and tissues harvested twenty days later. Control mice received DEN but were not induced. (c) Number of tumors per mm2 of esophageal epithelium in induced and non-induced AhcreERT/R26DNM–GFP/wt mice (n= 9 and 7 mice, respectively). Lines indicate mean±s.e.m (two-tailed Mann-Whitney test). (d) Correlation between the area covered by DN-Mam1 clones and tumors being eliminated (see Methods). n=9 mice. Line shows the two-tailed Pearson correlation (R2=0.9541) with 95% confidence interval (colored area). (e) Rendered confocal images showing top views (top images), lateral view (middle image) and schematic (bottom image) of a tumor (orange) surrounded by a DN-Maml1 clone (green). Dapi is shown in blue. Scale-bars: 20μm.

Comment in

Similar articles

Cited by

References

    1. Lee-Six H, et al. The landscape of somatic mutation in normal colorectal epithelial cells. Nature. 2019;574:532–537. - PubMed
    1. Martincorena I, et al. Somatic mutant clones colonize the human esophagus with age. Science. 2018;362:911–917. - PMC - PubMed
    1. Martincorena I, et al. Tumor evolution. High burden and pervasive positive selection of somatic mutations in normal human skin. Science. 2015;348:880–886. - PMC - PubMed
    1. Suda K, et al. Clonal Expansion and Diversification of Cancer-Associated Mutations in Endometriosis and Normal Endometrium. Cell reports. 2018;24:1777–1789. - PubMed
    1. Yokoyama A, et al. Age-related remodelling of oesophageal epithelia by mutated cancer drivers. Nature. 2019;565:312–317. - PubMed

Publication types