. 2021 Nov;599(7883):152-157.
doi: 10.1038/s41586-021-03982-6. Epub 2021 Oct 13.

Systems-level effects of allosteric perturbations to a model molecular switch

Affiliations

Systems-level effects of allosteric perturbations to a model molecular switch

Tina Perica et al. Nature. 2021 Nov.

Abstract

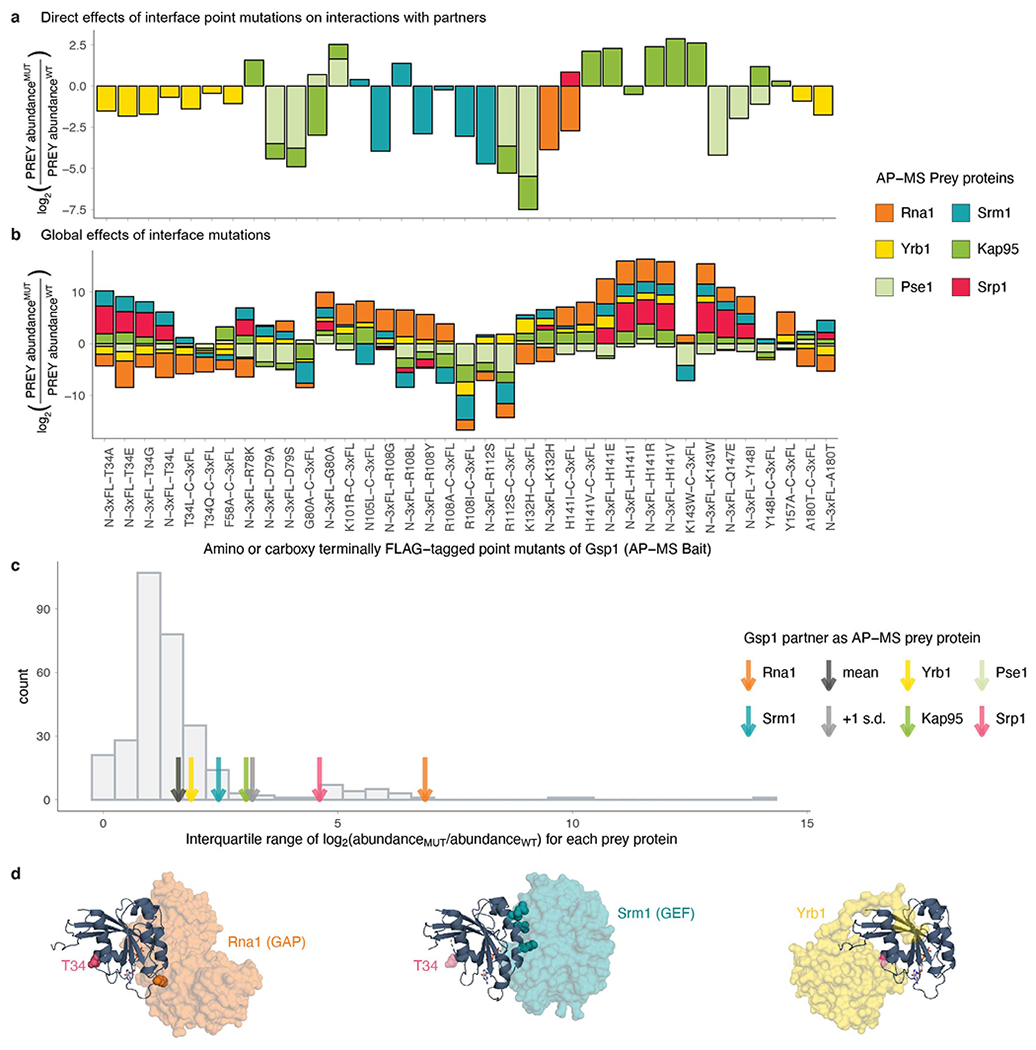
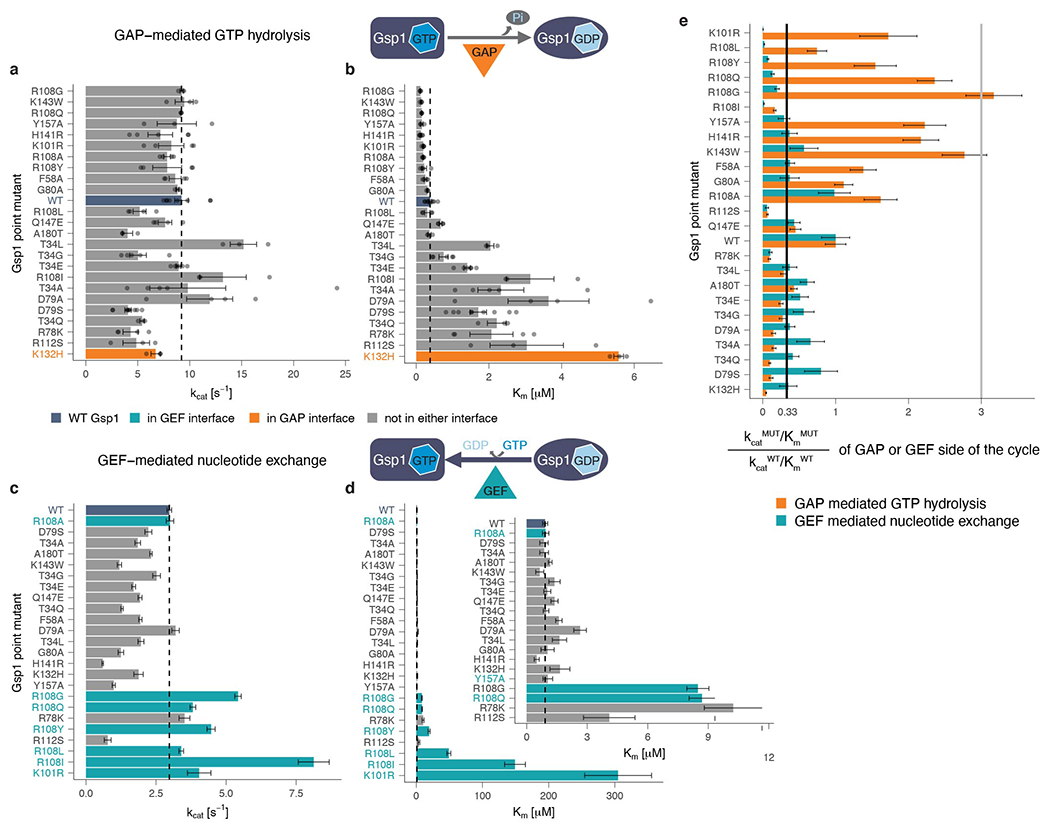
Molecular switch proteins whose cycling between states is controlled by opposing regulators1,2 are central to biological signal transduction. As switch proteins function within highly connected interaction networks3, the fundamental question arises of how functional specificity is achieved when different processes share common regulators. Here we show that functional specificity of the small GTPase switch protein Gsp1 in Saccharomyces cerevisiae (the homologue of the human protein RAN)4 is linked to differential sensitivity of biological processes to different kinetics of the Gsp1 (RAN) switch cycle. We make 55 targeted point mutations to individual protein interaction interfaces of Gsp1 (RAN) and show through quantitative genetic5 and physical interaction mapping that Gsp1 (RAN) interface perturbations have widespread cellular consequences. Contrary to expectation, the cellular effects of the interface mutations group by their biophysical effects on kinetic parameters of the GTPase switch cycle and not by the targeted interfaces. Instead, we show that interface mutations allosterically tune the GTPase cycle kinetics. These results suggest a model in which protein partner binding, or post-translational modifications at distal sites, could act as allosteric regulators of GTPase switching. Similar mechanisms may underlie regulation by other GTPases, and other biological switches. Furthermore, our integrative platform to determine the quantitative consequences of molecular perturbations may help to explain the effects of disease mutations that target central molecular switches.


Conflict of interest statement

Competing Interest. The authors declare no competing interests.

Figures

Extended Data Figure 1
Extended Data Figure 1. Design of interface point mutations in S. cerevisiae Gsp1.
Interface residues are categorized as interface core, rim, and support positions (see Supplementary Methods) and provided in Supplementary Table 2. a-f, Structures of Ran/Gsp1 in partner-bound conformations with interface residues coloured by partner protein. All mutated Gsp1 residues are shown as spheres.: a, Srm1 (GEF) interface core (dark teal) and interface rim and support (light teal) PDB 1I2M; b, Rna1 (GAP) interface core (dark orange) and interface rim and support (light orange) PDB 1K5D; c, Ntf2 interface core (dark purple) and interface rim and support (light purple) PDB 1A2K; d, Residues that are in both the core of the Yrb1 and Yrb2 interfaces (dark yellow), and in only one of the two interfaces (light yellow) PDB 1K5D; e, Srp1 interface core (dark pink) and interface rim and support (light pink) PDB 1WA5; f, Residues that are in the core of four or more (dark green), two to three (green) and one (light green) karyopherin interface. Karyopherins are: Kap95, Crm1, Los1, Kap104, Msn5, Cse1, Mtr10. PDB 2BKU. g, Location of Gsp1 residues in partner interfaces. Residues within 5 Å of the nucleotide, in the canonical P-loop, or in the switch I or II regions were not mutated. Residues belonging to the switch I, switch II, and C-terminal α helix are indicated by dark navy bars. Chosen Gsp1 point mutation substitutions are provided in Supplementary Table 3.
Extended Data Figure 2
Extended Data Figure 2. Endogenous expression levels of Gsp1 point mutations in S. cerevisiae strains with genomically integrated Gsp1 point mutations profiled by Western Blot.
a, Expression data for strong mutants, defined as mutants with nine or more significant GIs. b, Expression data for weak mutants, defined as mutants with fewer than nine significant GIs. In a, and b, bar heights indicate averages over two or more biological replicates (n) grown on separate days (except for T34D which has only one biological replicate), with error bars indicating one standard deviation for n >= 3. Overlaid points indicate individual biological replicates (each an average over at least 12 technical replicates per biological replicate for wild-type and MAT:α strains, and between one and six technical replicates per biological replicate for mutant strains). Expression levels are relative to the expression levels of wild-type Gsp1 protein with clonNAT resistance marker (WT) shown as red dashed lines (relative expression of 1). MAT:α is the starting S. cerevisiae strain (see Supplementary Methods). c, Distributions of average relative expression levels for strong and weak mutants. Each point is as in a and b. Horizontal pink bars indicate the mean of the point distributions.
Extended Data Figure 3
Extended Data Figure 3. Genetic interaction (GI) profiles of the 56 Gsp1 strains (wild-type Gsp1 with clonNAT cassette and 55 point mutants).
Negative S-score (blue) represents synthetic sick/lethal GIs, positive S-score (yellow) represents suppressive/epistatic GIs; neutral S-scores (no significant GI) are shown in black. Gsp1 point mutants and S. cerevisiae genes are hierarchically clustered by Pearson correlation. Gsp1 mutants fall into two clusters: a cluster of 23 strong mutants with nine or more significant GIs and 32 weak mutants with fewer than nine significant GIs.
Extended Data Figure 4
Extended Data Figure 4. Functional profiles of GSP1 mutants cannot be explained solely by the positions of mutations in interfaces.
a, Locations of mutated residues in structurally characterized interfaces. ΔrASA is the difference in accessible surface area of a residue upon binding, relative to an empirical maximum for the solvent accessible surface area of each amino acid residue type (see Supplementary Methods). b, GI profiles of Gsp1 mutants group S. cerevisiae genes by biological processes and complexes, such as the dynein/dynactin pathway, SWR1 complex, the Hog1 signaling pathway, mRNA splicing, mitochondrial proteins, and the Rpd3L histone deacetylase complex. c, Distributions of Pearson correlations between the GI profiles of strong Gsp1 mutants and alleles of Gsp1 direct interaction partners with available co-complex crystal structures (left) and strong Gsp1 mutants and alleles of all other S. cerevisiae genes (right).d, Distributions of Pearson correlations between the GI profiles of Gsp1 interaction partners and strong and weak Gsp1 mutants if mutation is (black and light purple) or is not (gray and dark purple) in the interface with that partner. Teal violin plot on the right represents the distribution of all other Pearson correlations between Gsp1 mutants and S. cerevisiae genes. In c and d, point size indicates the false discovery rate adjusted one-sided (positive) p-value of Pearson correlation, and pink bars indicate the mean of the point distributions; n denotes the number of Gsp1 point mutant-gene GI profile correlations in each category. Data for strong mutants are also shown in Fig. 1e and included here for comparison.
Extended Data Figure 5
Extended Data Figure 5. Interface point mutations in Gsp1 rewire its physical interaction network.
a, Schematic representation of the affinity purification mass spectrometry (AP-MS) experiment to determine the abundance of pulled-down protein interaction partners of wild type and mutant Gsp1. The change in abundance of partner proteins pulled down with Gsp1 mutants in b, c, and d is represented as log2-transformed fold change (FC) between abundance of a partner pulled-down with a Gsp1 mutant versus pulled-down with wild-type Gsp1 (log2(abundance(PREY)MUT/abundance(PREY)WT). To account for possible tag effects, the fold change in prey abundance was always computed relative to the wild-type protein with the corresponding tag. Decreased abundance compared to pull-down with wild-type Gsp1 is annotated in red and increased abundance in blue. The log2-transformed fold change values are capped at +/− 4. b, Amino- and c, - carboxy terminally 3xFLAG-tagged Gsp1 point mutants (rows) and prey proteins identified by AP-MS (columns) hierarchically clustered by the log2-transformed fold change in prey abundance. d, Prey proteins pulled down by both amino- and carboxy-terminal tagged constructs. Left semi-circle represents an amino-terminal 3xFLAG-tagged Gsp1 point mutant, and right semi-circle represents carboxy-terminal 3xFLAG-tagged Gsp1 point mutant. Semi-circle size is proportional to the significance of the log2-transformed fold change (false discovery rate adjusted p-value) of the prey abundance in pulled-down complexes with a Gsp1 mutant compared to complexes with the wild-type Gsp1. Overall we identified 316 high-confidence prey partner proteins, with the amino- and carboxy-terminally tagged Gsp1 mutants pulling down 264 and 103 preys, respectively, including 51 overlapping preys. The difference in preys identified by experiments with N- or C-terminal tags illustrates the sensitivity of the interaction network to perturbation of Gsp1.
Extended Data Figure 6
Extended Data Figure 6. Gsp1 interface mutations rewire interactions with the core regulators Srm1 and Rna1.
a, b, Protein-protein interactions between interface mutants of Gsp1 and Gsp1 partners for which there are co-complex X-ray crystal structures (core regulators Srm1 and Rna1, and effectors Yrb1, Kap95, Pse1, and Srp1). Change in pulled-down prey partner abundance is expressed as log2(PREY abundanceMUT/PREY abundanceWT)). N-3xFL and C-3xFL labelled mutants are tagged with an amino- or carboxy-terminal triple FLAG tag, respectively, and partners are coloured as indicated. a, Bar plot depicting changes in pulled-down prey partner abundance when the point mutation is in the core of the Gsp1 interface with the prey partner. b, Bar plot depicting all changes in pulled-down prey partner abundance for core regulators Srm1 and Rna1, and effectors Yrb1, Kap95, Pse1, and Srp1, regardless whether the mutation is directly in the interface core with the partner or not. c, Distribution showing the variation in log2-transformed fold change in abundance of all prey proteins pulled down with the Gsp1 mutants, as defined by interquartile range (IQR) across mutants. Values for core partners shown as arrows (Rna1 orange, Srm1 teal, Yrb1 yellow, Kap95 green, Pse1 light green, Srp1 pink). Mean and +1 standard deviation of IQR values are highlighted with a dark gray and a light gray arrow, respectively. The extent to which the abundance of the two cycle regulators Rna1 and Srm1 changed across the Gsp1 point mutants is larger than the change for an average prey protein. All IQR values are provided in Supplementary Table 5. d, Position of T34 with respect to the interfaces with Rna1 (GAP, orange surface, PDB 1K5D), Srm1 (GEF, teal surface, PDB 2I1M), and Yrb1 (yellow surface, PDB 1K5D). As the coordinates for T34 are not resolved in the 2I1M structure, in all three structures the pink spheres show the residue location in the aligned 1K5D structure. Gsp1: navy cartoon; GTP nucleotide: stick representation. Residues that were mutated in the Rna1 and Srm1 interfaces are shown in sphere representation and are coloured in orange (Rna1, left) or teal (Srm1, middle).
Extended Data Figure 7
Extended Data Figure 7. Effect of Gsp1 point mutations on the in vitro efficiency of GAP-mediated GTP hydrolysis and GEF-mediated nucleotide exchange.
a, kcat and b, Km values of GAP-mediated GTP hydrolysis of wild-type and point mutant Gsp1. Error bars represent the standard deviation of the kcat and the Km parameters from the integrated Michaelis-Menten fit for n ≥ 3 replicates. c, kcat and d, Km of GEF-mediated nucleotide exchange of wild-type and point mutant Gsp1. Inset shows the Km barplot for all but the four mutants with the highest Km (K101R, R108L, R108I, and R108Y). Error bars represent the value plus/minus the standard error of the Michaelis-Menten fit to data from n ≥ 17 measurements at different substrate concentrations. a, b, c, d, Dotted lines indicate the wild-type values. Dark blue bar denotes the wild-type Gsp1, and orange and teal bars highlight the residues that are in the core of the interface with the GAP and GEF, respectively. e, Comparison of relative change in catalytic efficiencies of GAP-mediated GTP hydrolysis (orange bars) and GEF-mediated nucleotide exchange (teal bars) defined as kcatMUT/KmMUT / kcatWT/KmWT. Gray line indicates a three-fold increase compared to wild type and black line indicates a three-fold decrease compared to wild type. Error bars represent the added standard error of the mean (for GAP) or standard error of the fit (for GEF) values of the mutant and the wild-type efficiency (kcat/Km) values. Mutations not in the interface core with the GAP both increased (3-fold, R108G mutant) and decreased (3 to 10-fold, T34E/Q/A/G, R78K, D79S/A, R108I, and R112S mutants) the catalytic efficiency kcat/Km of GAP-mediated GTP hydrolysis, compared to wild-type Gsp1. As expected, mutations in the interface core with the GEF (K101, and R108) decreased the catalytic efficiency of GEF-mediated nucleotide exchange >40-fold. However, other mutations not in the GEF interface core (R78K, R112S, Y157A) also decreased the efficiency notably (3- to 10-fold).
Extended Data Figure 8
Extended Data Figure 8. Gsp1 interface mutations act allosterically to modulate the rate of GTP hydrolysis.
a, Annotated 1D 31P NMR spectrum of wild-type Gsp1 loaded with GTP. Peak areas are computed over intervals shown and normalized to the GTPβ bound peak. The peaks from left to right correspond to: free phosphate (Pi), β phosphate of GDP bound to Gsp1 (GDPβbound), β phosphate of free (unbound) GDP (GDPβfree), γ phosphate of GTP bound to Gsp1 in conformation 1 (γ1), γ phosphate of GTP bound to Gsp1 in conformation 2 (γ2), α phosphate of bound or unbound GDP or GTP, β phosphate of GTP bound to Gsp1 (GTPβbound), β phosphate of free (unbound) GTP (GTPβfree). b, Rate of intrinsic GTP hydrolysis of wild-type Gsp1 and mutants. Dotted line indicates wild-type value. Error bars represent the standard deviations from n ≥ 3 replicates (dots). c, Natural log-transformed exchange equilibrium constant between the γ2 and γ1 conformations plotted against the relative rate of intrinsic GTP hydrolysis represented as a natural logarithm of the ratio of the rate for the mutant over the rate of the wild type. The pink line is a linear fit. Error bars represent the standard deviation from n ≥ 3 replicates of intrinsic GTP hydrolysis measurements. d, Location of Y157, H141, and Q147 (pink spheres) in the Crm1 interface (gray surface, PDB 3M1I). Gsp1: navy cartoon; GTP nucleotide: yellow stick representation, e, Location of T34 (pink spheres) in the interface with Yrb1 (gray surface, PDB 1K5D). Distances from the γ phosphate of GTP to the residue α-carbon are indicated below the residue numbers in d and e.
Extended Data Figure 9
Extended Data Figure 9. Relative prey protein abundance compared to the wild type with corresponding 3xFLAG tag from the AP-MS proteomics experiment overlaid onto the effects of each mutation on relative in vitro efficiencies of GAP-mediated GTP hydrolysis and GEF-mediated nucleotide exchange.
Relative GAP-mediated hydrolysis and GEF-mediated exchange efficiencies are plotted as ln(kcatMUT/KmMUT/kcatWT/KmWT). Mutants that affect the efficiency (kcat/Km) of GEF-catalyzed nucleotide exchange more than the efficiency of GAP-catalyzed GTP hydrolysis are above the diagonal, and the mutants that affect the GAP-catalyzed hydrolysis are below the diagonal. Left semi-circle represents an amino-terminal 3xFLAG-tagged Gsp1 point mutant, and right semi-circle represents a carboxy-terminal 3xFLAG-tagged Gsp1 point mutant, relative to wild-type Gsp1 with the corresponding tag. a, Color represents log2-transformed ratio of GAP and GEF abundance fold change for each Gsp1 point mutant compared to wild type defined as log2((abundance(Rna1)MUT/abundance(Rna1)WT)/(abundance(Srm1)MUT/abundance(Srm1)WT)). Orange coloured mutants pull-down relatively less Rna1 (GAP) and teal mutants less Srm1 (GEF). b-f, Colour represents the log-transformed ratio of mutant and wild type pulled-down prey protein represented as log2(PREY abundanceMUT/PREY abundanceWT). Log-transformed relative abundance values are capped at +/− 4. Decreased prey abundance from AP-MS in pulled-down complexes with a mutant Gsp1 compared to complexes with the wild-type Gsp1 is represented in red and increased abundance in blue. Prey proteins: b, Rna1 (GAP); c, Srm1 (GEF); d, Yrb1; e, Kap95, and f, Vps71. Yrb1 follows a pattern similar to that of Rna1 (GAP), while Kap95 and Vps71 are similar to Srm1 (GEF).
Extended Data Figure 10
Extended Data Figure 10. Sets of S. cerevisiae genes grouped by biological functions.
Heatmaps of the false discovery rate adjusted one-sided (positive) p-values of the Pearson correlations between the GI profiles of 22 strong Gsp1 point mutants and GI profiles of knock-outs or knock-downs of S. cerevisiae genes from Ref.. The p-value is represented as a white to gray range as in Fig. 4a. Genes are organized in gene sets based on their biological function (Methods). The line plots above the heatmaps are the same as in Fig. 4c. a, Gsp1 point mutants and alleles of Gsp1 binding partners with available co-complex X-ray crystal structures, and S. cerevisiae genes involved in nuclear transport of RNA and proteins. b, Gsp1 point mutants and S. cerevisiae genes involved in transcription regulation or 5′ mRNA capping. c, Gsp1 point mutants and S. cerevisiae genes involved in the cytoplasm-to-vacuole targeting (CYT) pathway, and actin, tubulin, and cell polarity.
Figure 1
Figure 1. Genetic interaction (GI) profiles of Gsp1 interface point mutants cluster by biological processes but not by targeted interfaces.
a, Interface point mutations enable probing of biological functions of the multi-specific GTPase switch Gsp1. b, Mutated residue positions shown as Cα atom spheres on the structure of GTP-bound Gsp1. Bold: positions of mutations with strong genetic interaction profiles; italic: positions not conserved in sequence between S. cerevisiae and human; coloured dots: interaction partners for which the residue is in the interface core; blue and pink: switch I and II regions. c, GI profiles of 23 Gsp1 mutants with nine or more significant GIs, hierarchically clustered by Pearson correlation. Negative S-score (blue): synthetic sick/lethal GIs; positive S-score (yellow): suppressive/epistatic GIs. d, Distributions of significant GIs of Gsp1 point mutants compared to GIs of mutant alleles of essential and non-essential genes. e, Distributions of Pearson correlations between the GI profiles of Gsp1 interaction partners and Gsp1 mutants if mutation is (right, black) or is not (left, gray) in the interface with that partner. Point size: false discovery rate adjusted one-sided (positive) p-value of the Pearson correlation; pink bars (d,e): mean.
Figure 2
Figure 2. Gsp1 interface point mutations rewire the physical interaction network of Gsp1, including interactions with the switch regulators GEF (Srm1) and GAP (Rna1).
Shown is the log2-transformed fold change (FC) between abundance of partner proteins pulled-down with a Gsp1 mutant versus pulled-down with wild-type Gsp1. a, Change in abundance of partner proteins with crystal structures in complex with Gsp1 (Rna1, Srm1, Yrb1, Kap95, Pse1, Srp1) where the mutation is (left) or is not (right) in the interface core with the partner, n: number of partner abundance changes in each category. Mean(log2FC) values (pink bars) are −1 and 0.73, respectively (t-test p-value = 1.6x10⁻⁵). Point size: p-value of abundance fold change. b, Change in abundance of pulled-down Rna1 and Srm1. Point size as in b; points coloured by interface location.
Figure 3
Figure 3. Point mutations in Gsp1 interfaces allosterically modulate GTPase cycle parameters by tuning active site conformational distributions.
Catalytic efficiency (kcat/Km) of GAP-mediated GTP hydrolysis (a) or GEF-mediated nucleotide exchange (b) of Gsp1 mutants. Dotted lines: wild-type efficiency. In a, points represent kcat/Km from an individual experiment fit to an integrated Michaelis-Menten equation. Error bars: standard error of the mean from n ≥ 3 replicates. In b, error bars represent the standard error of the mean of the Michaelis-Menten fit to data from n ≥ 17 measurements at different substrate concentrations. c, 31P NMR of GTP-bound Gsp1 point mutants. NMR peak heights are normalized to the β peak of bound GTP (βGTPb). The two peaks of the γ phosphate of bound GTP are highlighted in yellow. d, Natural log-transformed ratios MUT/WT of the exchange equilibrium constants Kex = population in γ2 / population in γ1 (assuming a detection limit of 3% for the γ peak estimation by 31P NMR) plotted against the natural log-transformed ratios MUT/WT of the relative catalytic efficiency (kcat/Km) of GAP-mediated GTP hydrolysis. Error bars: standard error of the mean for n ≥ 3 replicates. Pink line: least-squares linear fit, excluding K132H, R78K and D79S (gray box).
Figure 4
Figure 4. Cellular effects of interface mutations group by their effect on GTPase cycle kinetics.
a, Clustering of 276 S. cerevisiae alleles and 22 strong Gsp1 point mutants by the p-value of Pearson correlations of their GI profiles compared to the relative efficiencies of GAP-mediated GTP hydrolysis and GEF-mediated nucleotide exchange (asterisks: not measured). Gray scale: False discovery rate adjusted one-sided (positive) p-value of the Pearson correlations. Parentheses: number of genes in cluster. b, Distributions of Pearson correlations, separated by Gsp1 point mutant groups from column hierarchical clustering in a. Green, red, or blue points: individual correlations with S. cerevisiae genes in three gene sets; gray violin plots: distributions of correlations with all other genes; point size: false discovery rate adjusted one-sided (positive) p-value of the Pearson correlation. Only significant correlations (p-value < 0.05) are included. c, Kinetic characteristics of Gsp1 mutant groups I to III. Outliers are shown as empty circles and dashed lines. The log ratio of relative catalytic efficiencies is capped at −3. d, Heatmaps of false discovery rate adjusted one-sided (positive) p-value of the Pearson correlation for the three representative gene sets. S. cerevisiae genes for each gene set are clustered by p-value. The GTPase cycle schemes on the right represent three modes of Gsp1 function. In c,d only Gsp1 mutants with kinetics data are shown, grouped as in a.

Comment in

References

Main Text References

    1. Ferrell JE & Ha SH Ultrasensitivity part I: Michaelian responses and zero-order ultrasensitivity. Trends in Biochemical Sciences 39, 496–503, doi:10.1016/j.tibs.2014.08.003 (2014). - DOI - PMC - PubMed
    1. Goldbeter A & Koshland DE An amplified sensitivity arising from covalent modification in biological systems. Proceedings of the National Academy of Sciences 78, 6840–6844, doi:10.1073/pnas.78.11.6840 (1981). - DOI - PMC - PubMed
    1. Eisenberg D, Marcotte EM, Xenarios I & Yeates TO Protein function in the post-genomic era. Nature 405, 823–826, doi:10.1038/35015694 (2000). - DOI - PubMed
    1. Rush MG, Drivas G & D’Eustachio P The small nuclear GTPase Ran: how much does it run? BioEssays 18, 103–112, doi:10.1002/bies.950180206 (1996). - DOI - PubMed
    1. Collins SR, Schuldiner M, Krogan NJ & Weissman JS A strategy for extracting and analyzing large-scale quantitative epistatic interaction data. Genome Biology 7, R63, doi:10.1186/gb-2006-7-7-r63 (2006). - DOI - PMC - PubMed

Additional References Cited in Main Methods

    1. Levy ED A simple definition of structural regions in proteins and its use in analyzing interface evolution. Journal of Molecular Biology 403, 660–670, doi:10.1016/j.jmb.2010.09.028 (2010). - DOI - PubMed
    1. Rojas AM, Fuentes G, Rausell A & Valencia A The Ras protein superfamily: evolutionary tree and role of conserved amino acids. The Journal of Cell Biology 196, 189–201, doi:10.1083/jcb.201103008 (2012). - DOI - PMC - PubMed
    1. Collins SR, Roguev A & Krogan NJ Quantitative genetic interaction mapping using the E-MAP approach. Methods in Enzymology 470, 205–231, doi:10.1016/S0076-6879(10)70009-4 (2010). - DOI - PMC - PubMed
    1. Schuldiner M et al. Exploration of the function and organization of the yeast early secretory pathway through an epistatic miniarray profile. Cell 123, 507–519, doi:10.1016/j.cell.2005.08.031 (2005). - DOI - PubMed
    1. Giaever G et al. Functional profiling of the Saccharomyces cerevisiae genome. Nature 418, 387–391, doi:10.1038/nature00935 (2002). - DOI - PubMed

Publication types

MeSH terms

Substances