. 2021 Nov;599(7884):262-267.
doi: 10.1038/s41586-021-03962-w. Epub 2021 Oct 13.

Neural control of affiliative touch in prosocial interaction

Affiliations

Neural control of affiliative touch in prosocial interaction

Ye Emily Wu et al. Nature. 2021 Nov.

Abstract

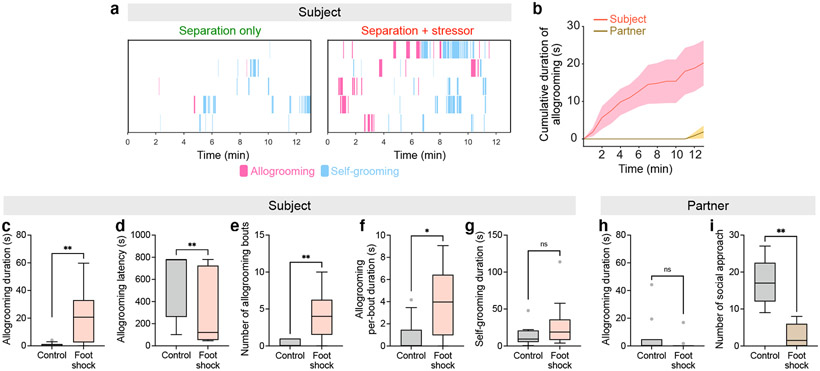
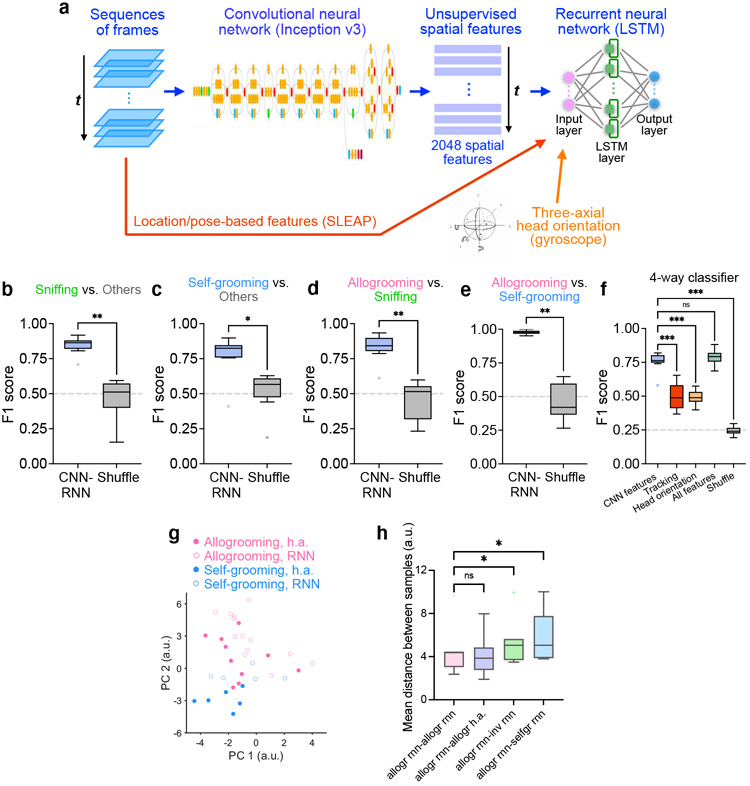
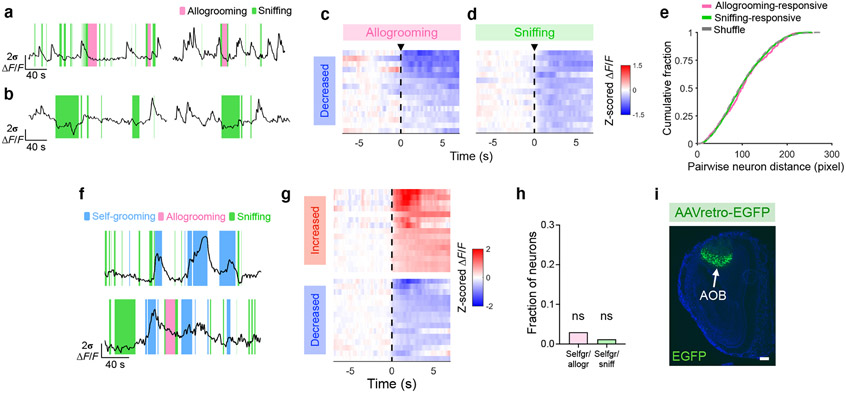
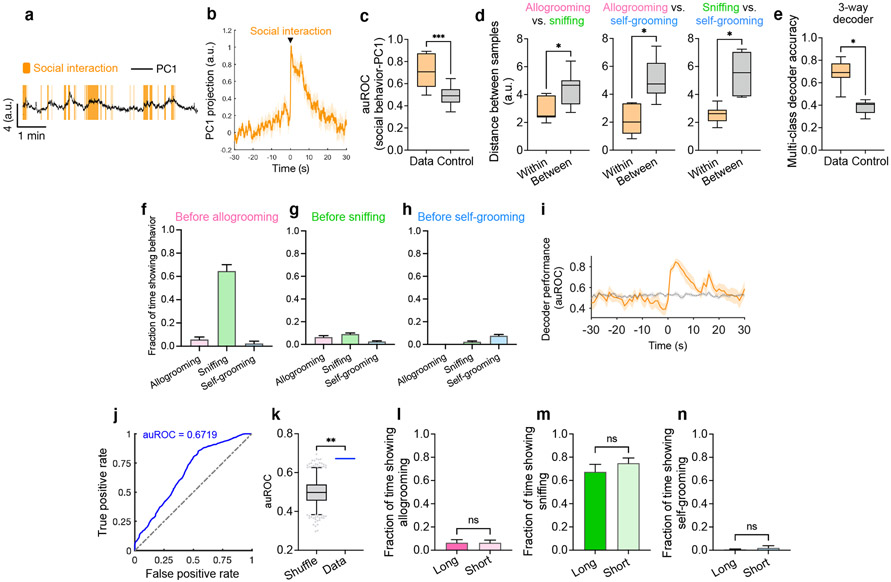
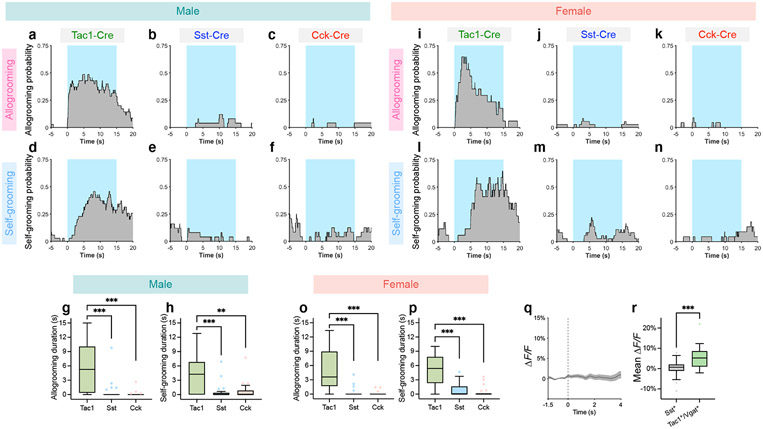
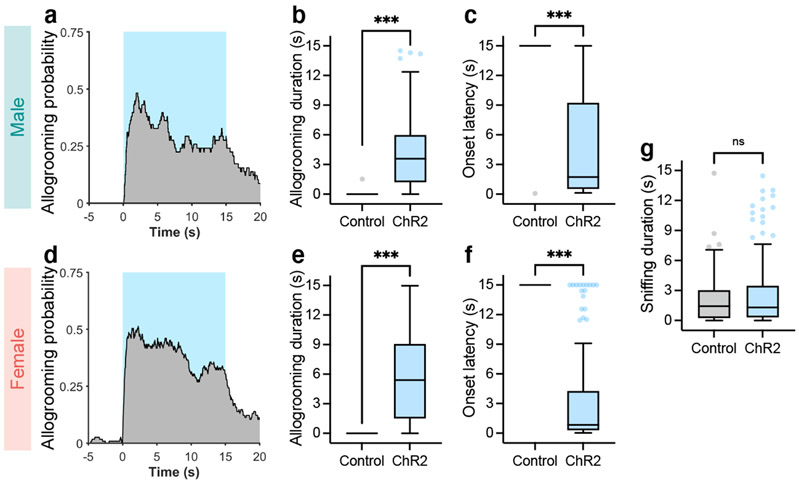
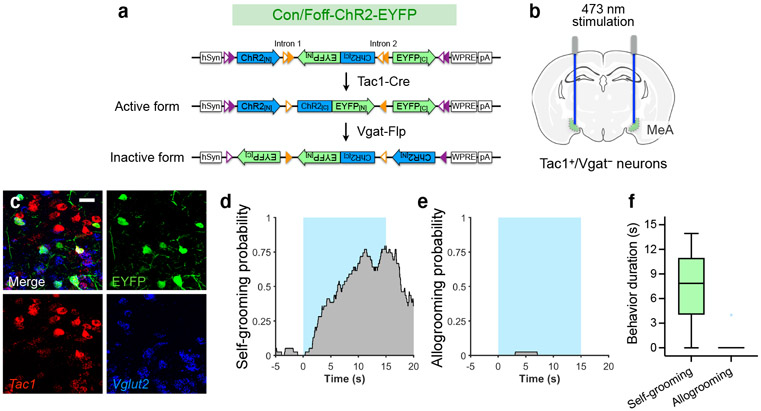
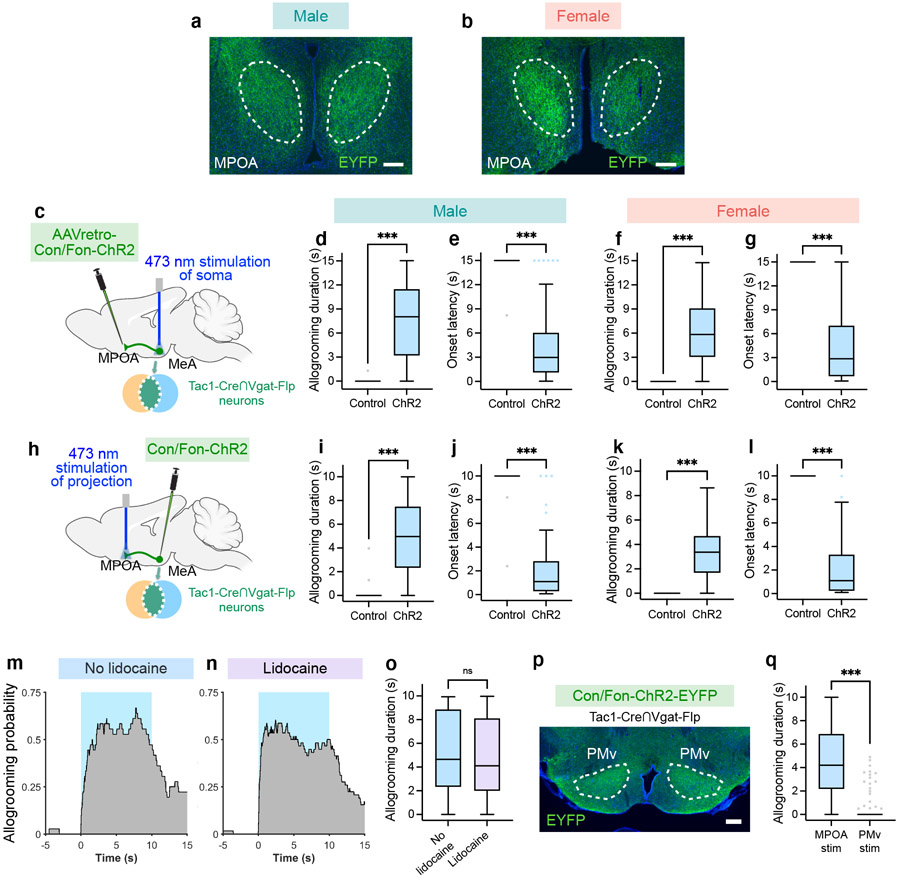
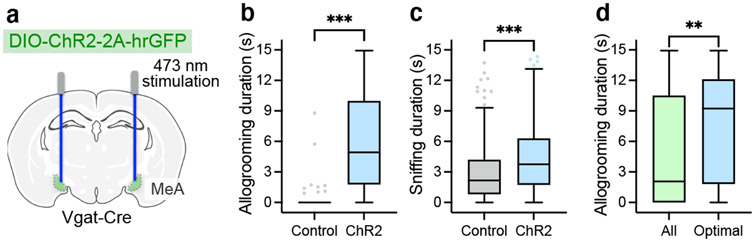
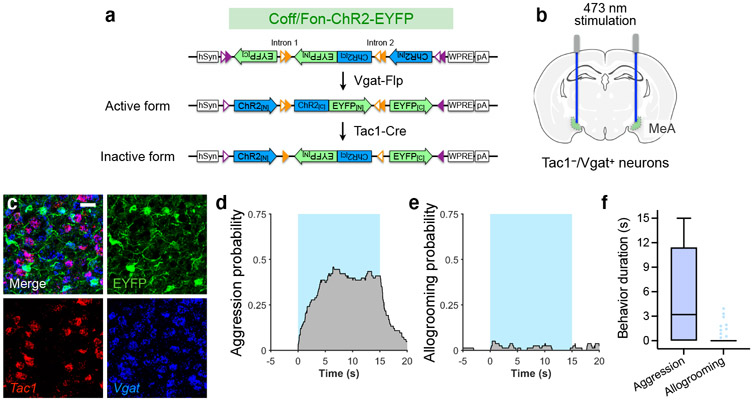
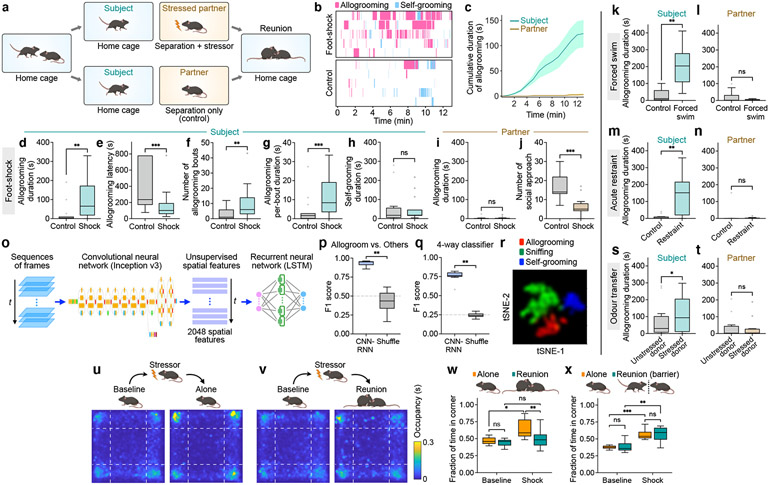
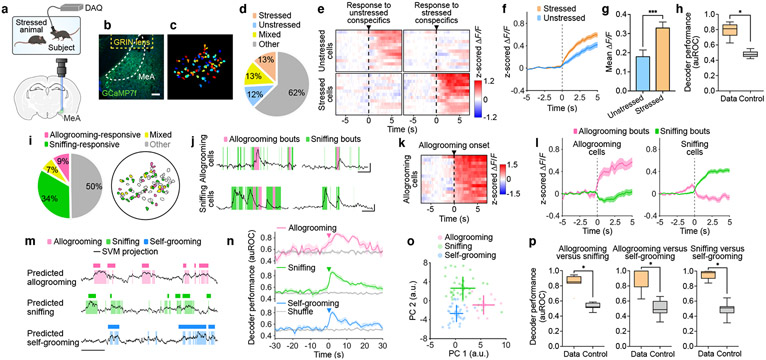
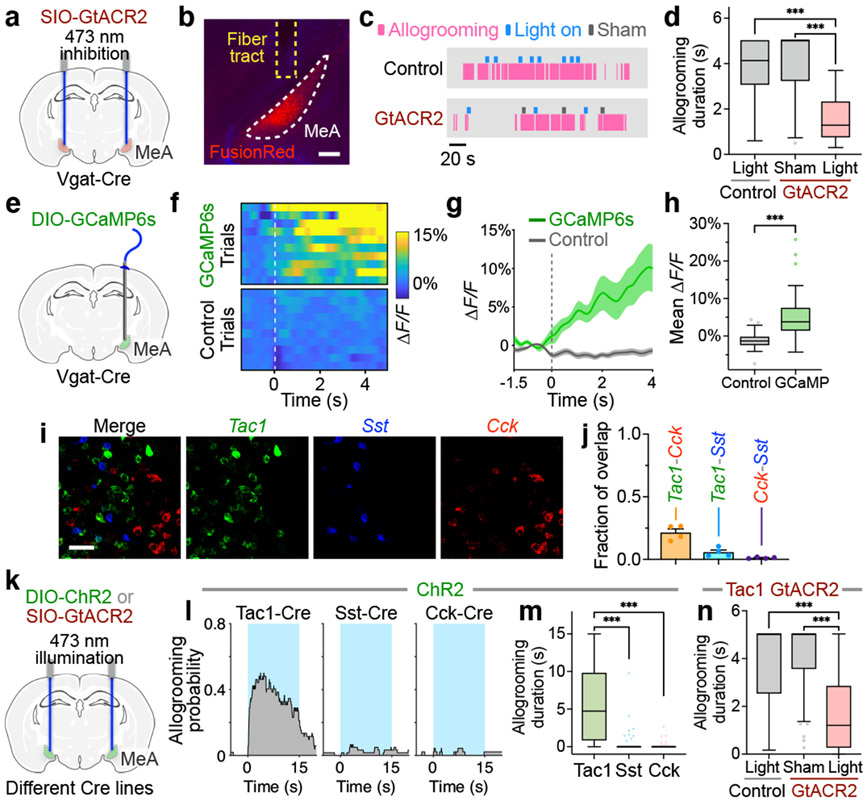
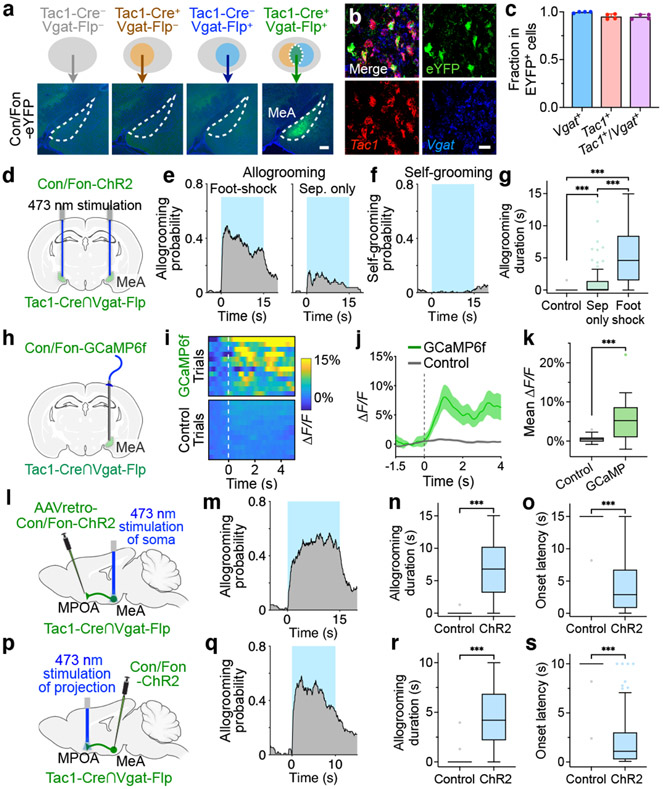
The ability to help and care for others fosters social cohesiveness and is vital to the physical and emotional well-being of social species, including humans1-3. Affiliative social touch, such as allogrooming (grooming behaviour directed towards another individual), is a major type of prosocial behaviour that provides comfort to others1-6. Affiliative touch serves to establish and strengthen social bonds between animals and can help to console distressed conspecifics. However, the neural circuits that promote prosocial affiliative touch have remained unclear. Here we show that mice exhibit affiliative allogrooming behaviour towards distressed partners, providing a consoling effect. The increase in allogrooming occurs in response to different types of stressors and can be elicited by olfactory cues from distressed individuals. Using microendoscopic calcium imaging, we find that neural activity in the medial amygdala (MeA) responds differentially to naive and distressed conspecifics and encodes allogrooming behaviour. Through intersectional functional manipulations, we establish a direct causal role of the MeA in controlling affiliative allogrooming and identify a select, tachykinin-expressing subpopulation of MeA GABAergic (γ-aminobutyric-acid-expressing) neurons that promote this behaviour through their projections to the medial preoptic area. Together, our study demonstrates that mice display prosocial comforting behaviour and reveals a neural circuit mechanism that underlies the encoding and control of affiliative touch during prosocial interactions.


Conflict of interest statement

Competing interests: The authors declare no competing interests.

Figures

Extended Data Fig. 1.
Extended Data Fig. 1.. Characterization of prosocial allogrooming in female mice.
a, Example raster plots showing allogrooming and self-grooming behaviors exhibited by female subjects when they interact with unstressed (separation only, control) or stressed (foot-shocked) female partners. Each row represents an individual animal. b, Time-course of cumulative duration of allogrooming exhibited by subjects and partners after partners experience foot-shocks. Mean ± s.e.m. c, d, Total duration (c) and onset latency (d) of allogrooming exhibited by subjects toward unstressed (control) or foot-shocked partners during 13 min of interaction. While females exhibit elevated allogrooming toward stressed partners similar to males, the total duration of allogrooming toward stressed partners is shorter in females compared to males (Fig. 1d, Supplementary Note 1). e, f, Total number of allogrooming bouts (e) and average per-bout duration of allogrooming (f) in individual subjects interacting with unstressed (control) or foot-shocked partners. g, Total duration of self-grooming exhibited by subjects during interaction with unstressed (control) or foot-shocked partners. h, i, Total duration of allogrooming (h) and total number of social approaches (i) toward subjects exhibited by partners after separation only or foot-shocks. Boxplots: median with quartiles, 1.5 × IQR and outliers. b-i, n = 10 pairs of female mice. Two-sided Wilcoxon signed-rank test. **P < 0.01, *P < 0.05. ns, not significant. For details of statistical analyses, see Supplementary Table 1.
Extended Data Fig. 2.
Extended Data Fig. 2.. Behavioral analysis using convolutional and recurrent neural networks.
a, Schematic of behavior classification using recurrent neural network (RNN) based on CNN-derived spatial features, tracking-based features, and/or head orientation-based features. be, Performance of binary classifiers trained to discriminate between different pairs of behaviors using the CNN + RNN framework. f, Comparison of performance of four-way multi-class classifiers trained to discriminate between allogrooming, sniffing, self-grooming, or other behaviors. Different classifiers used CNN-derived spatial features, tracking-based features, head orientation-based features, or all three types of features to train the recurrent neural network. Data for the “CNN features” and shuffled control groups are the same as those in Fig. 1q and are presented here for comparison. g, PC projections of population vectors associated with different types of behavior bouts from one example microendoscopic imaging session. PCA is first performed using population activity during manually annotated behavior bouts (dots). Population activity during behavior bouts predicted using the CNN-RNN method (circles) was then projected onto this PC space. h, Mean pairwise Euclidean distances (in a space defined by PCs 1-4) between different pairs of behavior events that were either human annotated (“h.a.”) or predicted using the CNN-RNN method during each independent imaging session. Boxplots: median with quartiles, 1.5 × IQR and outliers. bf, n = 9 different partitions of training/validation/test datasets in each group. h, n = 7 independent imaging sessions in 6 subject mice. be, Two-sided Wilcoxon signed-rank test. f, One-way ANOVA followed by Bonferroni’s multiple comparisons test. h, Friedman test followed by post hoc Dunn’s multiple comparisons test. ***P < 0.001, **P < 0.01, *P < 0.05. ns, not significant. For details of statistical analyses, see Supplementary Table 1.
Extended Data Fig. 3.
Extended Data Fig. 3.. MeA neuronal responses during prosocial interaction.
a, b, Example calcium traces from individual allogrooming-suppressed (a) and sniffing-suppressed (b) neurons during allogrooming or sniffing toward stressed conspecifics. c, d, Heatmaps showing average responses of example neurons with decreased activity during allogrooming (c) or sniffing (d). e, Cumulative distributions of pairwise distances between neurons of the same response type (allogrooming-responsive or sniffing-responsive) and distribution based on shuffled data in which the response type is randomly permuted (100 rounds of shuffling). f, Example calcium traces from single neurons that show increased activity during self-grooming but not allogrooming or sniffing. g, Heatmaps showing average responses of example self-grooming-responsive cells (with either increased or decreased activity) centered around self-grooming onset. h, Fraction of cells activated during both self-grooming and allogrooming or during both self-grooming and sniffing. i, Example image showing retrograde labeling of neurons in the accessory olfactory bulb (AOB) by injecting a retrograde AAV-EGFP virus in the MeA. Scale bar, 200 μm. c, d, g, Time 0 indicates behavior onset. e, n = 338, 1560, and 189800 pairwise distances for allogrooming-encoding cells, sniffing-encoding cells, and cells with shuffled identity, respectively. Kolmogorov-Smirnov test. h, Hypergeometric test. ns, not significant. For details of statistical analyses, see Supplementary Table 1.
Extended Data Fig. 4.
Extended Data Fig. 4.. MeA population activity encodes allogrooming and other behaviors during prosocial interaction.
a, Projection of MeA population activity onto the first principal component (PC) overlaid with annotation of social interaction (including allogrooming and sniffing) in an example animal. b, Trial-averaged PC1 activity centered around onset of social interaction across all bouts from all sessions. c, Quantification of area under ROC curve (auROC) characterizing the relationship between PC1 activity and social interaction. d, Pairwise comparisons of the average within- and between-behavior class Euclidean distances (measured on the first 2 PCs within each session) for allogrooming vs. sniffing, allogrooming vs. self-grooming, and sniffing vs. self-grooming. e, Performance of three-way multi-class SVM decoders trained to predict allogrooming, sniffing, or self-grooming behavior. fh, Fraction of time that subjects show different types of behaviors (allogrooming, sniffing, or self-grooming) during the 3 s prior to the onsets of allogrooming (f), sniffing (g), and self-grooming events (h). i, Time-course of behavior decoder performance in discriminating between allogrooming and sniffing centered around onset of behavior. Shuffle control decoders are constructed using time-permuted calcium traces. Note that although a fraction of allogrooming events were preceded by sniffing events (f), the performance of the decoder remains at chance level prior to the onset of behavior (i), suggesting that neural activity during preceding sniffing events is not sufficient to decode allogrooming vs. sniffing. j, ROC curve quantifying performance of a binary decoder to predict whether an allogrooming bout is short (≤ 5s) or long (> 5s) using population activity centered around onset of allogrooming. k, Decoder performance in (j) compared with a null distribution constructed using time-permuted calcium traces. Whiskers indicate the 2.5th and 97.5th percentiles of null distribution. Dotted line: auROC from real data. ln, Fraction of time that subjects show allogrooming (l), sniffing (m), or self-grooming (n) during the 3 s prior to the onsets of long or short allogrooming events. Mean ± s.e.m. The ability to predict allogrooming bout duration using population activity is unlikely to be attributable to differences in behaviors preceding allogrooming as there is no difference in the distribution of different behaviors prior to allogrooming onset between the long and short bouts. b, i, Time 0 indicates behavior onset. b, fi, ln, mean ± s.e.m. Boxplots: median with quartiles, 1.5 × IQR and outliers. b, n = 7 independent imaging sessions (from 6 subject mice). c, n = 7 independent imaging sessions (from 6 subject mice) and 70 rounds of shuffling (10 rounds for each imaging session) for control group. Two-sided Wilcoxon rank-sum test. d, e, n = 7 independent imaging sessions (from 6 subject animals). Two-sided Wilcoxon signed-rank test. fh, n = 51, 292, 223 allogrooming (f), sniffing (g), and self-grooming (h) bouts, respectively (in 7 independent imaging sessions in 6 subject animals). k, permutation test (1000 rounds of permutation). ln, n = 51 short and 38 long allogrooming bouts (from 7 independent imaging sessions in 6 subject animals). Two-sided Wilcoxon rank-sum test. ***P < 0.001, **P < 0.01, *P < 0.05. ns, not significant. For details of statistical analyses, see Supplementary Table 1.
Extended Data Fig. 5.
Extended Data Fig. 5.. Activation of MeATac1 neurons promotes allogrooming and self-grooming in males and females.
af, in, Probability of allogrooming (ac, ik) and self-grooming (df, ln) (fraction of trials showing a particular behavior at different time points) with respect to stimulation onset during optogenetic activation in male (af) and female (in) Tac1-Cre (a, d, i, l), Sst-Cre (b, e, j, m), and Cck-Cre (c, f, k, n) animals injected with ChR2 in the MeA. Blue areas: duration of light illumination; time 0: stimulation onset. g, h, o, p, Duration of allogrooming (g, o) and self-grooming (h, p) during photostimulations in male (g, h) and female (o, p) Tac1-Cre, Sst-Cre, and Cck-Cre animals injected with ChR2 in the MeA. q, Average trace showing Ca2+ signal changes during allogrooming toward stressed partners in Sst-Cre subjects expressing GCaMP. Mean ± s.e.m. Time 0: allogrooming onset. r, Comparison of Ca2+ signal changes between Sst+ and Tac1+/Vgat+ neurons during allogrooming using mean ΔF/F after behavior onset. Boxplots: median with quartiles, 1.5 × IQR and outliers. ap, Tac1-Cre, n = 35 trials in 2 males and 17 trials 2 females for both allogrooming and self-grooming. Sst-Cre, n = 25 trials in 2 males and 36 trials in 2 females for both allogrooming and self-grooming. Cck-Cre, n = 24 trials in 2 males and 22 trials in 2 females for both allogrooming and self-grooming. Kruskal-Wallis test followed by post hoc Dunn’s multiple comparisons test. r, n = 40 bouts in 7 GCaMP animals for Sst+ neurons. n = 19 bouts in 6 GCaMP animals for Tac1+/Vgat + neurons. Data for Tac1+/Vgat + neurons are the same as those in Fig. 4k and are presented here for comparison. Two-sided Wilcoxon rank-sum test. ***P < 0.001. **P < 0.01. For details of statistical analyses, see Supplementary Table 1.
Extended Data Fig. 6.
Extended Data Fig. 6.. Activation of MeATac1∩Vgat neurons promotes affiliative allogrooming in males and females.
a, d, Probability of allogrooming toward stressed partners (fraction of trials showing allogrooming at different time points) with respect to stimulation onset in male (a) and female (d) ChR2 animals. b, c, e, f, Boxplots of duration (b, e) and onset latency (c, f) of allogrooming during photostimulations in male (b, c) and female (e, f) EYFP control and ChR2 animals. g, No significant difference in the duration of sniffing during photostimulations between EYFP control and ChR2 animals. Blue areas: duration of light illumination; time 0: stimulation onset. EYFP control males, n = 22 trials in 2 mice. ChR2 males, n = 58 trials in 4 mice. EYFP control females, n = 55 trials in 4 mice. ChR2 females, n = 115 trials in 4 mice. In g, trials from males and females are combined. Boxplots: median with quartiles, 1.5 × IQR and outliers. Two-sided Wilcoxon rank-sum test. ***P < 0.001. ns, not significant. For details of statistical analyses, see Supplementary Table 1.
Extended Data Fig. 7.
Extended Data Fig. 7.. Activation of MeA Tac1+/Vgat neurons promotes self-grooming but not allogrooming.
a, b, Schematic of an intersectional approach for expression of ChR2 in Tac1+/Vgat neurons in the MeA using a Cre-on and Flp-off AAV virus. c, Example images showing that the majority of EYFP+ cells are glutamatergic (Vglut2+, 64.0 ± 1.8%, mean ± s.e.m.) and Tac1+ (91.8 ± 0.5%, mean ± s.e.m.) in Tac1Cre/+/VgatFlp/+ animals injected with the Con/Foff-EYFP virus (n = 3 hemispheres independently injected with the virus from 2 mice (5-7 sections per hemisphere). Scale bar, 25 μm. d, e, Probability of self-grooming (d) and allogrooming (e) toward stressed partners (fraction of trials showing a particular behavior at different time points) with respect to stimulation onset in ChR2 animals. Blue areas: duration of light illumination; time 0: stimulation onset. f, Duration of self-grooming and allogrooming toward stressed partners during photostimulations. Boxplots: median with quartiles, 1.5 × IQR and outliers. df, n = 39 trials in 4 mice (18 trials in 2 females and 21 trials in 2 males) for both self-grooming and allogrooming. The Cre-on/Flp-off virus used in the current study has been reported to lead to residual expression in a minor fraction of Cre+/Flp+ cells, possibly due to insufficiency of Flp relative to Cre (refs. 30, 52). Nonetheless, we found that when using this virus, the majority of EYFP+ cells (64.0 ± 1.8%, mean ± s.e.m.) were Vglut2+. Of note, the observation that the Cre-on/Flp-off animals did not show induction of allogrooming behavior suggests that activation of the small fraction of Tac1+/Vgat+ neurons in these animals (concurrent with activation of Tac1+/Vgat neurons) was not sufficient to drive allogrooming behavior. On the other hand, the observation that activation of Tac1+/Vgat+ neurons in animals injected with the Cre-on/Flp-on virus did not trigger self-grooming behavior suggests that the residual Tac1+/Vgat+ neurons labeled with the Cre-on/Flp-off virus are not responsible for the induction of self-grooming.
Extended Data Fig. 8.
Extended Data Fig. 8.. MPOA-projecting MeATac1∩Vgat neurons drive affiliative allogrooming in males and females.
a, b, Example images showing axonal terminals of MeATac1∩Vgat neurons in the MPOA in male (a) and female (b) animals, revealed by immunostaining for EYFP in Tac1Cre/+/VgatFlp/+ animals injected with Con/Fon-ChR2-EYFP. Scale bar, 200 μm. (c, h) Schematics of viral injection and fiber implantation strategies for soma stimulation of retrogradely labeled, MPOA-projecting MeATac1∩Vgat neurons (c) or stimulation of the axonal projection of MeATac1∩Vgat neurons in the MPOA (h). dg, Duration (d, f) and onset latency (e, g) of allogrooming during photostimulations in EYFP control and ChR2 males (d, e) and females (f, g) with soma stimulation of MPOA-projecting MeATac1∩Vgat neurons. il, Duration (i, k) and onset latency (j, l) of allogrooming during photostimulations in EYFP control and ChR2 males (i, j) and females (k, l) with stimulation of the MPOA projection of MeATac1∩Vgat neurons. mo, Probability of allogrooming toward stressed partners (fraction of trials showing allogrooming at different time points) with respect to stimulation onset (m, n) and allogrooming duration (o) during photostimulations of the MPOA projection of MeATac1∩Vgat neurons without or with infusion of lidocaine in the MeA. Blue areas: duration of light illumination; time 0: stimulation onset. p, Example image showing axonal projections of MeATac1∩Vgat neurons in the PMv. Scale bar, 200 μm. q, Duration of allogrooming during photostimulation of the MPOA or PMv projection of MeATac1∩Vgat neurons. Data for MPOA projection stimulation are the same as those in Fig. 4r and are presented here for comparison. Boxplots: median with quartiles, 1.5 × IQR and outliers. dg, il, EYFP control, MeA soma stimulation, n = 52 trials in 4 females and 29 trials in 2 males. ChR2, MeA soma stimulation, n = 68 trials in 4 females and 59 trials in 2 males. EYFP control, MPOA projection stimulation, n = 45 trials in 4 females and 22 trials in 2 males. ChR2, MPOA projection stimulation, n = 40 trials in 3 females and 53 trials in 3 males. mo, n = 36 trials in 4 mice (24 trials from 3 females and 12 trials from 1 male) for the “no lidocaine” group. n = 58 trials in 4 mice (39 trials from 3 females and 19 trials from 1 male) for the “lidocaine” group. q, n = 93 trials in 6 mice (40 trials in 3 females and 53 trials in 3 males) for MPOA stimulation, n = 118 trials in 4 mice (65 trials in 2 females and 53 trials in 2 males) for PMv stimulation. Two-sided Wilcoxon rank-sum test. ***P < 0.001. ns, not significant. For details of statistical analyses, see Supplementary Table 1.
Extended Data Fig. 9.
Extended Data Fig. 9.. Activation of MeAVgat neurons can promote allogrooming during prosocial interaction.
a, Schematic of ChR2 activation in MeAVgat neurons. b, c, Duration of allogrooming (b) and sniffing (c) toward stressed partners during low-intensity photostimulations in ChR2 and EYFP control animals. The increase in sniffing (~1.5 s) appears to be substantially smaller than that in allogrooming (~5 s), suggesting that increased allogrooming is the predominant behavioral effect. d, Duration of triggered allogrooming when subject animals are in the vicinity of and attending to the partners (“optimal” condition) compared to all stimulations. Boxplots: median with quartiles, 1.5 × IQR and outliers. b, EYFP control, n = 119 trials in 11 mice (74 trials in 6 females and 45 trials in 5 males); ChR2, n = 141 trials in 12 mice (88 trials in 7 females and 53 trials in 5 males). c, EYFP control, n = 119 trials in 11 mice (74 trials in 6 females and 45 trials in 5 males); ChR2, n = 142 trials in 12 mice (89 trials in 7 females and 53 trials in 5 males). d, All condition, n = 78 trials in 5 male mice; optimal condition (subject within half a body-length and facing the partner), n = 53 trials in 5 male mice. bd, Two-sided Wilcoxon rank-sum test. ***P < 0.001, **P < 0.01. For details of statistical analyses, see Supplementary Table 1.
Extended Data Fig. 10.
Extended Data Fig. 10.. Activation of MeA Tac1/Vgat+ neurons promotes aggression.
ab, Schematic of an intersectional approach for specific expression of ChR2 in Tac1/Vgat+ neurons in the MeA using a Cre-off and Flp-on AAV. c, Example images showing that EYFP+ cells are predominantly Vgat+ (99.3 ± 1.4%, mean ± s.e.m.) and Tac1 (90.1 ± 1.9%, mean ± s.e.m.) in Tac1Cre/+/VgatFlp/+ animals injected with the Coff/Fon-EYFP AAV (n = 4 hemispheres independently injected with the virus from 2 mice (4-5 sections per hemisphere). Scale bar, 25 μm. d, e, Probability of aggression (d) and allogrooming (e) toward stressed partners (fraction of trials showing a particular behavior at different time points) with respect to stimulation onset in ChR2 animals. Blue areas: duration of light illumination; time 0: stimulation onset. f, Duration of aggression and allogrooming toward stressed partners during photostimulations. Boxplots: median with quartiles, 1.5 × IQR and outliers. df, n = 83 and 80 trials in 4 male mice for aggression and allogrooming, respectively.
Fig. 1.
Fig. 1.. Mice display prosocial comforting behavior.
a, Schematic of prosocial interaction assay. b, Example raster plots showing allogrooming and self-grooming during prosocial interaction. c, Time-courses of cumulative allogrooming duration of subjects and partners after partners experience foot-shocks. Mean ± s.e.m. dh, Total duration (d), onset latency (e), total bout number (f), and average per-bout duration (g) of allogrooming and total duration of self-grooming (h) exhibited by subjects interacting with unstressed (control) or foot-shocked partners. i, j, Total allogrooming duration and total number of social approaches toward subjects exhibited by unstressed or foot-shocked partners. kn, s, t, Total allogrooming duration of subjects and partners after partners experience forced swim (k, l) or acute restraint (m, n), or after odor transfer from a naïve or stressed donor to partners (s, t). o, Schematic of CNN-RNN framework for classifying behaviors. p, q, Performance of binary (p) and four-way multi-class (q) classification of allogrooming, sniffing, self-grooming, or other behaviors. r, t-SNE visualization showing separation of different behaviors based on spatiotemporal features. u, v, Evaluation of stress-relieving effect of prosocial interaction using the open field test. Heatmaps show partners’ average occupancy at different locations. w, x, Fraction of time partners spent in corners of the open field. In b-x, subjects are males; see Extended Data Fig. 1 for female subjects. Boxplots: median, quartiles, 1.5× interquartile range (IQR) and outliers. ***P < 0.001, **P < 0.01, *P < 0.05. For details of statistical analyses and sample sizes, see Supplementary Table 1.
Fig. 2.
Fig. 2.. MeA neural dynamics during prosocial interaction.
a, Schematic of microendoscopic imaging. b, Example image showing GCaMP7f expression in the MeA. Scale bar, 100 μm. c, Single neurons extracted in an example field of view. d, Percentages of cells activated by unstressed and/or stressed conspecifics. e, Heatmaps showing average responses of example cells activated specifically by unstressed or stressed conspecifics (but not both) aligned to onset of sniffing toward different conspecifics. f, g, Responses of unstressed or stressed conspecific-activated (but not both-activated) neurons during sniffing of unstressed or stressed animals, respectively (f) and mean ΔF/F (z-scored) during 0–3 s following sniffing onset (g). h, Performance of decoder classification of sniffing toward unstressed versus stressed conspecifics using population activity. i, Percentages of cells responding during allogrooming and/or sniffing and their spatial locations in an example field of view. j, Example calcium traces of allogrooming- and sniffing-activated cells showing increased single-neuron activity during allogrooming or sniffing toward stressed conspecifics. k, Heatmap showing average responses of example allogrooming-activated cells aligned to allogrooming onset. l, Average responses of allogrooming- and sniffing-activated cells during each behavior. m, Decoder prediction of each behavior using population activity overlaid with ground truth. n, Time-courses of decoder performance. o, PC projections of different behavioral events from one example session. Cross lines, mean ± s.d. p, Performance of decoder classification of different behavior pairs. Time 0: behavior onset. f, g, l, n, mean ± s.e.m. Boxplots: median, quartiles, 1.5× IQR, and outliers. ***P < 0.001, *P < 0.05. For details of statistical analyses and sample sizes, see Supplementary Table 1.
Fig. 3.
Fig. 3.. MeATac1 neurons underlie allogrooming.
a, e, k, Schematics of GtACR2 inhibition (a, k), fiber photometry recording (e), and ChR2 activation (k) in various MeA subpopulations. b, Example image showing GtACR2 expression in Vgat-Cre animals. Scale bar, 200 μm. c-d, Example raster plots (c) and duration (d) of allogrooming during real and sham photoinhibition (5-s) of MeAVgat neurons in control and GtACR2 animals. f-h, Example heatmaps (f) and average traces (g) showing Ca2+ signal changes aligned to allogrooming bouts and mean ΔF/F following allogrooming onset (h) in GCaMP or EYFP control animals. Time 0: allogrooming onset. i, j, Expression of Tac1, Sst, and Cck mRNAs in the MeA (i) and overlaps between pairs of markers (j). Scale bar, 50 μm. l, m, n, Allogrooming probability (l) and duration (m, n) during activation (15-s) of MeATac1, MeASst, and MeACck neurons in ChR2 animals (l, m) and during real and sham photoinhibition (5-s) of MeATac1 neurons in control and GtACR2 animals (n). l, Blue areas: light illumination duration; time 0: illumination onset. g, j, mean ± s.e.m. Boxplots: median, quartiles, 1.5× IQR, and outliers. ***P < 0.001. For details of statistical analyses and sample sizes, see Supplementary Table 1.
Fig. 4.
Fig. 4.. MPOA-projecting MeATac1∩Vgat neurons drive allogrooming.
a, Example images of Con/Fon-EYFP expression in the MeA of Tac1-Cre+/Vgat-Flp+ (but not Tac1-Cre/Vgat-Flp+, Tac1-Cre+/Vgat-Flp, or Tac1-Cre/Vgat-Flp) animals. Scale bar, 200 μm. b, c, Example images (b) and quantification (c) showing the overlap between Tac1, Vgat, and Con/Fon-EYFP expression in the MeA of Tac1-Cre+/Vgat-Flp+ animals. Scale bar, 25 μm. d, h, l, p, Schematics of fiber photometry of MeATac1∩Vgat neurons (h) and ChR2 activation of MeATac1∩Vgat neurons (d), of retrogradely targeted MPOA-projecting MeATac1∩Vgat neurons (l), and of axonal projections of MeATac1∩Vgat neurons in the MPOA (p). e, g, Probability (e) and duration (g) of allogrooming toward foot-shocked or unstressed (“sep only”) partners during photostimulation (15-s) in control and ChR2 animals. f, Self-grooming probability during photostimulation in ChR2 animals. ik, Example heatmaps (i) and average traces (j) showing Ca2+ signal changes aligned to allogrooming bouts and mean ΔF/F following allogrooming onset (k) in GCaMP or EYFP control animals. Time 0: allogrooming onset. ms, Allogrooming probability (m, q), duration (n, r), and onset latency (o, s) during soma stimulation (15-s) of retrogradely targeted MPOA-projecting MeATac1∩Vgat neurons (mo) or stimulation (10-s) of axonal projections of MeATac1∩Vgat neurons in the MPOA (qs). e, f, m, q, Blue areas: stimulation duration; time 0: stimulation onset. c, j, mean ± s.e.m. Boxplots: median, quartiles, 1.5 × IQR, and outliers. ***P < 0.001. For details of statistical analyses and sample sizes, see Supplementary Table 1.

Comment in

  • Comforting in mice.
    Ranade S. Ranade S. Nat Neurosci. 2021 Dec;24(12):1640. doi: 10.1038/s41593-021-00979-2. Nat Neurosci. 2021. PMID: 34848880 No abstract available.

References

    1. de Waal FBM & Preston SD Mammalian empathy: behavioural manifestations and neural basis. Nat Rev Neurosci 18, 498–509 (2017). - PubMed
    1. Dunfield KA A construct divided: prosocial behavior as helping, sharing, and comforting subtypes. Front Psychol 5, 958 (2014). - PMC - PubMed
    1. Rault J-L Be kind to others: Prosocial behaviours and their implications for animal welfare. Appl Anim Behav Sci 210, 113–123 (2019).
    1. Morrison I Keep Calm and Cuddle on: Social Touch as a Stress Buffer. Adapt Hum Behav Physiology 2, 344–362 (2016).
    1. Spruijt BM, Hooff J. A. van & Gispen WH Ethology and neurobiology of grooming behavior. Physiol Rev 72, 825–852 (1992). - PubMed

Publication types