. 2016 Nov 1;831(1):18.
doi: 10.3847/0004-637x/831/1/18. Epub 2016 Oct 21.

GALACTIC COSMIC RAYS IN THE LOCAL INTERSTELLAR MEDIUM: VOYAGER 1 OBSERVATIONS AND MODEL RESULTS

Affiliations

GALACTIC COSMIC RAYS IN THE LOCAL INTERSTELLAR MEDIUM: VOYAGER 1 OBSERVATIONS AND MODEL RESULTS

A C Cummings et al. Astrophys J. .

Abstract

Since 2012 August Voyager 1 has been observing the local interstellar energy spectra of Galactic cosmic-ray nuclei down to 3 MeV nuc-1 and electrons down to 2.7 MeV. The H and He spectra have the same energy dependence between 3 and 346 MeV nuc-1, with a broad maximum in the 10-50 MeV nuc-1 range and a H/He ratio of 12.2 ± 0.9. The peak H intensity is ~15 times that observed at 1 AU, and the observed local interstellar gradient of 3-346 MeV H is -0.009 ± 0.055% AU-1, consistent with models having no local interstellar gradient. The energy spectrum of electrons (e - + e +) with 2.7-74 MeV is consistent with E -1.30±0.05 and exceeds the H intensity at energies below ~50 MeV. Propagation model fits to the observed spectra indicate that the energy density of cosmic-ray nuclei with >3 MeV nuc-1 and electrons with >3 MeV is 0.83-1.02 eV cm-3 and the ionization rate of atomic H is in the range of 1.51-1.64 × 10⁻¹⁷ s-1. This rate is a factor >10 lower than the ionization rate in diffuse interstellar clouds, suggesting significant spatial inhomogeneity in low-energy cosmic rays or the presence of a suprathermal tail on the energy spectrum at much lower energies. The propagation model fits also provide improved estimates of the elemental abundances in the source of Galactic cosmic rays.

Keywords: ISM: abundances; ISM: clouds; cosmic rays.


Figures
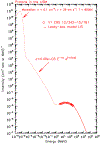
Figure 16.
Figure 16.
Possible suprathermal tail on interstellar wind distribution that could account for factor of 12 increase in ionization rate of atomic H. The portion of the GCR LISM spectrum ⩾3 MeV is from the LBM model.
Figure 17.
Figure 17.
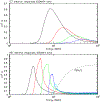
GEANT4-derived response functions for rates of four TET ranges and five HET channel pairs, as described in the text. In addition, the response of HET to electrons that penetrate the HET telescope is shown as the dotted line, which is used in calculating the electron contribution to the PENH rate shown in Figure 1.
Figure 18.
Figure 18.
Daily averaged D13 (top) and D16 (bottom) counting rates since launch in 1977. Also shown is the estimated rate of background events.
Figure 19.
Figure 19.
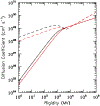
Rigidity dependence of the diffusion coefficients for the GALPROP models. Shown are curves for the DR model (solid) and for the PD2 model (dashed). The curve for the PD1 model is almost identical to that for PD2. We show curves for two values of atomic number over charge, A/Z = 1 (black), 2 (red).
Figure 1.
Figure 1.
PENH counting rate dominated by protons >70 MeV from 1977/251 through 2015/280 from the V1 CRS instrument. The crossing of the solar wind termination shock is labeled by TSX and that of the heliopause by HPX. The inset shows the time period since 2012.0 in more detail. The vertical dotted lines show the boundaries of the time period selected for most of the analysis.
Figure 2.
Figure 2.
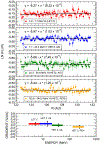
Top four panels: intensity of protons in four energy bands vs. heliocentric radial distance of V1. The open symbols in the top four panels represent data acquired during transient disturbances and were not included in the fits. The time period covered is 2012/342–2015/181. All data are plotted with statistical uncertainties only. The equations representing the fits are shown in the panels with y being the ordinate and x being the abscissa. Bottom panel: radial gradient vs. energy. The labels refer to data from different telescopes and modes, which are described in the Appendix (see also Stone et al. 1977).
Figure 3.
Figure 3.
Top row: differential energy spectra of H (left) and He (right) from V1 for the period 2012/342–2015/181, and solar-modulated spectra at 1 AU from a BESS balloon flight in 1997 (Shikaze et al. 2007) and from IMP8 in the latter part of 1996 (McDonald 1998). The three different symbols for the V1 data correspond to different telescope types described in the Appendix. All data are plotted with their statistical and systematic uncertainties added in quadrature. Also shown are estimated spectra in the LISM from a leaky-box model and three GALPROP models as described in the text. Middle row: ratio of model intensities to V1 observations below ~600 MeV nuc−1 and to BESS observations above ~10 GeV nuc−1. Bottom row: ratio of models to GALPROP DR model. Note that for H and He, the GALPROP PD1 and PD2 models are essentially identical. Data analysis techniques used to derive the Voyager data are described in the Appendix and the Voyager data are listed in Tables 7 and 8.
Figure 4.
Figure 4.
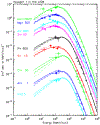
Differential energy spectra from V1. The different symbols for the V1 data correspond to different telescope types described in the Appendix. The data are plotted with the statistical and systematic uncertainties added in quadrature. At energies above ~3 GeV nuc−1 the data are from the HEAO-3-C2 instrument (Engelmann et al. 1990). Also shown are estimated spectra in the LISM from a leaky-box model and three GALPROP models as described in the text. The line types for the models are the same as in Figure 3 and are as follows: dotted for LBM, solid for GALPROP DR, dashed for GALPROP PD2, and dot-dashed for GALPROP PD1. The time period for the open and closed circles is 2012/342–2015/181; the time period for the open squares is 2012/342–2014/365. The Voyager data are listed in Table 9.
Figure 5.
Figure 5.
Similar to Figure 4 except for the elements Na through K.
Figure 6.
Figure 6.
Similar to Figure 4 except for the elements Ca through Ni.
Figure 7.
Figure 7.
Ratios of model intensities to V1 observed intensities at 80 MeV nuc−1. The data are plotted with the statistical and systematic uncertainties added in quadrature.
Figure 8.
Figure 8.
Left panel: energy spectrum of electrons as derived from TET and HET BSe data from the CRS instrument on V1 (e + e+) for the period 2012/342–2015/181 (see the Appendix for more information). Results from the TET telescope are shown as open circles and are derived using response functions based on simulations using the GEANT4 code (Agostinelli et al. 2003; Allison et al. 2006; also see www.geant4.cern.ch). Results from the HET telescope are shown with closed circles, which were also derived using response functions from GEANT4 simulations. A power-law function was fit to the data and the resulting fit is shown as the solid line. The data points are placed at the appropriate energies based on the response functions used in the procedure. Five different estimates of the interstellar energy spectra of electrons are also shown: Strong et al. (2011), Potgieter et al. (2015), Ip & Axford (1985), Langner et al. (2001), and Webber & Higbie (2008). The data at higher energies (e + e+, open squares) are from the AMS-02 mission at 1 AU from 2011 May 19 through 2013 November 26 (Aguilar et al. 2014b). The Voyager data are tabulated in Table 10. Right panel: the V1 electron and proton data are repeated from the left panel (electrons) and from Figure 3 (protons). At higher energies data are also repeated and the proton data from BESS is further restricted to show only the region that is not significantly modulated. The dotted curve is the estimated LISM electron spectrum from Potgieter et al. (2015). The solid curve is the calculated LISM proton spectrum from the GALPROP DR model.
Figure 9.
Figure 9.
Ratio of B to C from V1 (this work), HEAO-3 (Engelmann et al. 1990), and PAMELA (Adriani et al. 2014), together with results from three of the models. For the Voyager data, the uncertainties reflect statistical uncertainty and the 5% point-to-point systematic uncertainty added in quadrature.
Figure 10.
Figure 10.
Plot of two semi-independent determinations of the charge of each nucleus vs. the average of the two determinations for B, C, N, and O nuclei, demonstrating the clean separation of these elements in the LET telescopes. The two left panels show all of the data and the two right panels show the data after cuts are applied to remove background. The background is insignificant. See the Appendix for more details of the data analysis technique.
Figure 11.
Figure 11.
GCR elemental source abundances relative to solar system abundances as described in the text. The solar system abundances are taken from Table 6 of Lodders et al. (2009) and their uncertainties have not been taken into account in forming the ratios.
Figure 12.
Figure 12.
Cross-section in cm2 for ionization of atomic H by energetic electrons, H ions, and He ions. The curves are from Equations (2)-(5). The vertical lines represent the energy range of the V1 observations with solid being for H, dotted for He, and dashed for electrons.
Figure 13.
Figure 13.
Ionization rate from GCR nuclei relative to the total GCR-nuclei-induced ionization rate of atomic H based on the GALPROP DR model of the interstellar energy spectra.
Figure 14.
Figure 14.
Energy density of GCR nuclei relative to the total GCR nuclei energy density based on the GALPROP DR model of the interstellar energy spectra.
Figure 15.
Figure 15.
Differential energy density multiplied by energy for H, He, and e vs. energy using the GALPROP DR model for the interstellar energy spectra of H and He and the Potgieter et al. (2015) model of the interstellar electron spectrum. This presentation indicates at what energies the maximum contribution to the energy density arises. Shown as vertical lines are the energy ranges of the Voyager observations (solid: H; dotted: He; and dashed: electrons).

References

    1. Ackermann M, et al. 2012, ApJ, 750, 3
    1. Adriani O, Barbarino GC, Bazilevskaya GA, et al. 2011, Sci, 332, 69 - PubMed
    1. Adriani O, Barbarino GC, Bazilevskaya GA, et al. 2014, ApJ, 791, 93
    1. Agostinelli S, Allison J, Amako K, et al. 2003, NIMPA, 506, 250
    1. Aguilar M, Aisa D, Alpat B, et al. 2014b, PhRvL, 113, 221102 - PubMed