. 2021 Sep 27:27:1609968.
doi: 10.3389/pore.2021.1609968. eCollection 2021.

Identification of Novel Diagnosis Biomarkers for Therapy-Related Neuroendocrine Prostate Cancer

Affiliations

Identification of Novel Diagnosis Biomarkers for Therapy-Related Neuroendocrine Prostate Cancer

Cuijian Zhang et al. Pathol Oncol Res. .

Abstract

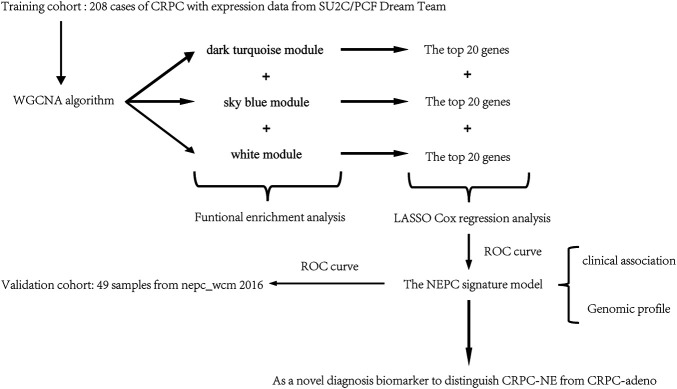
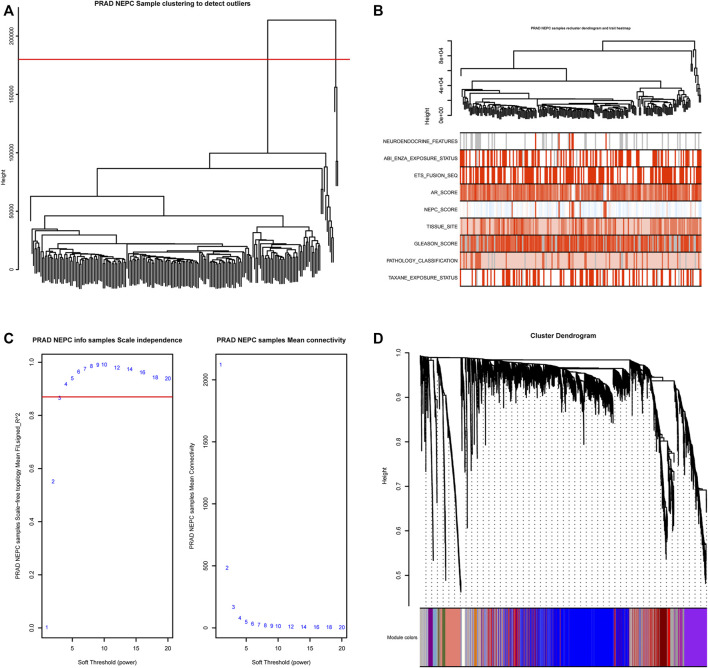
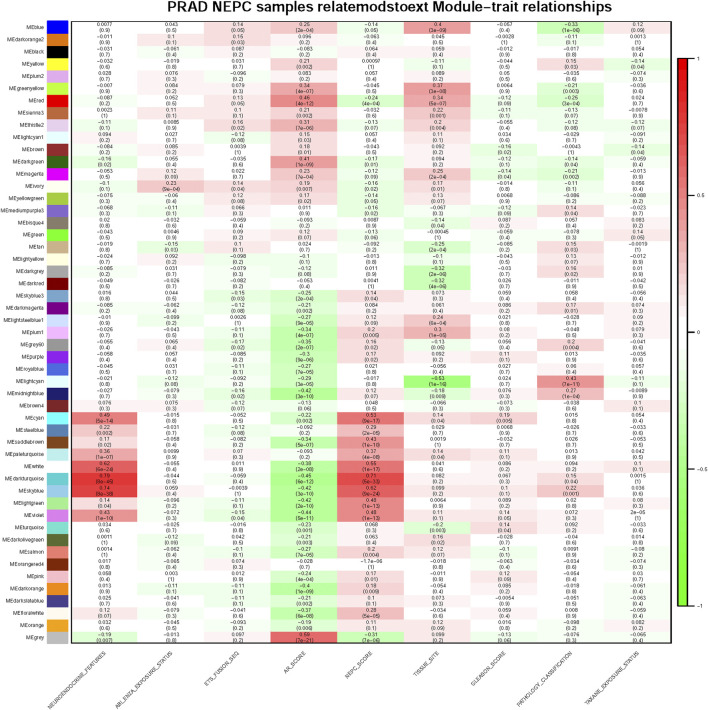
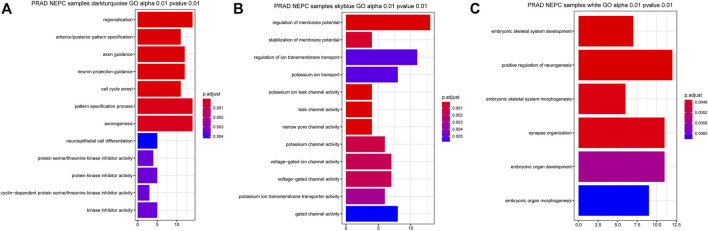
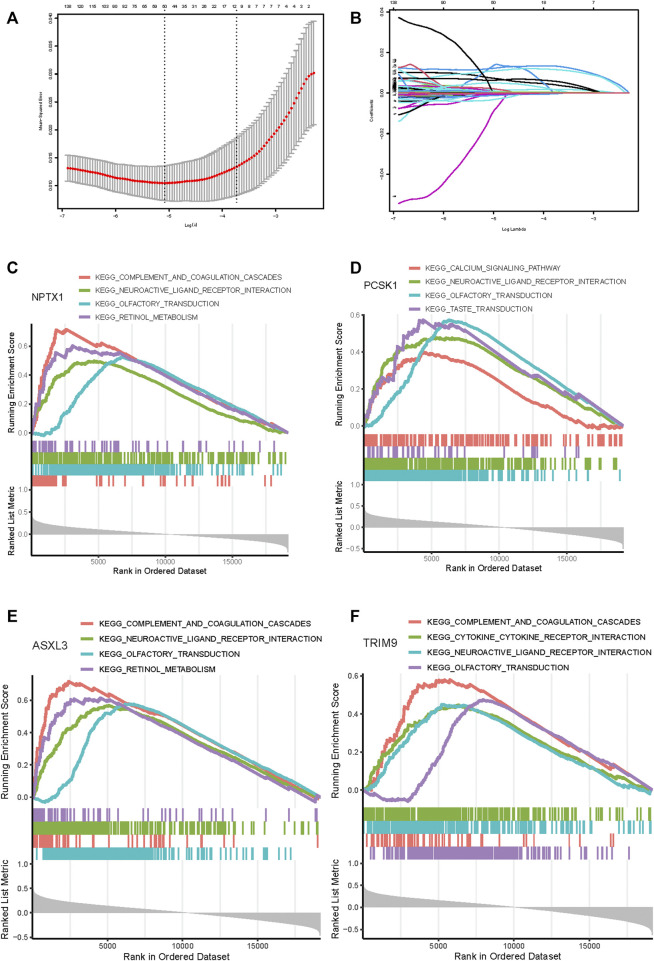
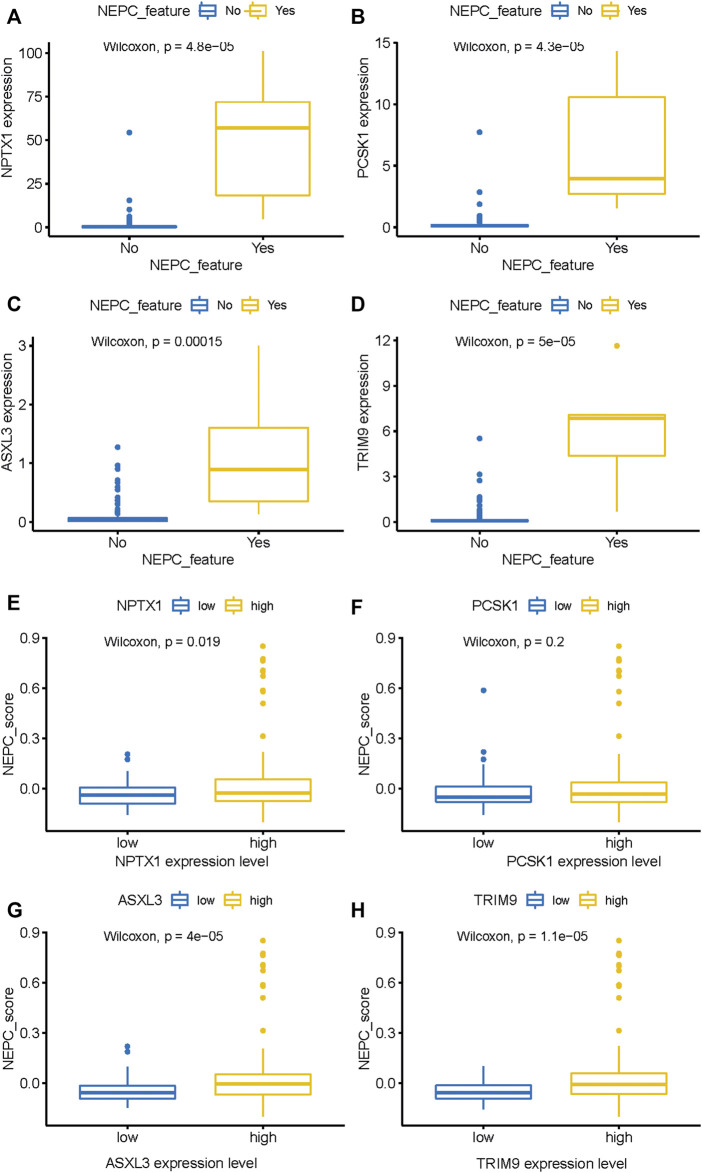
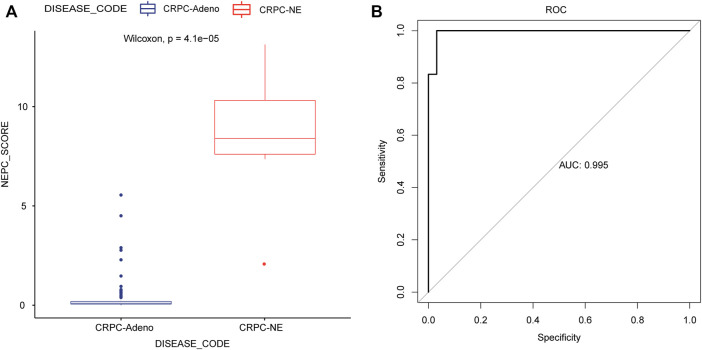
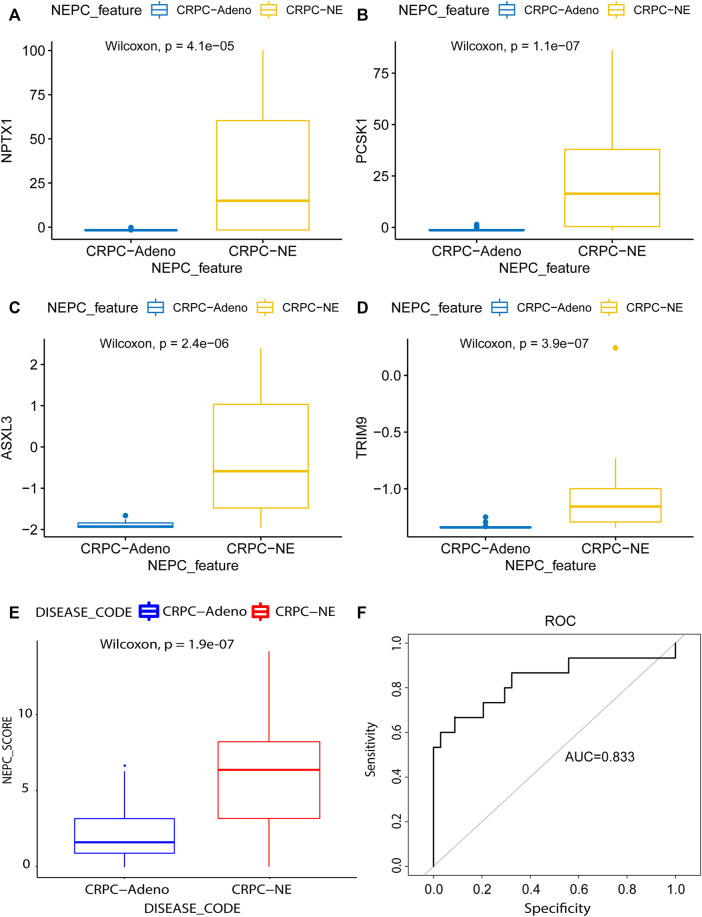
Background: Therapy-related neuroendocrine prostate cancer (NEPC) is a lethal castration-resistant prostate cancer (CRPC) subtype that, at present, lacks well-characterized molecular biomarkers. The clinical diagnosis of this disease is dependent on biopsy and histological assessment: methods that are experience-based and easily misdiagnosed due to tumor heterogeneity. The development of robust diagnostic tools for NEPC may assist clinicians in making medical decisions on the choice of continuing anti-androgen receptor therapy or switching to platinum-based chemotherapy. Methods: Gene expression profiles and clinical characteristics data of 208 samples of metastatic CRPC, including castration-resistant prostate adenocarcinoma (CRPC-adeno) and castration-resistant neuroendocrine prostate adenocarcinoma (CRPC-NE), were obtained from the prad_su2c_2019 dataset. Weighted Gene Co-expression Network Analysis (WGCNA) was subsequently used to construct a free-scale gene co-expression network to study the interrelationship between the potential modules and clinical features of metastatic prostate adenocarcinoma and to identify hub genes in the modules. Furthermore, the least absolute shrinkage and selection operator (LASSO) regression analysis was used to build a model to predict the clinical characteristics of CRPC-NE. The findings were then verified in the nepc_wcm_2016 dataset. Results: A total of 51 co-expression modules were successfully constructed using WGCNA, of which three co-expression modules were found to be significantly associated with the neuroendocrine features and the NEPC score. In total, four novel genes, including NPTX1, PCSK1, ASXL3, and TRIM9, were all significantly upregulated in NEPC compared with the adenocarcinoma samples, and these genes were all associated with the neuroactive ligand receptor interaction pathway. Next, the expression levels of these four genes were used to construct an NEPC diagnosis model, which was successfully able to distinguish CRPC-NE from CRPC-adeno samples in both the training and the validation cohorts. Moreover, the values of the area under the receiver operating characteristic (AUC) were 0.995 and 0.833 for the training and validation cohorts, respectively. Conclusion: The present study identified four specific novel biomarkers for therapy-related NEPC, and these biomarkers may serve as an effective tool for the diagnosis of NEPC, thereby meriting further study.

Keywords: LASSO; WGCNA; biomarker; mCRPC; neuroendocrine prostate cancer (NEPC); signature.


Conflict of interest statement

The authors declare that the research was conducted in the absence of any commercial or financial relationships that could be construed as a potential conflict of interest.

Figures

FIGURE 1
FIGURE 1
A workflow chart for constructing an NEPC signature model.
FIGURE 2
FIGURE 2
WGCNA module clustering and soft threshold power identification. (A) Hierarchical clustering dendrogram of 208 samples based on the Euclidean distance; all samples were included in the analysis. (B) The clustering dendrogram and heat map shows the Euclidean distance and sample characteristic correlations. Light color represents a lower value, dark color represents a higher value, and grey represents a missing value. (C) Soft threshold power screening based on the network topology, the analysis used a power of 3 as the package suggested, the left panel is the coordinate map of the soft-thresholding power (x-axis) and the scale-free fit index (y-axis), and the right panel is the coordinate map of the mean connectivity (y-axis) and the soft-thresholding power (x-axis). (D) Co-expression Module clustering and identification dendrogram, 51 modules were identified and each row includes the highly correlated genes of one module.
FIGURE 3
FIGURE 3
Module and clinical characteristic relationship based on WGCNA. Module and clinical characteristic relationship heat map. In each cell, the correlation between the corresponding module and characteristic are displayed with correlation numbers and colors (red as 0.0 ∼ 1.0, green as −1.0 ∼ 0.0) and p-values are also shown in each cell, darker color means higher correlation.
FIGURE 4
FIGURE 4
Related signaling pathway of the three most related modules with NEPC score. (A) GO analysis of the dark turquoise module (A), sky blue module (B), and white module (C). The color indicates the significant degree of enrichment and the size indicates the number of genes enriched for each result.
FIGURE 5
FIGURE 5
Feature genes selection using the least absolute shrinkage and selection operator (LASSO) binary logistic regression model. (A) The result of LASSO regression analysis. (B) LASSO coefficient profiles of the 60 genes. A coefficient profile plot was produced against the log(L) sequence. Gene set enrichment analysis for NPTX1 (C), PCSK1 (D), ASXL3 (E), and TRIM9 (F). The top four pathways enriched in the high expression group are shown.
FIGURE 6
FIGURE 6
The expression level of four genes between samples with NEPC feature or not from the SU2C dataset. NPTX1 (A), PCSK1 (B), ASXL3 (C), and TRIM9 (D) expression level in samples with (N = 6) or without (N = 161) NEPC feature. The relationship between the expression level of identified biomarkers [NPTX1 (E), PCSK1 (F), ASXL3 (G), and TRIM9 (H)] and the NEPC score. The median value of gene expression level was used as a cutoff to classify samples into high- (N = 104) and low- (N = 104) expression level groups.
FIGURE 7
FIGURE 7
Application and evaluation of the NEPC predicted signature model. (A) The differences in predicted signature score between CRPC-NE and CRPC-adeno samples. (B) The ROC curves for NEPC predicted signature model in the training cohort.
FIGURE 8
FIGURE 8
Model validation using the lasso method in an independent dataset. The mRNA differential expression analysis of four potential predicting genes between the samples with (N = 15) or without (N = 34) NE feature in the nepc_wcm_2016 dataset. (A) NPTX1. (B) PCSK1. (C) ASXL3. (D) TRIM9. (E) The differences in predicted signature score between NEPC and Adenocarcinoma samples. (F) NEPC feature-dependent ROC curves were performed in the validation cohort.
FIGURE 9
FIGURE 9
Genomic alterations in samples with high and low NEPC signature. The oncoprint results of samples with high (A) and low (B) NEPC signature of SU2C dataset. The oncoprint results of samples with high (C) and low (D) NEPC signature of WCM dataset. The top 20 most prevalent genes were presented.

Similar articles

Cited by

References

    1. MaryBeth BC, Isabelle S, Jason AE, Freddie B, Ahmedin J. Recent Global Patterns in Prostate Cancer Incidence and Mortality Rates. Amsterdam, Netharlands: European Urology; (2019). - PubMed
    1. Bray F, Ferlay J, Soerjomataram I, Siegel RL, Torre LA, Jemal A. Global Cancer Statistics 2018: GLOBOCAN Estimates of Incidence and Mortality Worldwide for 36 Cancers in 185 Countries. CA: A Cancer J Clinicians (2018) 68(6):394–424. 10.3322/caac.21492 - DOI - PubMed
    1. Rebello RJ, Oing C, Knudsen KE, Loeb S, Johnson DC, Reiter RE, et al. Prostate Cancer. Nat Rev Dis Primers (2021) 7(1):9. 10.1038/s41572-020-00243-0 - DOI - PubMed
    1. Yamada Y, Beltran H. Clinical and Biological Features of Neuroendocrine Prostate Cancer. Curr Oncol Rep (2021) 23(2):15. 10.1007/s11912-020-01003-9 - DOI - PMC - PubMed
    1. Vincenza C, Clara O, Kenneth WE, Rohan B, Michael S, Ana M, et al. Clinical Features of Neuroendocrine Prostate Cancer. Eur J Cancer (2019).

MeSH terms

Substances

LinkOut - more resources