. 2021 Sep 27:15:719254.
doi: 10.3389/fnhum.2021.719254. eCollection 2021.

Functional Magnetic Resonance Imaging Reveals Early Connectivity Changes in the Auditory and Vestibular Cortices in Idiopathic Sudden Sensorineural Hearing Loss With Vertigo: A Pilot Study

Affiliations

Functional Magnetic Resonance Imaging Reveals Early Connectivity Changes in the Auditory and Vestibular Cortices in Idiopathic Sudden Sensorineural Hearing Loss With Vertigo: A Pilot Study

Qiuxia Wang et al. Front Hum Neurosci. .

Abstract

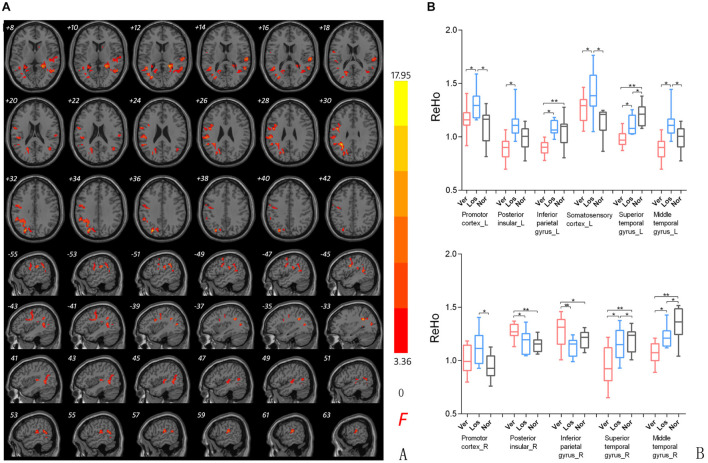
The underlying pathophysiology of idiopathic sudden sensorineural hearing loss (ISSNHL) with vertigo has yet to be identified. The aims of the current study were (1) to elucidate whether there are functional changes of the intrinsic brain activity in the auditory and vestibular cortices of the ISSNHL patients with vertigo using resting-state functional magnetic resonance imaging (rs-fMRI) and (2) whether the connectivity alterations are related to the clinical performance associated with ISSNHL with vertigo. Twelve ISSNHL patients with vertigo, eleven ISSNHL patients without vertigo and eleven healthy subjects were enrolled in this study. Rs-fMRI data of auditory and vestibular cortices was extracted and regional homogeneity (ReHo) and seed-based functional connectivity (FC) were evaluated; the chi-square test, the ANOVA and the Bonferroni multiple comparison tests were performed. Significantly decreased ReHo in the ipsilateral auditory cortex, as well as increased FC between the inferior parietal gyrus and the auditory cortex were found in the ISSNHL with vertigo groups. These findings contribute to a characterization of early plastic changes in ISSNHL patients with vertigo and cultivate new insights for the etiology research.

Keywords: idiopathic sudden sensorineural hearing loss; neural plasticity; regional homogeneity; resting-state functional magnetic resonance imaging; vertigo.


Conflict of interest statement

The authors declare that the research was conducted in the absence of any commercial or financial relationships that could be construed as a potential conflict of interest.

Figures

FIGURE 1
FIGURE 1
The image acquisition and statistical analysis process were summarized and depicted in this flowchart. BOLD, blood oxygen level-dependent; ReHo, regional homogeneity; DICOM-NIFIT, three-dimensional fMRI data is generally in DICOM format or NIFIT format.
FIGURE 2
FIGURE 2
(A) ReHo comparison among groups. ReHo signal differences among ISSNHL with vertigo (Ver), ISSNHL without vertigo (Los), and normal hearing (Nor) groups. Slice coordinates according to Montreal Neurological Institute space are shown in the left corner of the slices, indicating the Z-axis in axial orientation and the X-axis in sagittal slices. Red denotes the regions that differed among the three groups. Differences were considered significant at a threshold of p < 0.001, corrected via Alpahsim correction. (B) Post hoc comparison of clusters showing significant differences in the three groups pairwise analysis (Ver vs. Nor, Los vs. Nor, Ver vs. Los). P*/** < 0.001.
FIGURE 3
FIGURE 3
Sagittal planes of the auditory cortex were exhibited in the ReHo maps of the left and right hearing loss patients separately. The clusters of significant difference in the Bonferroni multiple comparison tests correspond to regions listed in Table 2. Slices (A–F) showed contralateral brain changes and (G–L) showed ipsilateral changes. Crosshair demonstrated the peak value of the cluster and color bars were displayed in the right corner. Ver, ISSNHL with vertigo group; Los, ISSNHL without vertigo group, and Nor, normal hearing group.
FIGURE 4
FIGURE 4
Three-dimensional rendering of the functional connectivity results (P < 0.001, Alphasim correction). A represented the left auditory cortex functional connectivity results and B represented the right auditory cortex results. The clusters of significant difference in the two sample T tests correspond to regions listed in Table 3. MNI coordinate of the ROI seed (left auditory cortex, -55/-26/12; right auditory cortex, 58/-25/16) were shown in gray ball and the positive FC connectivity areas were shown in red ball. The blue line indicated decreased connectivity and the red line indicated increased connectivity. PC, Premotor Cortex;SC, Somatosensory Cortex;IPG, Inferior Parietal Gyrus;AC, auditory cortex;MTG, Middle Temporal Gyrus;ITG, Inferior Temporal Gyrus;DPC, Dorsolateral Prefrontal Cortex;L, left;R, Right.
FIGURE 5
FIGURE 5
Relationship between Dizziness Handicap Index (DHI) and ReHo signals in ISSNHL with vertigo by scatter plot. The DHI showed significantly negative correlation (r = -0.595, p < 0.05) with ReHo signals from the right superior temporal gyrus, and significantly positive correlations with ReHo signals in the left (r = 0.579, p < 0.05) and right inferior parietal gyri (r = 0.834, p < 0.01). PC, Premotor Cortex; SC, Somatosensory Cortex; IPG, Inferior Parietal Gyrus; STG, Superior Temporal Gyrus; MTG, Middle Temporal Gyrus; ITG, Inferior Temporal Gyrus; PI, Posterior Insular; L, left;R, Right.

References

    1. Ashburner J. (2018). A fast diffeomorphic image registration algorithm. Neuroimage 38 95–113. 10.1016/j.neuroimage.2007.07.007 - DOI - PubMed
    1. Bense S., Bartenstein P., Lochmann M., Schlindwein P., Brandt T., Dieterich M. (2004). Metabolic changes in vestibular and visual cortices in acute vestibular neuritis. Ann. Neurol. 56 624–630. 10.1002/ana.20244 - DOI - PubMed
    1. Bense S., Stephan T., Yousry T. A., Brandt T., Dieterich M. (2001). Multisensory cortical signal increases and decreases during vestibular galvanic stimulation (fMRI). J. Neurophysiol. 85 886–899. 10.1152/jn.2001.85.2.886 - DOI - PubMed
    1. Brandt T., Dieterich M. (1998). The vestibular cortex. Its locations, functions, and disorders. Ann. N. Y. Acad. Sci. 871 293–312. 10.1111/j.1749-6632.1999.tb09193.x - DOI - PubMed
    1. Brandt T., Bartenstein P., Janek A., Dieterich M. (1998). Reciprocal inhibitory visual–vestibular interaction. Visual motion stimulation deactivates the parieto-insular vestibular cortex. Brain 121 (Pt 9) 1749–1758. 10.1093/brain/121.9.1749 - DOI - PubMed

LinkOut - more resources