. 2021 Sep 27:12:729524.
doi: 10.3389/fphar.2021.729524. eCollection 2021.

Fascin-1 is Highly Expressed Specifically in Microglia After Spinal Cord Injury and Regulates Microglial Migration

Affiliations

Fascin-1 is Highly Expressed Specifically in Microglia After Spinal Cord Injury and Regulates Microglial Migration

Shuisheng Yu et al. Front Pharmacol. .

Abstract

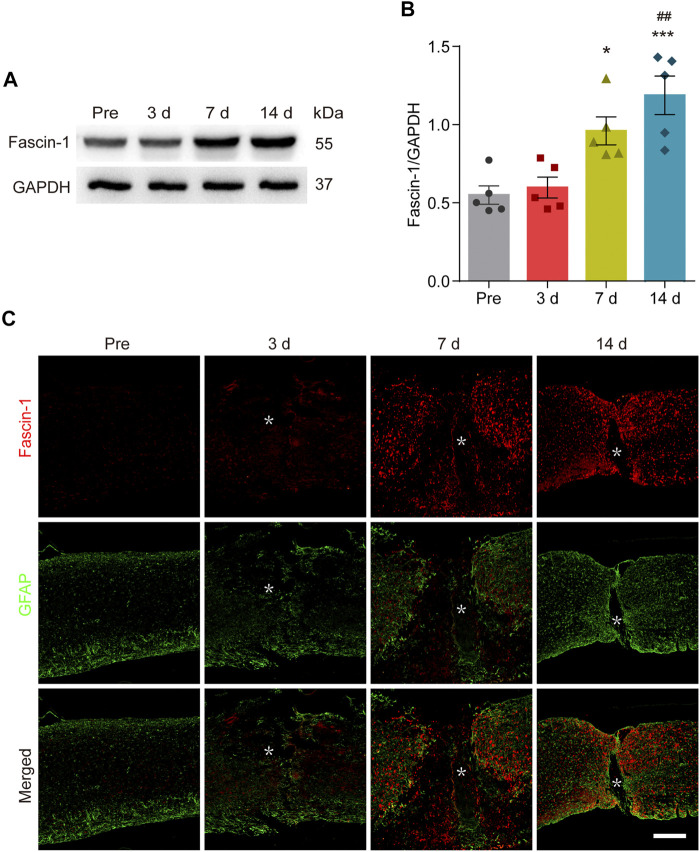
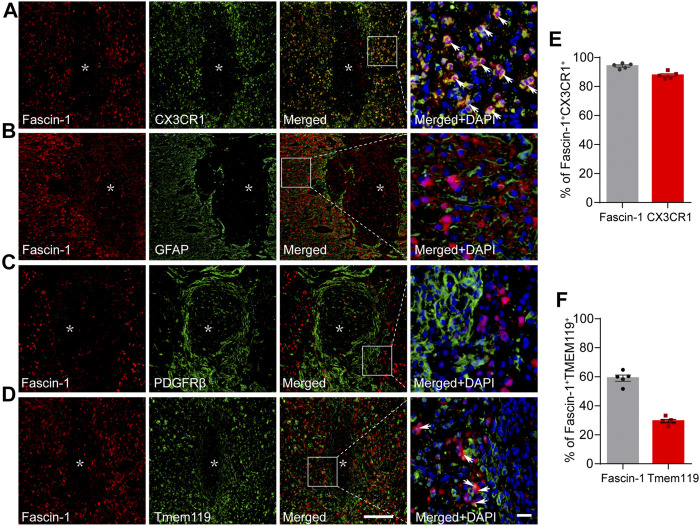
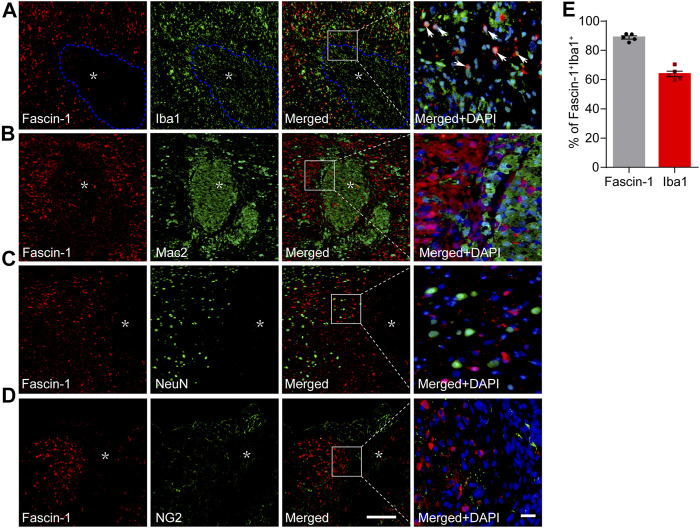
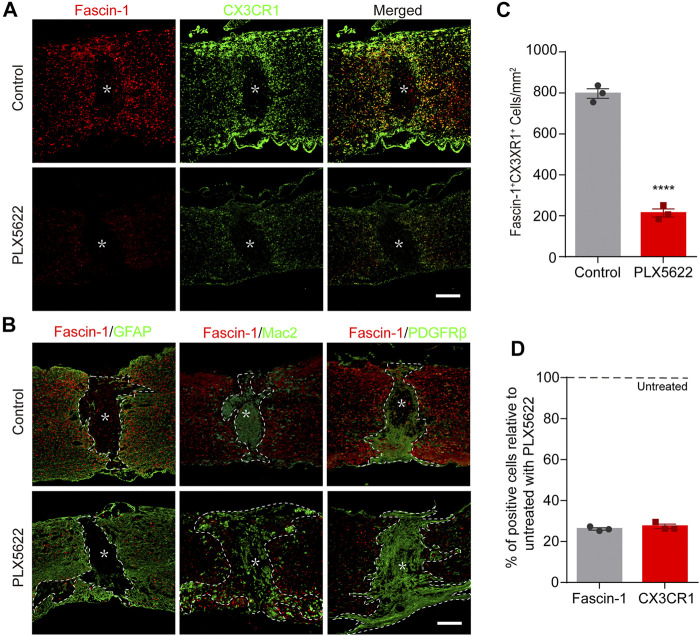
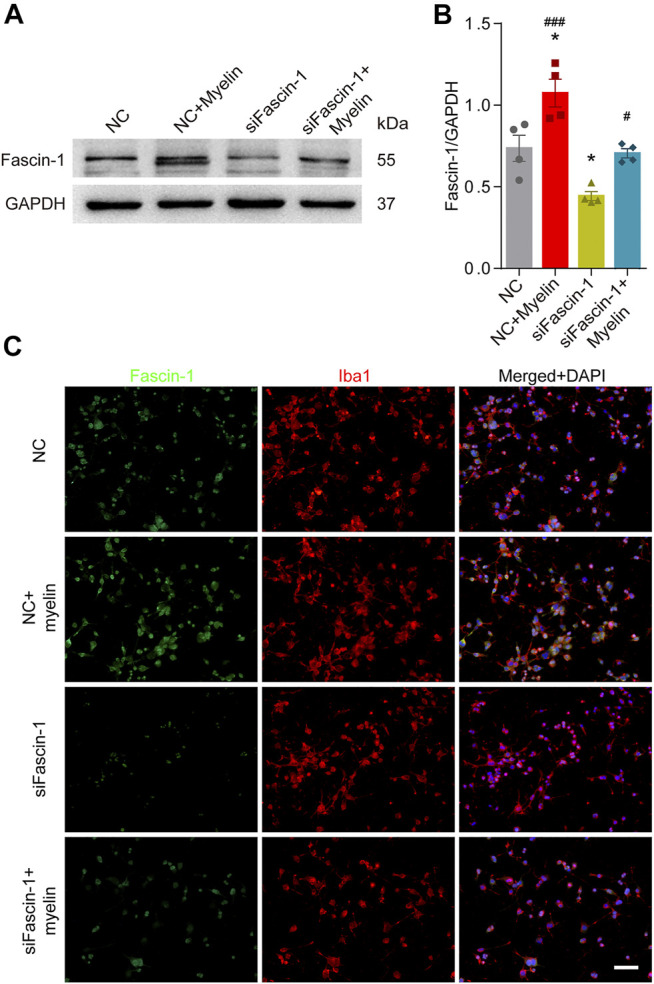
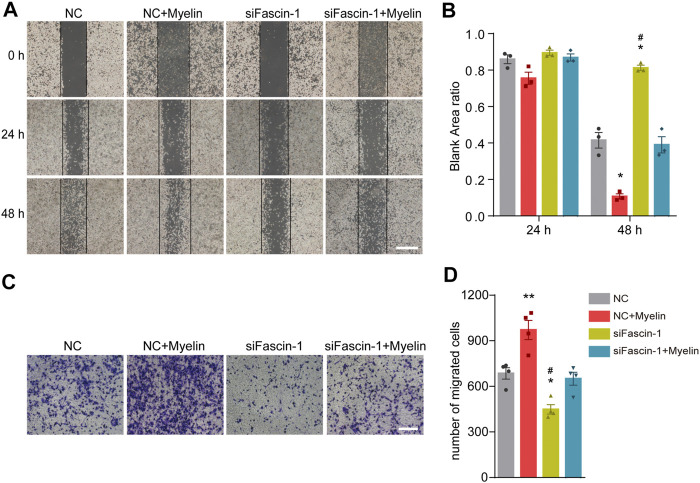
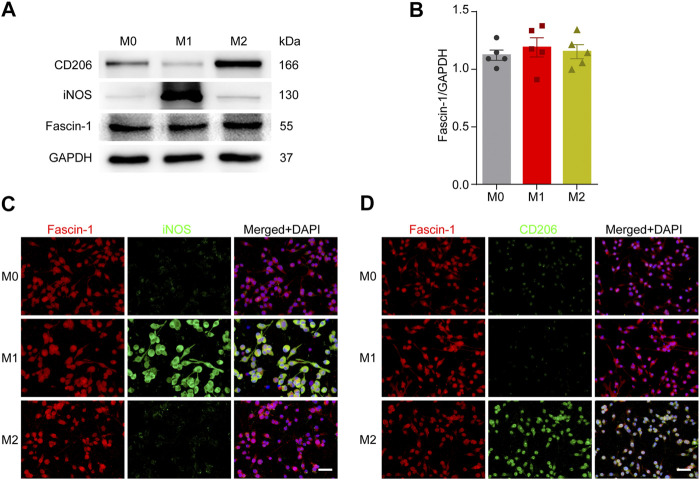
Recent research indicates that after spinal cord injury (SCI), microglia accumulate at the borders of lesions between astrocytic and fibrotic scars and perform inflammation-limiting and neuroprotective functions, however, the mechanism of microglial migration remains unclear. Fascin-1 is a key actin-bundling protein that regulates cell migration, invasion and adhesion, but its role during SCI has not been reported. Here, we found that at 7-14 days after SCI in mice, Fascin-1 is significantly upregulated, mainly distributed around the lesion, and specifically expressed in CX3CR1-positive microglia. However, Fascin-1 is not expressed in GFAP-positive astrocytes, NeuN-positive neurons, NG2-positive cells, PDGFRβ-positive cells, or blood-derived Mac2-positive macrophages infiltrating into the lesion core. The expression of Fascin-1 is correspondingly decreased after microglia are specifically depleted in the injured spinal cord by the colony-stimulating factor 1 receptor (CSF1R) inhibitor PLX5622. The upregulation of Fascin-1 expression is observed when microglia are activated by myelin debris in vitro, and microglial migration is prominently increased. The inhibition of Fascin-1 expression using small interfering RNA (siRNA) markedly suppresses the migration of microglia, but this effect can be reversed by treatment with myelin. The M1/M2-like polarization of microglia does not affect the expression of Fascin-1. Together, our results suggest that Fascin-1 is highly expressed specifically in microglia after SCI and can play an important role in the migration of microglia and the formation of microglial scars. Hence, the elucidation of this mechanism will provide novel therapeutic targets for the treatment of SCI.

Keywords: Fascin-1; microglia; migration; polarization; spinal cord injury.


Conflict of interest statement

The authors declare that the research was conducted in the absence of any commercial or financial relationships that could be construed as a potential conflict of interest.

Figures

FIGURE 1
FIGURE 1
Fascin-1 is prominently expressed and accumulates outside the lesion core after SCI. (A) Western blot analysis shows significant upregulation of Fascin-1 at 7 and 14 days after injury compared to the control (pre-operation, Pre). (B) Quantitative analysis of Fascin-1 expression in (A). The blots (n = 5 per group) were quantified by a densitometric method using ImageJ software. GAPDH was used as the loading control. The results are expressed as the mean ± SEM. ***p < 0.001 (14 days vs Pre); * p < 0.05 (7 days vs Pre); ##p < 0.01 (14 vs 3 days). (C) Double immunofluorescence labeling of spinal cord sagittal sections showing the spatiotemporal distribution of Fascin-1 (Red) and GFAP (Green) at Pre and 3, 7, and 14 days after injury. The asterisks indicate the lesion epicenter. Scale bar: 500 μm.
FIGURE 2
FIGURE 2
Fascin-1 is specifically expressed in CX3CR1+ activated microglia but not in GFAP+ astrocytes or PDGFRβ+ epicenter-located pericytes at 14 days after SCI. (A) Representative immunofluorescence images of Fascin-1 (Red) and CX3CR1 (Green). Colocalization of the proteins is shown in yellow. Nuclear staining (DAPI) is shown in blue, and white arrowheads indicate the colocalization observed with a ×40 objective lens. (B) Representative immunofluorescence images of Fascin-1 (Red), GFAP (Green) and DAPI (Blue) showing no apparent colocalization of staining. (C) Representative immunofluorescence images of Fascin-1 (Red), PDGFRβ (Green) and DAPI (Blue) showing no apparent colocalization of staining. The asterisks indicate the lesion epicenter. Scale bars: low magnification, 200 μm; higher magnification, 20 μm. (D) Representative immunofluorescence images of Fascin-1 (Red) and Tmem119 (Green). Arrowheads indicate the colocalization observed with a ×40 objective lens. (E) Percentage of Fascin-1+CX3CR1+ cells relative to the total number of Fasicn-1+ or CX3CR1+ cells in the injured spinal cord. (F) Percentage of Fascin-1+Tmem119+ cells relative to the total number of Fasicn-1+ or Tmem119+ cells in the injured spinal cord. The data are presented as the mean ± SEM (n = 5 independent experiments).
FIGURE 3
FIGURE 3
Fascin-1 is expressed partly in Iba1+ cells around the lesion but not in infiltrating Mac2+ macrophages, NeuN+ neurons or NG2+ cells in the injured spinal cord at 14 days. (A) Representative immunofluorescence images of Fascin-1 (Red) and Iba1 (Green). Arrowheads indicate the colocalization observed with a ×40 objective lens. The blue dotted lines delineate the boundary around the lesion core. (B–D) Representative immunofluorescence images of Fascin-1 (Red) staining with Mac2, NeuN, and NG2 (Green) staining, respectively, showing no apparent colocalization of staining. The asterisks indicate the lesion epicenter. Nuclear staining with DAPI is shown (Blue). Scale bars: low magnification, 200 μm; higher magnification, 20 μm. (E) Percentage of Fascin-1+Iba1+ cells relative to the total number of Fasicn-1+ or Iba1+ cells outside the blue dotted lines in the injured spinal cord. The data are presented as the mean ± SEM (n = 5 independent experiments).
FIGURE 4
FIGURE 4
The elimination of microglia by PLX5622 treatment results in correspondingly reduced Fascin-1 expression, disorganized astrocytic and fibrotic scars, and scattered macrophages in the injured spinal cord at 14 days. (A) Representative fluorescence images of Fascin-1 (Red) and CX3CR1 (Green) immunostaining showing a consistent reduction in Fascin-1 expression with the elimination of microglia after treatment with PLX5622 compared to vehicle (control). The asterisks indicate the lesion epicenter. Scale bar: 500 μm. (B) Representative immunofluorescence images of Fascin-1 (Red) and GFAP (Green), Fascin-1 (Red) and Mac2 (Green), Fascin-1 (Red) and PDGFRβ (Green) at the lesion sites of mice treated with vehicle (control) or PLX5622. After the elimination of microglia using PLX5622, the compact GFAP+ astrocytic scars and PDGFRβ+ fibrotic scars are disrupted, with clusters of Mac2+ macrophages spreading outside of the lesion core. The asterisks indicate the lesion epicenter. The dotted lines delineate the boundary around the lesion core. Scale bar: 500 μm. (C) Quantification of the number of Fascin-1+ CX3CR1+ microglia in the control and PLX5622 groups (n = 3 per group). The results are expressed as the mean ± SEM. ****p < 0.0001. (D) Percentage of surviving Fascin-1+ or CX3CR1+ cells in the PLX5622 groups relative to that the untreated control groups (n = 3 per group).
FIGURE 5
FIGURE 5
Inhibition of Fascin-1 expression using siRNA in BV-2 microglia can be partly rescued by treatment with myelin. (A) Western blot analysis shows that compared to the nonspecific control (NC), Fascin-1 siRNA (siFascin-1) could knockdown the expression of Fascin-1, while myelin treatment could upregulate the expression of Fascin-1. (B) Quantitative analysis of Fascin-1 expression in (A). GAPDH was used as the loading control. The blots (n = 4 per group) were quantified as previously described. The results are expressed as the mean ± SEM. * p < 0.05 (NC + Myelin or siFascin-1 vs NC); # p < 0.05 (NC + Myelin vs siFascin-1), ### p < 0.001 (siFascin-1+Myelin vs siFascin-1). (C) BV-2 cells were transfected with nonspecific control (NC) siRNA or siFascin-1 for 24 h and then treated with or without myelin for an additional 24 h in complete medium. Representative immunofluorescence images of Fascin-1 (Green) and Iba1 (Red) are shown. DAPI (Blue) was used to stain the nuclei. Scale bar: 100 μm.
FIGURE 6
FIGURE 6
Fascin-1 promotes the migration of microglia in vitro. (A) For the scratch assay, cell migration was recorded at 0, 24 and 48 h after scratching (n = 3 per group). BV-2 cells were transfected with nonspecific control (NC) or Fascin-1 (siFascin-1) siRNA for 24 h and treated with or without myelin for an additional 24 h in complete medium. Scale bar: 2 mm. (B) Quantification of the ratio of the blank area in the scratch migration assay. The results are presented as the mean ± SEM of experiments conducted in triplicate. * p < 0.05 (NC + Myelin or siFascin-1 vs NC); # p < 0.05 (NC + Myelin vs siFascin-1). (C) Transwell assays were used to detect the migration of microglia. BV-2 cells were treated as described in (A). After 48 h, the cells were resuspended in serum-free media and added to the upper chamber. Then, the cells were allowed to migrate for an additional 12 h and stained with crystal violet. Scale bar: 200 μm. (D) Quantitative analysis of the number of transmembrane cells in (C) (n = 4 per group). The results are presented as the mean ± SEM. **p < 0.01 (NC + Myelin vs NC), * p < 0.05 (siFascin-1 vs NC). # p < 0.05 (siFascin-1 vs siFascin-1+Myelin).
FIGURE 7
FIGURE 7
Microglial polarization has no effect on Fascin-1 expression. (A) Western blot analysis shows the protein expression of M1-like (iNOS) or M2-like (CD206) polarization markers and Fascin-1 in BV-2 cells after polarization treatment. (B) Quantitative analysis of Fascin-1 expression in (A). GAPDH was used as the loading control. The blots (n = 5 per group) were quantified, as previously described, and no significant difference was observed. (C,D) Representative immunofluorescence images of M1-like (iNOS, Green) or M2-like (CD206, Green) markers and Fascin-1 (Red) in BV-2 cells after polarization treatment. The results also indicated no obvious differential expression of Fascin-1. DAPI (Blue) was used to stain the nuclei. Scale bar: 50 μm.

References

    1. Al-Alwan M. M., Rowden G., Lee T. D., West K. A. (2001). Fascin Is Involved in the Antigen Presentation Activity of Mature Dendritic Cells. J. Immunol. 166 (1), 338–345. 10.4049/jimmunol.166.1.338 - DOI - PubMed
    1. Basso L., Lapointe T. K., Iftinca M., Marsters C., Hollenberg M. D., Kurrasch D. M., et al. (2017). Granulocyte-colony-stimulating Factor (G-CSF) Signaling in Spinal Microglia Drives Visceral Sensitization Following Colitis. Proc. Natl. Acad. Sci. U. S. A. 114 (42), 11235–11240. 10.1073/pnas.1706053114 - DOI - PMC - PubMed
    1. Bellver-Landete V., Bretheau F., Mailhot B., Vallières N., Lessard M., Janelle M. E., et al. (2019). Microglia Are an Essential Component of the Neuroprotective Scar that Forms after Spinal Cord Injury. Nat. Commun. 10 (1), 518–18. 10.1038/s41467-019-08446-0 - DOI - PMC - PubMed
    1. Bennett M. L., Bennett F. C., Liddelow S. A., Ajami B., Zamanian J. L., Fernhoff N. B., et al. (2016). New Tools for Studying Microglia in the Mouse and Human CNS. Proc. Natl. Acad. Sci. U. S. A. 113 (12), E1738–E1746. 10.1073/pnas.1525528113 - DOI - PMC - PubMed
    1. Bogie J. F., Stinissen P., Hellings N., Hendriks J. J. (2011). Myelin-phagocytosing Macrophages Modulate Autoreactive T Cell Proliferation. J. Neuroinflammation. 8 (1), 85–13. 10.1186/1742-2094-8-85 - DOI - PMC - PubMed