

Resting Tendon Cross-Sectional Area Underestimates Biceps Brachii Tendon Stress: Importance of Measuring During a Contraction
- PMID: 34646145
- PMCID: PMC8502959
- DOI: 10.3389/fphys.2021.654231
Resting Tendon Cross-Sectional Area Underestimates Biceps Brachii Tendon Stress: Importance of Measuring During a Contraction
Abstract
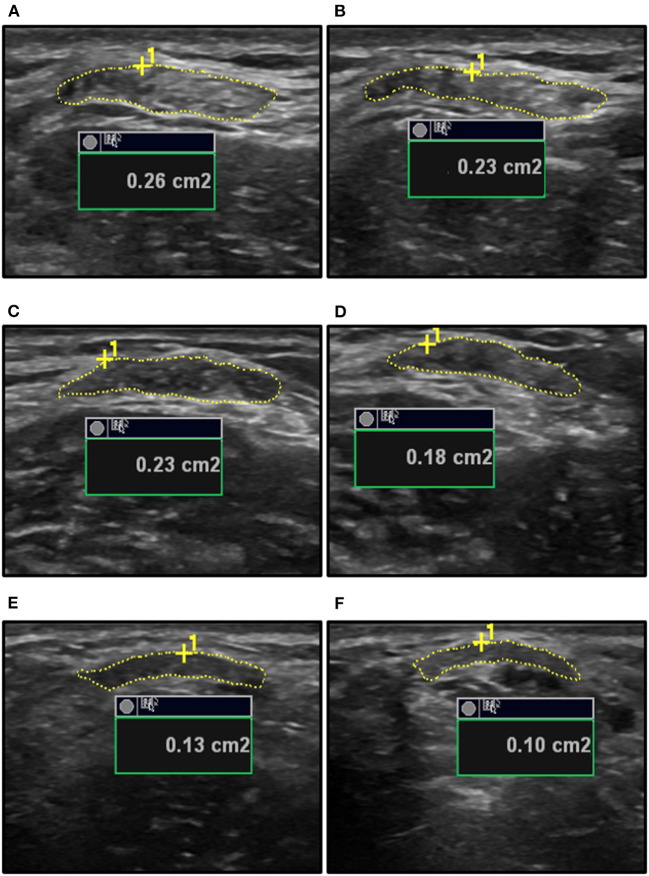
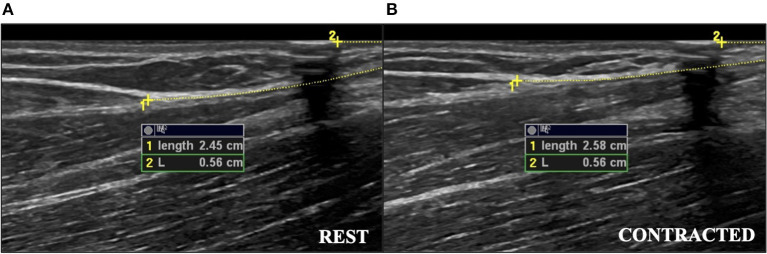
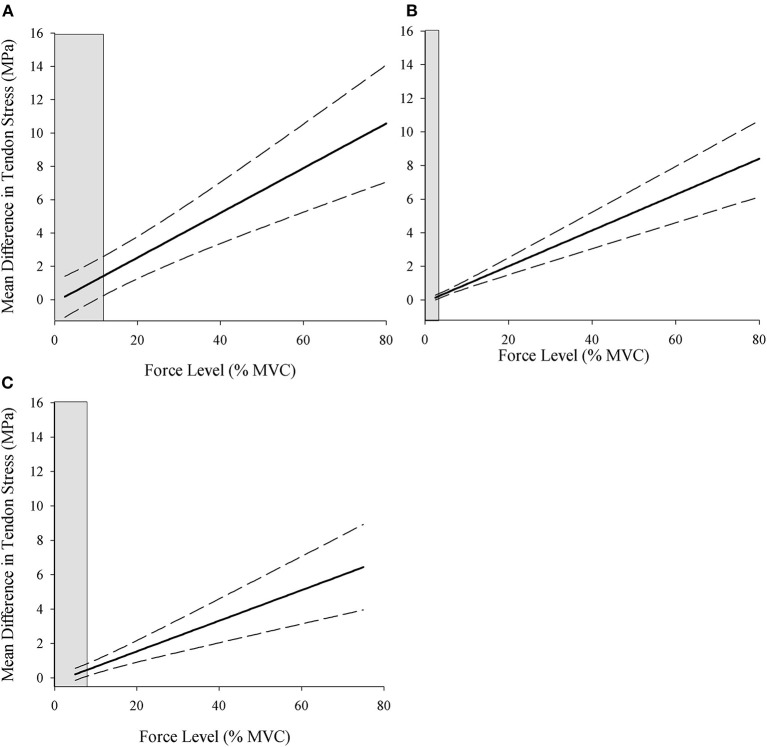
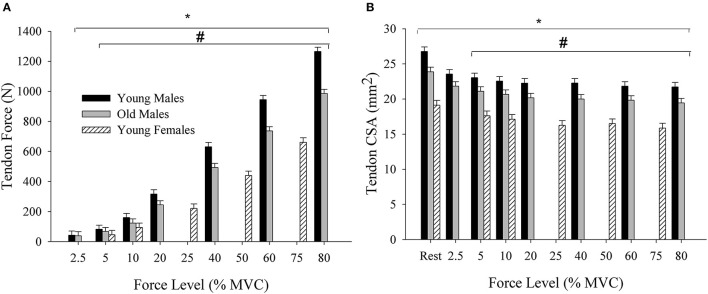
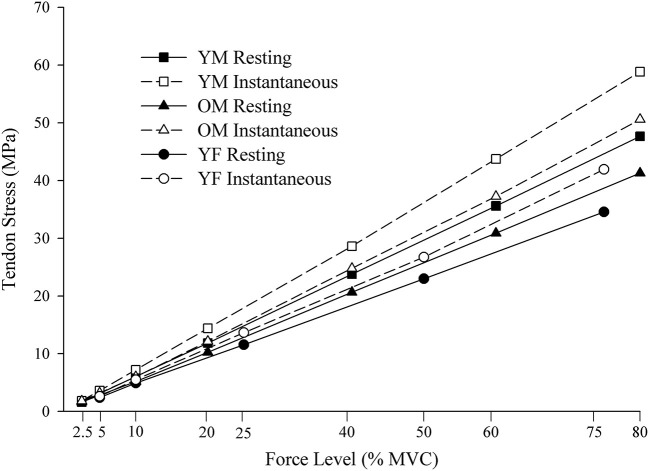
Force produced by the muscle during contraction is applied to the tendon and distributed through the cross-sectional area (CSA) of the tendon. This ratio of force to the tendon CSA is quantified as the tendon mechanical property of stress. Stress is traditionally calculated using the resting tendon CSA; however, this does not take into account the reductions in the CSA resulting from tendon elongation during the contraction. It is unknown if calculating the tendon stress using instantaneous CSA during a contraction significantly increases the values of in vivo distal biceps brachii (BB) tendon stress in humans compared to stress calculated with the resting CSA. Nine young (22 ± 1 years) and nine old (76 ± 4 years) males, and eight young females (21 ± 1 years) performed submaximal isometric elbow flexion tracking tasks at force levels ranging from 2.5 to 80% maximal voluntary contraction (MVC). The distal BB tendon CSA was recorded on ultrasound at rest and during the submaximal tracking tasks (instantaneous). Tendon stress was calculated as the ratio of tendon force during contraction to CSA using the resting and instantaneous measures of CSA, and statistically evaluated with multi-level modeling (MLM) and Johnson-Neyman regions of significance tests to determine the specific force levels above which the differences between calculation methods and groups became statistically significant. The tendon CSA was greatest at rest and decreased as the force level increased (p < 0.001), and was largest in young males (23.0 ± 2.90 mm2) followed by old males (20.87 ± 2.0 mm2) and young females (17.08 ± 1.54 mm2) (p < 0.001) at rest and across the submaximal force levels. Tendon stress was greater in the instantaneous compared with the resting CSA condition, and young males had the greatest difference in the values of tendon stress between the two conditions (20 ± 4%), followed by old males (19 ± 5%), and young females (17 ± 5%). The specific force at which the difference between the instantaneous and resting CSA stress values became statistically significant was 2.6, 6.6, and 10% MVC for old males, young females, and young males, respectively. The influence of using the instantaneous compared to resting CSA for tendon stress is sex-specific in young adults, and age-specific in the context of males. The instantaneous CSA should be used to provide a more accurate measure of in vivo tendon stress in humans.
Keywords: aging; elbow flexion; in vivo; sex differences; tendon mechanics; ultrasound.
Copyright © 2021 Smart, O'Connor and Jakobi.
Conflict of interest statement
The authors declare that the research was conducted in the absence of any commercial or financial relationships that could be construed as a potential conflict of interest.
Figures
Similar articles
-
Influence of biceps brachii tendon mechanical properties on elbow flexor force steadiness in young and old males.Scand J Med Sci Sports. 2018 Mar;28(3):983-991. doi: 10.1111/sms.13024. Epub 2018 Feb 6. Scand J Med Sci Sports. 2018. PMID: 29161769
-
Influence of forearm orientation on biceps brachii tendon mechanics and elbow flexor force steadiness.J Biomech. 2018 Jul 25;76:129-135. doi: 10.1016/j.jbiomech.2018.05.039. Epub 2018 Jun 18. J Biomech. 2018. PMID: 29954597
-
Is human Achilles tendon deformation greater in regions where cross-sectional area is smaller?J Exp Biol. 2017 May 1;220(Pt 9):1634-1642. doi: 10.1242/jeb.157289. Epub 2017 Feb 15. J Exp Biol. 2017. PMID: 28202585
-
Sex differences in mechanomyographic responses to voluntary isometric contractions.Med Sci Sports Exerc. 2006 Jul;38(7):1311-6. doi: 10.1249/01.mss.0000227317.31470.16. Med Sci Sports Exerc. 2006. PMID: 16826029
-
Cross-sectional area and muscular strength: a brief review.Sports Med. 2008;38(12):987-94. doi: 10.2165/00007256-200838120-00003. Sports Med. 2008. PMID: 19026016 Review.
Cited by
-
Gravity-efficient motor control is associated with contraction-dependent intracortical inhibition.iScience. 2023 Jun 15;26(7):107150. doi: 10.1016/j.isci.2023.107150. eCollection 2023 Jul 21. iScience. 2023. PMID: 37534144 Free PMC article.
References
-
- Eriksen C. S., Henkel C., Svensson R. B., Agergaard A.-S., Couppé C., Kjaer M., et al. . (2018). Lower tendon stiffness in very old compared with old individuals is unaffected by short-term resistance training of skeletal muscle. J. Appl. Physiol. 125, 205–214. 10.1152/japplphysiol.00028.2018 - DOI - PubMed
LinkOut - more resources
Full Text Sources