. 2021 Sep 27:12:709937.
doi: 10.3389/fgene.2021.709937. eCollection 2021.

SAP30 Gene Is a Probable Regulator of Muscle Hypertrophy in Chickens

Affiliations

SAP30 Gene Is a Probable Regulator of Muscle Hypertrophy in Chickens

Bruna Petry et al. Front Genet. .

Abstract

Animals with muscle hypertrophy phenotype are targeted by the broiler industry to increase the meat production and the quality of the final product. Studies characterizing the molecular machinery involved with these processes, such as quantitative trait loci studies, have been carried out identifying several candidate genes related to this trait; however, validation studies of these candidate genes in cell culture is scarce. The aim of this study was to evaluate SAP30 as a candidate gene for muscle development and to validate its function in cell culture in vitro. The SAP30 gene was downregulated in C2C12 muscle cell culture using siRNA technology to evaluate its impact on morphometric traits and gene expression by RNA-seq analysis. Modulation of SAP30 expression increased C2C12 myotube area, indicating a role in muscle hypertrophy. RNA-seq analysis identified several upregulated genes annotated in muscle development in treated cells (SAP30-knockdown), corroborating the role of SAP30 gene in muscle development regulation. Here, we provide experimental evidence of the involvement of SAP30 gene as a regulator of muscle cell hypertrophy.

Keywords: C2C12; hypertrophy; knockdown; muscle cell growth; siRNA; skeletal muscle.


Conflict of interest statement

The authors declare that the research was conducted in the absence of any commercial or financial relationships that could be construed as a potential conflict of interest.

Figures

FIGURE 1
FIGURE 1
Cell viability index and morphological effects of C2C12 cells transfected with SAP30 siRNA and control. (A) Graph representing the cell viability index determined by the MTT assay performed in C2C12 cells after 3 days of transfection with SAP30 siRNA or siRNA control. (B) Representative image of MF20 immunocytochemistry result in C2C12 culture after 3 days of transfection with siRNA control and SAP30-knockdown. Scale bar = 100 μm. (C) Fusion index of MF20-positive cells transfected with siRNA control and SAP30 siRNA after 3 days in DM. (D) Myotube area of C2C12 cells transfected with the siRNA control and SAP30-knockdown. Significant values *p < 0.05.
FIGURE 2
FIGURE 2
Principal Component Analysis (PCA) clearly showing a variation between genes expressed in the two groups (SAP30-knockdown and control) in C2C12 cells. The red dots are representing the triplicates from the control group, while the blue dots are triplicates from SAP30-knockdown group.
FIGURE 3
FIGURE 3
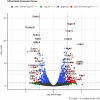
Volcano plot representing all genes with log2 fold change bigger than 1.0 and significant (p < 0.05) in the DE gene analysis in C2C12 cells after 3 days in differentiation medium. The red dots are the DE genes with log2 fold change higher than 1.0 in both sides (downregulated and upregulated) and with adjusted p-value < 0.05.
FIGURE 4
FIGURE 4
Gene Ontology terms showing the top 10 significant (p < 0.05) processes that the DE genes are related to. Image created by MetaCore software.
FIGURE 5
FIGURE 5
Developmental skeletal muscle network representing genes related with this process based on the DE genes analysis. The genes with red circles are genes that were upregulated after the DE analysis. Genes marked with blue circle were downregulated in our DE gene analysis. The red lines between the objects mean positive/activation effects; the green lines, negative/inhibition effects; and the gray lines, unspecified effects. Image created by MetaCore software.

References

    1. Agarwal M., Sharma A., Kumar P., Kumar A., Bharadwaj A., Saini M., et al. (2020). Myosin heavy chain-embryonic regulates skeletal muscle differentiation during mammalian development. Development 147:dev184507. 10.1242/dev.184507 - DOI - PMC - PubMed
    1. Animal QTL Database (2021). Animal QTL Database. Available online at: https://www.animalgenome.org/cgi-bin/QTLdb/index (accessed May 11, 2021)
    1. Bartel D. P. (2004). MicroRNAs: genomics, biogenesis, mechanism, and function. Cell 116 281–297. 10.1016/S0092-8674(04)00045-5 - DOI - PubMed
    1. Bertola L. D., Ott E. B., Griepsma S., Vonk F. J., Bagowski C. P. (2008). Developmental expression of the alpha-skeletal actin gene. BMC Evol. Biol. 8:166. 10.1186/1471-2148-8-166 - DOI - PMC - PubMed
    1. Brodehl A., Gaertner-Rommel A., Milting H. (2018). Molecular insights into cardiomyopathies associated with desmin (DES) mutations. Biophys. Rev. 10 983–1006. 10.1007/s12551-018-0429-0 - DOI - PMC - PubMed

LinkOut - more resources