. 2021 Sep 21;11(19):9605-9622.
doi: 10.7150/thno.63763. eCollection 2021.

Visualization of endogenous p27 and Ki67 reveals the importance of a c-Myc-driven metabolic switch in promoting survival of quiescent cancer cells

Affiliations

Visualization of endogenous p27 and Ki67 reveals the importance of a c-Myc-driven metabolic switch in promoting survival of quiescent cancer cells

Ting La et al. Theranostics. .

Erratum in

Abstract

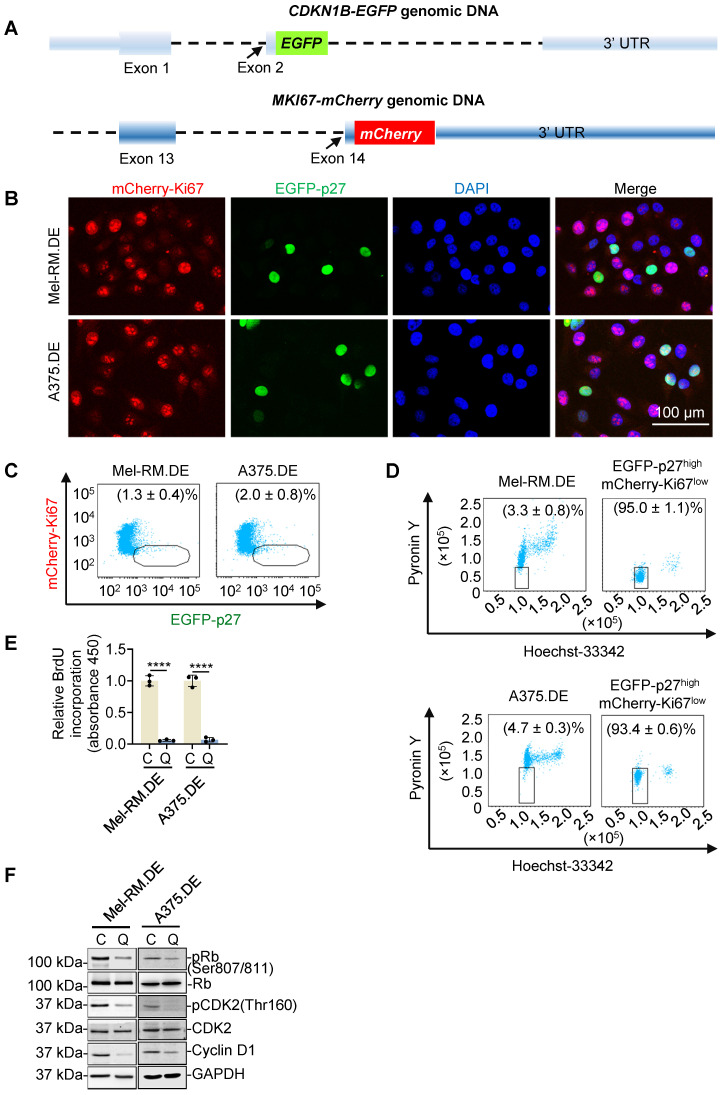
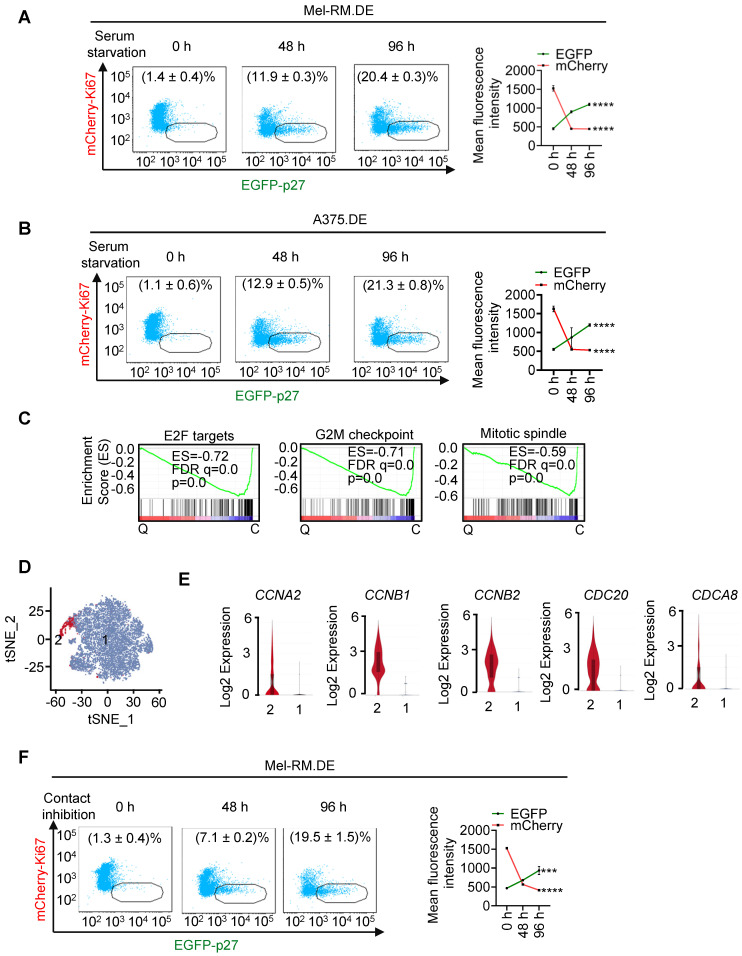
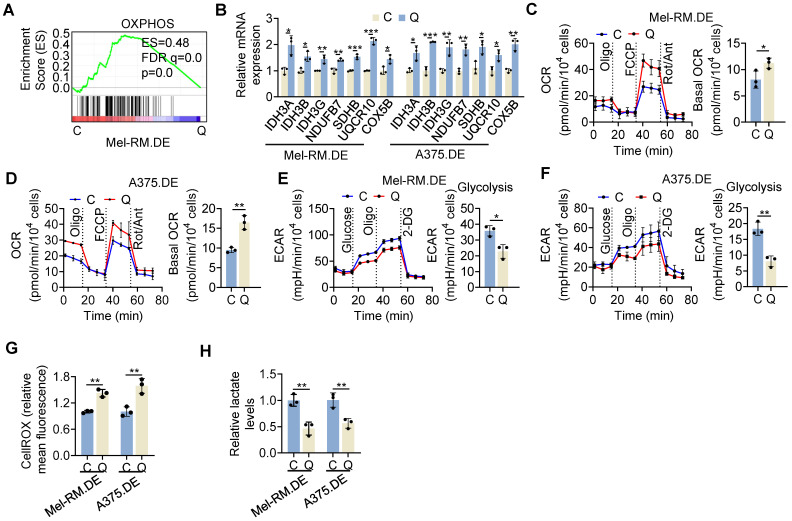
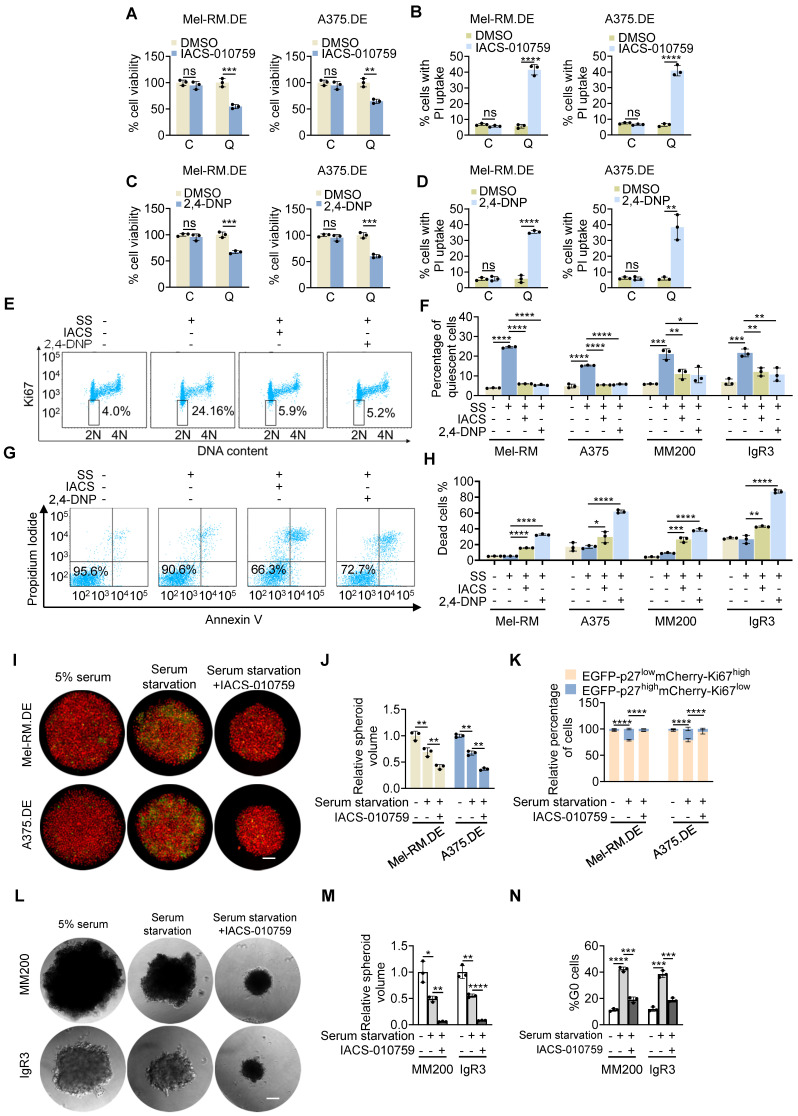
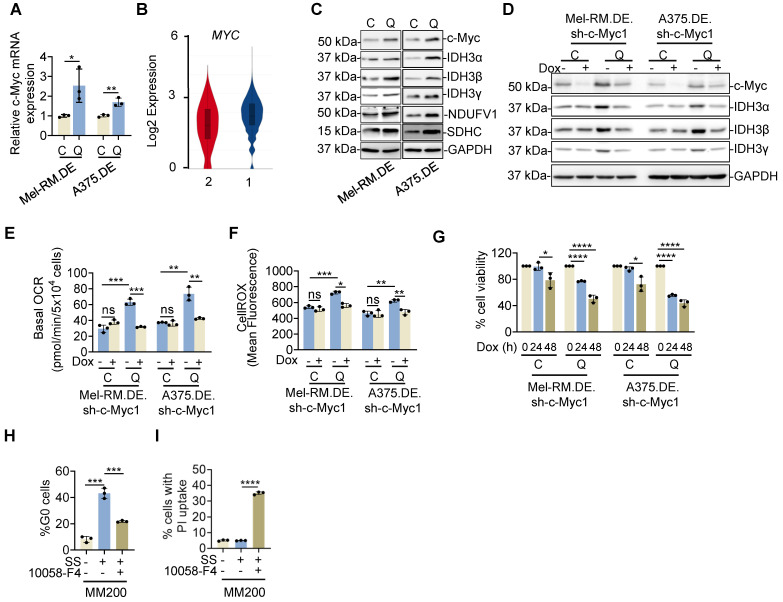
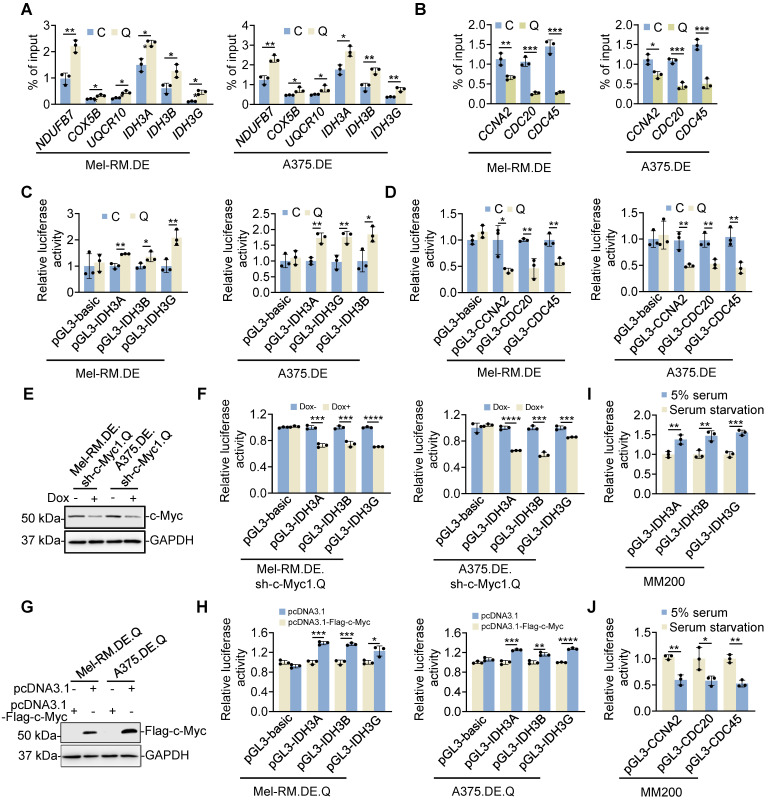
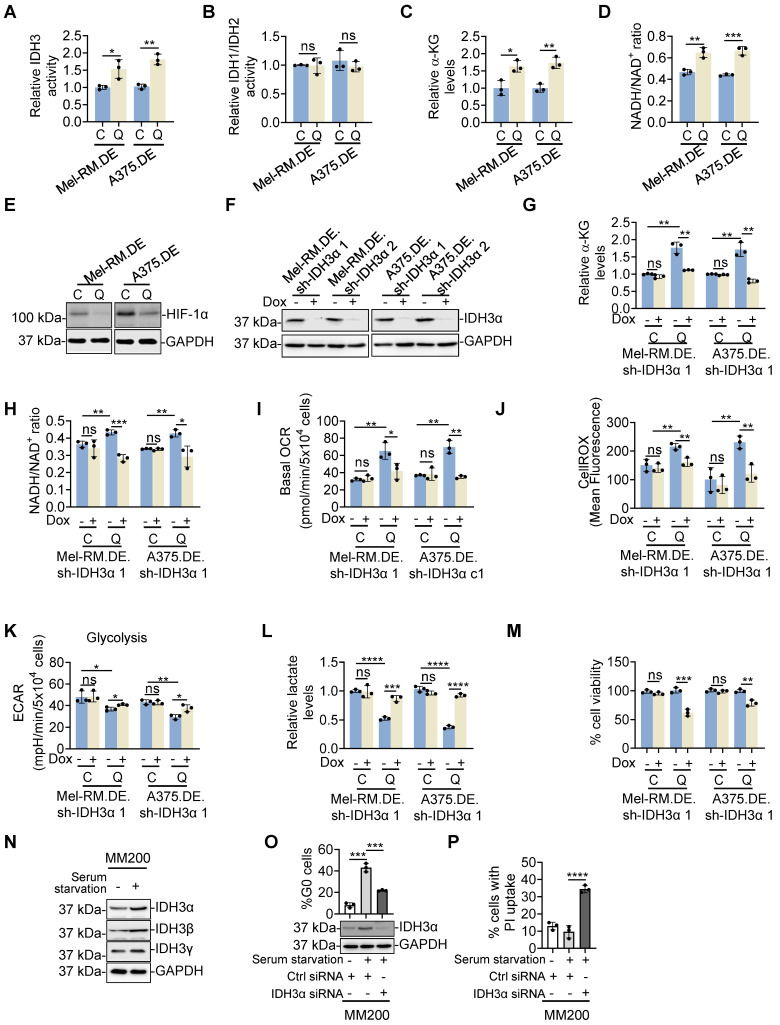
Rationale: Recurrent and metastatic cancers often undergo a period of dormancy, which is closely associated with cellular quiescence, a state whereby cells exit the cell cycle and are reversibly arrested in G0 phase. Curative cancer treatment thus requires therapies that either sustain the dormant state of quiescent cancer cells, or preferentially, eliminate them. However, the mechanisms responsible for the survival of quiescent cancer cells remain obscure. Methods: Dual genome-editing was carried out using a CRISPR/Cas9-based system to label endogenous p27 and Ki67 with the green and red fluorescent proteins EGFP and mCherry, respectively, in melanoma cells. Analysis of transcriptomes of isolated EGFP-p27highmCherry-Ki67low quiescent cells was conducted at bulk and single cell levels using RNA-sequencing. The extracellular acidification rate and oxygen consumption rate were measured to define metabolic phenotypes. SiRNA and inducible shRNA knockdown, chromatin immunoprecipitation and luciferase reporter assays were employed to elucidate mechanisms of the metabolic switch in quiescent cells. Results: Dual labelling of endogenous p27 and Ki67 with differentiable fluorescent probes allowed for visualization, isolation, and analysis of viable p27highKi67low quiescent cells. Paradoxically, the proto-oncoprotein c-Myc, which commonly drives malignant cell cycle progression, was expressed at relatively high levels in p27highKi67low quiescent cells and supported their survival through promoting mitochondrial oxidative phosphorylation (OXPHOS). In this context, c-Myc selectively transactivated genes encoding OXPHOS enzymes, including subunits of isocitric dehydrogenase 3 (IDH3), whereas its binding to cell cycle progression gene promoters was decreased in quiescent cells. Silencing of c-Myc or the catalytic subunit of IDH3, IDH3α, preferentially killed quiescent cells, recapitulating the effect of treatment with OXPHOS inhibitors. Conclusion: These results establish a rigorous experimental system for investigating cellular quiescence, uncover the high selectivity of c-Myc in activating OXPHOS genes in quiescent cells, and propose OXPHOS targeting as a potential therapeutic avenue to counter cancer cells in quiescence.

Keywords: IDH3; c-Myc; oxidative phosphorylation; quiescence; quiescent cells.


Conflict of interest statement

Competing Interests: The authors have declared that no competing interest exists.

Figures

Figure 1
Figure 1
Dual genome-editing of endogenous p27 and Ki67 to identify EGFP-p27highmCherry-Ki67low quiescent cancer cells. (A) Schematic illustration of fusing EGFP and mCherry sequences at the C-termini of the CDKN1B and MKI67 genes, respectively, using the CRISPR-Cas9 system. (B) Representative microscopic photographs of dually edited Mel-RM (Mel-RM.DE) and A375 (A375.DE) cells with nuclei labelled with DAPI. Scale bar, 100 μm; n = 3. (C) Representative flowcytometry dot plots showing that a small proportion of Mel-RM.DE and A375.DE cells were EGFP-p27highmCherry-Ki67low, Values are mean ± SDs; n = 3. (D) Representative flowcytometry dot plots of EGFP-p27highmCherry-Ki67low cells isolated using FACS from Mel-RM.DE and A375.DE cells with DNA and RNA labelled using hoechst-33342 and pyronin Y, respectively. Values are mean ± SDs; n = 3. (E) DNA synthesis activity was not detected in EGFP-p27highmCherry-Ki67low [quiescent cells (Q)] cells, but was readily detectable in the other [cycling (C)] cells isolated from Mel-RM.DE and A375.DE cells as shown in BrdU incorporation assays. The relative BrdU incorporation in cycling cells were arbitrarily designated as 1. Values are mean ± SDs; n = 3 (****P < 0.0001, two-tailed Student's t-test). (F) Whole cell lysates from EGFP-p27highmCherry-Ki67low quiescent (Q) and the cycling cells isolated from Mel-RM.DE and A375.DE cells were analyzed using Western blotting. n = 3.
Figure 2
Figure 2
Isolation and characterization of EGFP-p27highmCherry-Ki67low cells enriched by serum starvation or contact inhibition. (A, B) Dually edited Mel-RM (Mel-RM.DE; A) and A375 (A375.DE; B) cells undergoing serum starvation for indicated periods were subjected to flowcytometry. The EGFP-p27highmCherry-Ki67low quiescent cell population was gated and the percentage of these cells calculated (left panel). Mean fluorescence intensities of EGFP and mCherry were also quantitated and shown. Values are mean ± SDs; n = 3 (****P < 0.0001, One-way ANOVA). (C) GSEA plots of bcRNA-seq data from Mel-RM.DE cells undergoing serum starvation showing that the E2F, G2M progression and mitotic spindle assembly pathways were negatively enriched in EGFP-p27highmCherry-Ki67low quiescent (Q) compared with cycling (C) cells. FDR, false-discovery rate; ES, enrichment score. n = 2 biological repeats. (D) t-Distributed stochastic neighbor embedding (t-SNE) visualization of transcriptomes of 7554 single EGFP-p27highmCherry-Ki67low quiescent cells isolated from Mel-RM.DE cells undergoing serum starvation. The cells were arbitrarily clustered into cluster 1 and 2 that did not and did express cell cycle progression genes including CCNA2, CCNB1, CCNB2, CDC20 and CDCA8, respectively. (E) Violin plots showing the smoothened expression distribution of CCNA2, CCNB1, CCNB2, CDC20 and CDCA8, stratified per the two clusters showed in (D). (F) Dually edited Mel-RM cells undergoing contact inhibition for indicated periods were subjected to flowcytometry. The EGFP-p27highmCherry-Ki67low quiescent cell population was gated and the percentage of these cells calculated. Values are mean ± SDs; n = 3. Mean fluorescence intensities of EGFP and mCherry were also quantitated and shown. Values are mean ± SDs; n = 3 (***P < 0.001; ****P < 0.0001, One-way ANOVA).
Figure 3
Figure 3
High OXPHOS activity in quiescent melanoma cells. (A) A GSEA plot of RNA-seq data showing that the OXPHOS pathway was enriched in EGFP-p27highmCherry-Ki67low (Q) compared with cycling (C) cells isolated from dually edited Mel-RM cells (Mel-RM.DE) undergoing serum starvation. ES, enrichment score; FDR, false-discovery rate. n = 2 biological repeats. (B) Total RNA from EGFP-p27highmCherry-Ki67low quiescent (Q) and cycling (C) cells isolated from Mel-RM.DE and A375.DE cells undergoing serum starvation were subjected to qPCR analysis. Values are mean ± SDs; n = 3 (*P < 0.05; **P < 0.01; ***P < 0.001, two-tailed Student's t-test). (C, D) EGFP-p27highmCherry-Ki67low quiescent (Q) and cycling (C) cells isolated from Mel-RM.DE (C) and A375.DE (D) cells undergoing serum starvation were subjected to Seahorse XF analysis of the OCR. Values are mean ± SDs; n = 3 (*P < 0.05; **P < 0.01, two-tailed Student's t-test ). (E, F) EGFP-p27highmCherry-Ki67low quiescent (Q) and cycling (C) cells isolated from Mel-RM.DE (E) and A375.DE (F) cells undergoing serum starvation were subjected to Seahorse XF analysis of the extracellular acidification rate (ECAR). Values are mean ± SDs; n = 3 (*P < 0.05; **P < 0.01, two-tailed Student's t-test). (G) EGFP-p27highmCherry-Ki67low quiescent (Q) and cycling (C) cells isolated from Mel-RM.DE and A375.DE cells undergoing serum starvation were subjected to CellROX analysis. Values are mean ± SDs; n = 3 (**P < 0.01, two-tailed Student's t-test). (H) EGFP-p27highmCherry-Ki67low quiescent (Q) and E cycling (C) cells isolated from Mel-RM.DE and A375.DE cells undergoing serum starvation were subjected to colorimetric analysis of intracellular lactate levels. Values are mean ± SDs; n = 3 (**P < 0.01, two-tailed Student's t-test).
Figure 4
Figure 4
Quiescent melanoma cells are more reliant on OXPHOS. (A-D) EGFP-p27highmCherry-Ki67low quiescent (Q) and cycling (C) cells isolated from dually edited Mel-RM (Mel-RM.DE) and A375 (A375.DE) cells undergoing serum starvation were treated with IACS-010759 (IACS; 250 nM) (A and B) or 2,4-DNP (250 μM) (C and D) for 24 h before cell viability was measured using the CCK8 assay (A and C), and cell death, the PI uptake assay (B and D). Values are mean ± SDs; n = 3 (**P < 0.01; ***P < 0.001; ****P < 0.0001, two-tailed Student's t-test ). (E) ME4405 cells with or without serum starvation for 72 h treated with IACS-010759 (250 nM) or 2,4-DNP (250 μM) for a further 16 h were subjected to staining with an anti-Ki67 antibody and propidium iodide (PI). Data shown are representative flowcytometry dot plots of three independent experiments. The numbers represent percentages of quiescent cells (diploid cells with no or low levels of Ki67). SS: Serum Starvation. (F) Mel-RM, A375, MM200, IgR3 cells with or without serum starvation for 72 h treated with IACS-010759 (250 nM) or 2,4-DNP (250 μM) for a further 16 h were subjected to staining with an anti-Ki67 antibody and propidium iodide (PI). Quiescent cells were quantitated using flowcytometry as exemplified in (E). Values are mean ± SDs; n = 3 (*P < 0.05; **P < 0.01; ***P < 0.001; ****P < 0.0001; two-tailed Student's t-test). SS: Serum Starvation. (G) ME4405 cells with or without serum starvation for 72 h treated with IACS-010759 (250 nM) or 2,4-DNP (250 μM) for a further 48 h were subjected to quantitation of cell death with PI/Annexin V staining using flowcytometry. The numbers represent the relative proportions of viable cells. SS: Serum Starvation. (H) Mel-RM, A375, MM200, IgR3 cells with or without serum starvation for 72 h treated with IACS-010759 (250 nM) or 2,4-DNP (250 μM) for a further 48 h were subjected to PI/Annexin V staining. Cell death was quantitated using flowcytometry as exemplified in (G). Values are mean ± SDs; n = 3 (*P < 0.05; **P < 0.01; ***P < 0.001; ****P < 0.0001; two-tailed Student's t-test). SS: Serum Starvation. (I) Representative microscopic photographs showing that treatment with IACS reduced the size of tumour spheres and the proportion of EGFP-p27highmCherry-Ki67low quiescent cells of Mel-RM.DE and A375.DE cells undergoing serum starvation. Scale bar, 100 µm; n = 3. (J) Quantitative comparison of the size of tumour spheres of Mel-RM.DE and A375.DE cells undergoing serum starvation with or without treatment with IACS. Values are mean ± SDs; n = 3 (**P < 0.01, two-tailed Student's t-test). (K) Quantitative comparison of the relative number of EGFP-p27highmCherry-Ki67low quiescent and cycling cells in tumour spheres of Mel-RM.DE and A375.DE cells undergoing serum starvation with or without treatment with IACS. Values are mean ± SDs; n = 3 (****P < 0.001, two-way ANOVA). (L) Representative microscopic photographs showing that treatment with IACS reduced the size of tumour spheres of MM200 and IgR3 cells undergoing serum starvation. Scale bar, 100 µm. n = 3. (M) Quantitative comparison of the size of tumour spheres of MM200 and IgR3 cells undergoing serum starvation with or without treatment with IACS. Values are mean ± SDs; n = 3 (*P < 0.05; **P < 0.01; ****P < 0.0001, two-tailed Student's t-test). (N) Quantitative comparison of the quiescent cells defined using Hoechst-33342 and Pyronin Y staining MM200 and IgR3 cells derived from tumour spheres undergoing serum starvation with or without treatment with IACS. Values are mean ± SDs; n = 3 (***P < 0.001; ****P < 0.0001, two-tailed Student's t-test).
Figure 5
Figure 5
c-Myc drives OXPHOS in quiescent melanoma cells. (A) Total RNA from EGFP-p27highmCherry-Ki67low quiescent (Q) and cycling (C) cells isolated from dually edited Mel-RM (Mel-RM.DE) and A375 (A375.DE) cells undergoing serum starvation were subjected to qPCR analysis of c-MYC mRNA expression. Values are mean ± SDs; n = 3 (*P < 0.05; **P < 0.01, two-tailed Student's t-test ). (B) Violin plots showing the smoothened expression distribution of MYC stratified per the two clusters showed in Figure 2D. (C) Whole cell lysates from EGFP-p27highmCherry-Ki67low quiescent (Q) and cycling (C) cells isolated from Mel-RM.DE and A375.DE cells undergoing serum starvation were analyzed using Western blotting. n = 3. (D) Whole cell lysates from EGFP-p27highmCherry-Ki67low quiescent (Q) and cycling (C) cells isolated from Mel-RM.DE and A375.DE cells carrying an inducible c-Myc shRNA system with or without treatment with Doxycycline (Dox) for 24 h undergoing serum starvation were subjected to Western blotting. n = 3. (E) EGFP-p27highmCherry-Ki67low quiescent (Q) and cycling (C) cells isolated from Mel-RM.DE and A375.DE cells carrying an inducible c-Myc shRNA system with or without treatment with Dox undergoing serum starvation were subjected to Seahorse XF analysis of the oxygen consumption rate (OCR). Values are mean ± SDs; n = 3 (**P < 0.01; ***P < 0.001, two-tailed Student's t-test). (F) EGFP-p27highmCherry-Ki67low quiescent (Q) and cycling (C) cells isolated from Mel-RM.DE and A375.DE cells carrying an inducible c-Myc shRNA system with or without treatment with Dox undergoing serum starvation were subjected to CellROX analysis. Values are mean ± SDs; n = 3 (*P < 0.05; **P < 0.01; ***P < 0.001, two-tailed Student's t-test). (G) EGFP-p27highmCherry-Ki67low quiescent (Q) and cycling (C) cells isolated from Mel-RM.DE and A375.DE cells carrying an inducible c-Myc shRNA system undergoing serum starvation were treated with Dox for the indicated periods were subjected to measurement of cell viability using CCK8 assays. The relative viability of quiescent and cycling cells of each cell line without treatment with Dox was arbitrarily designated as 100%, respectively. Values are mean ± SDs; n = 3 (*P < 0.05; ****P < 0.001, two-tailed Student's t-test). (H) MM200 cells with or without serum starvation for 72 h were treated with 10058-F4 (50 μM) for an additional 16 h. Quiescent cell proportions were quantitated with Hoechst-33342 and Pyronin Y staining using flowcytometry. Values are mean ± SDs; n = 3 (***P < 0.001, two-tailed Student's t-test). (I) MM200 cells with or without serum starvation for 72 h were treated with 10058-F4 (50 μM) for an additional 48 h. Cell death was quantitated using PI uptake assays. Values are mean ± SDs; n = 3 (****P < 0.0001, two-tailed Student's t-test).
Figure 6
Figure 6
c-Myc preferentially drives the expression of OXPHOS genes in quiescent cells. (A, B) EGFP-p27highmCherry-Ki67low quiescent (Q) and cycling (C) cells isolated from dually edited Mel-RM (Mel-RM.DE) and A375 (A375.DE) cells undergoing serum starvation were subjected to qPCR-ChIP assays. Values are mean ± SDs; n = 3 (*P < 0.05; **P < 0.01, two-tailed Student's t-test). (C, D) EGFP-p27highmCherry-Ki67low quiescent (Q) and cycling (C) cells isolated from Mel-RM.DE and A375.DE cells transfected with the indicated luciferase plasmids undergoing serum starvation were subjected to luciferase reporter assays. Values are mean ± SDs; n = 3 (*P < 0.05; **P < 0.01, two-tailed Student's t-test). (E) Whole cell lysates from EGFP-p27highmCherry-Ki67low quiescent (Q) cells isolated from Mel-RM.DE and A375.DE cells carrying an inducible c-Myc shRNA system with or without treatment with Dox undergoing serum starvation were subjected to Western blotting. n = 3. (F) EGFP-p27highmCherry-Ki67low quiescent (Q) cells isolated from Mel-RM.DE and A375.DE cells carrying an inducible c-Myc shRNA system transfected with the indicated luciferase plasmids with or without treatment with Dox were subjected to serum starvation followed by luciferase reporter assays. Values are mean ± SDs; n = 3 (***P < 0.001; ****P < 0.00001, two-tailed Student's t-test). (G) Whole cell lysates from EGFP-p27highmCherry-Ki67low quiescent (Q) cells isolated from Mel-RM.DE and A375.DE cells transfected with the indicated plasmids undergoing serum starvation were analyzed using Western blotting. n = 3. (H) EGFP-p27highmCherry-Ki67low quiescent (Q) cells isolated from Mel-RM.DE and A375.DE cells transfected with the indicated plasmids undergoing serum starvation were subjected to luciferase reporter assays. Values are mean ± SDs; n = 3 (*P < 0.05; **P < 0.01, ***P < 0.001; ****P < 0.00001, two-tailed Student's t-test). (I, J) MM200 cells transfected with the indicated luciferase plasmids undergoing serum starvation were subjected to luciferase reporter assays. Values are mean ± SDs; n = 3 (*P < 0.05; **P < 0.01; ***P < 0.001, two-tailed Student's t-test).
Figure 7
Figure 7
IDH3 mediates metabolic switching towards OXPHOS in quiescent melanoma cells. (A-D) EGFP-p27highmCherry-Ki67low quiescent (Q) and cycling (C) cells isolated from dually edited Mel-RM (Mel-RM.DE) and A375 (A375.DE) cells undergoing serum starvation were subjected to colorimetric analysis of IDH3 activity (A), IDH1/IDH2 activity (B), α-KG levels (C) and NADH/NAD+ ratio (D). Values are mean ± SDs; n = 3 (*P < 0.05; **P < 0.01; ***P < 0.01, two-tailed Student's t-test). (E) Whole cell lysates from EGFP-p27highmCherry-Ki67low quiescent (Q) and cycling (C) cells isolated from Mel-RM.DE and A375.DE cells undergoing serum starvation were subjected to Western blotting. n = 3. (F) Whole cell lysates from Mel-RM.DE and A375.DE cells carrying an inducible IDH3α shRNA system with or without treatment with Dox were subjected to Western blotting. n = 3. (G, H) EGFP-p27highmCherry-Ki67low quiescent (Q) and cycling (C) cells isolated from Mel-RM.DE and A375.DE cells carrying an inducible IDH3α shRNA system with or without treatment with Dox undergoing serum starvation were subjected to colorimetric analysis of α-KG levels (G) and the NADH/NAD+ ratio (H). Values are mean ± SDs; n = 3 (*P < 0.05; **P < 0.01; ***P < 0.01, two-tailed Student's t-test). (I) EGFP-p27highmCherry-Ki67low quiescent (Q) and cycling (C) cells isolated from Mel-RM.DE and A375.DE cells carrying an inducible IDH3α shRNA system with or without treatment with Dox undergoing serum starvation were subjected to Seahorse XF analysis of the oxygen consumption rate (OCR). Values are mean ± SDs; n = 3 (*P < 0.05; **P < 0.01, two-tailed Student's t-test). (J) EGFP-p27highmCherry-Ki67low quiescent (Q) and cycling (C) cells isolated from Mel-RM.DE and A375.DE cells carrying an inducible IDH3α shRNA system with or without treatment with Dox undergoing serum starvation were subjected to CellROX analysis. Values are mean ± SDs; n = 3 (**P < 0.01, two-tailed Student's t-test). (K) EGFP-p27highmCherry-Ki67low quiescent (Q) and cycling (C) cells isolated from Mel-RM.DE and A375.DE cells carrying an inducible IDH3α shRNA system with or without treatment with Dox undergoing serum starvation were subjected to Seahorse XF analysis of the extracellular acidification rate (ECAR). Values are mean ± SDs; n = 3 (*P < 0.05; **P < 0.01, two-tailed Student's t-test). (L) EGFP-p27highmCherry-Ki67low quiescent (Q) and cycling (C) cells isolated from Mel-RM.DE and A375.DE cells carrying an inducible IDH3α shRNA system with or without treatment with Dox undergoing serum starvation were subjected to colorimetric analysis of intracellular lactate levels. Values are mean ± SDs; n = 3 (***P < 0.001; ****P < 0.0001, two-tailed Student's t-test). (M) EGFP-p27highmCherry-Ki67low quiescent (Q) and cycling (C) cells isolated from Mel-RM.DE and A375.DE cells carrying an inducible IDH3α shRNA system were treated with Dox undergoing serum starvation before cell viability was measured using CCK8 assays. Values are mean ± SDs; n = 3 (**P < 0.01; ***P < 0.01, two-tailed Student's t-test). (N) Whole cell lysates from MM200 cells with or without serum starvation for 96 h were subjected to Western blotting. n = 3. (O, P) MM200 cells transfected with indicated siRNAs were cultured with or without serum starvation. Ninety-six h later, cells were subjected to Western blotting (O, bottom), Hoechst-33342 and Pyronin Y double staining (O, upper), and PI uptake assays (Q). Values are mean ± SDs; n = 3 (***P < 0.001, ****P < 0.0001, two-tailed Student's t-test).

References

    1. Yao G. Modelling mammalian cellular quiescence. Interface Focus. 2014;4:20130074. - PMC - PubMed
    1. Fujimaki K, Li R, Chen H, Della Croce K, Zhang HH, Xing J. et al. Graded regulation of cellular quiescence depth between proliferation and senescence by a lysosomal dimmer switch. Proc Natl Acad Sci U S A. 2019;116:22624–34. - PMC - PubMed
    1. Rumman M, Dhawan J, Kassem M. Concise Review: Quiescence in Adult Stem Cells: Biological Significance and Relevance to Tissue Regeneration. Stem Cells. 2015;33:2903–12. - PubMed
    1. Rossi L, Lin KK, Boles NC, Yang L, King KY, Jeong M. et al. Less is more: unveiling the functional core of hematopoietic stem cells through knockout mice. Cell Stem Cell. 2012;11:302–17. - PMC - PubMed
    1. Yeh AC, Ramaswamy S. Mechanisms of Cancer Cell Dormancy-Another Hallmark of Cancer? Cancer Res. 2015;75:5014–22. - PMC - PubMed

Publication types

MeSH terms