

Standardization of Aspergillus IgG diagnostic cutoff in Nigerians
- PMID: 34646555
- PMCID: PMC8504277
- DOI: 10.1177/20499361211050158
Standardization of Aspergillus IgG diagnostic cutoff in Nigerians
Abstract
Background and objectives: Commercial Aspergillus IgG antibody assays have become pivotal in the current diagnosis of chronic pulmonary aspergillosis (CPA). However, diagnostic cutoffs have been found to vary from manufactures' recommendations in different settings. This study aimed to establish the Aspergillus IgG reference range among Nigerians and determine a diagnostic cutoff for CPA.
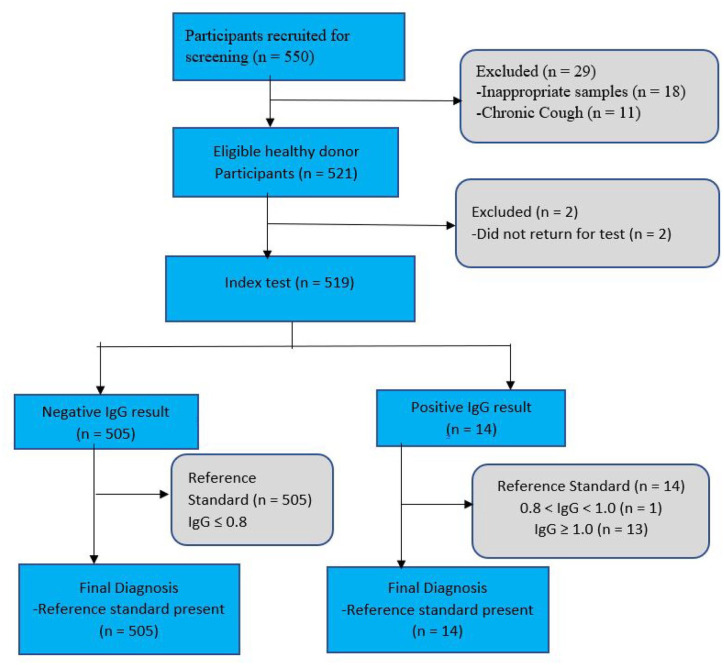
Methods: Sera from 519 prospectively recruited healthy blood donors and 39 previously confirmed cases of CPA were analysed for Aspergillus IgG levels using the Bordier test kit (Bordier Affinity Products SA, Crissier, Switzerland). Accuracy versus cutoff profile and receiver operating characteristics (ROC) curve were analysed for both CPA cases and controls using the R-Studio (2020), (Window desktop, version 4.0.2 software with R packages "nnet" and "ROCR").
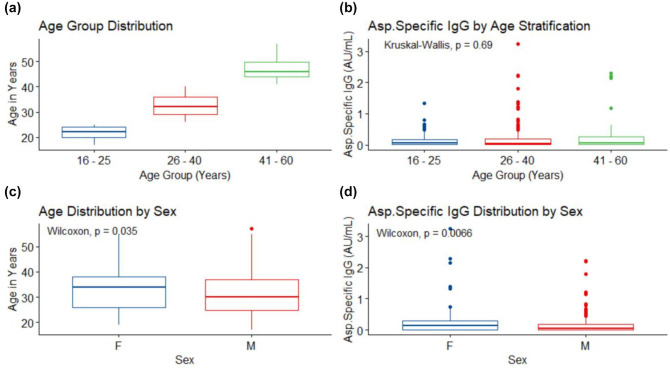
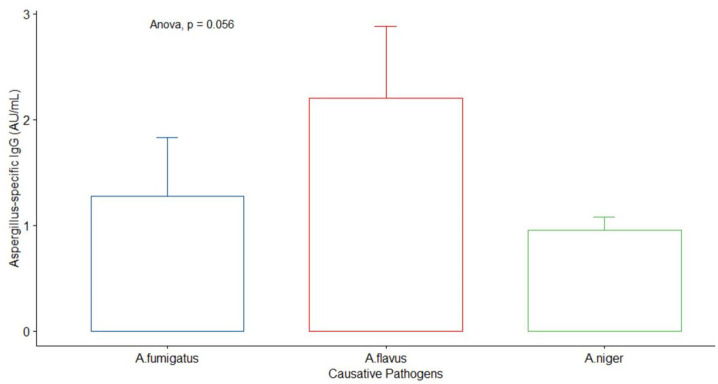
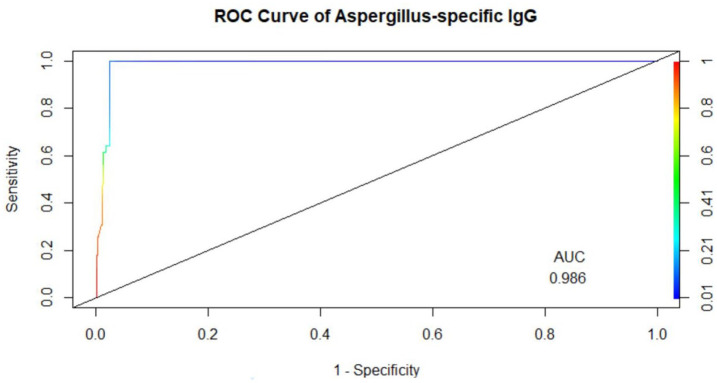
Results: Among healthy blood donors, 141 (27.2%) were aged 16-25 years with median (interquartile range, IQR) of 22 (20-24) years; 304 (58.6%) were aged 26-40 years with median (IQR) of 32 (29-36) years; while 74 (14.2%) were aged 41-60 years with median (IQR) of 46 (44-49.75). Median IgG level in respective age groups were 0.069 (0.009-0.181), 0.044 (0.014-0.202) and 0.056 (0.01-0.265) with no significant difference found in the three age categories (p = 0.69). The overall diagnostic cutoff for the diagnosis of CPA was 0.821 with an accuracy of 97.1% and area under the curve (AUC) = 0.986.
Conclusion: The optimal diagnostic cutoff for diagnosing CPA in Nigerians using the Bordier kit was 0.821 which is lower than the manufacturer's recommended cutoff of 1.0. The determination of this cutoff among Nigerians will significantly enhance accurate identification of CPA and assessment of its true burden in Nigeria.
Keywords: Aspergillus IgG; Nigeria; blood donors; chronic pulmonary aspergillosis; cutoff.
© The Author(s), 2021.
Conflict of interest statement
Conflict of interest statement: The authors declared the following potential conflicts of interest with respect to the research, authorship, and/or publication of this article: DWD and family hold Founder shares in F2G Ltd, a University of Manchester spin-out antifungal discovery company. He acts or has recently acted as a consultant to Scynexis, Pulmatrix, Pulmocide, Zambon, iCo Therapeutics, Mayne Pharma, Biosergen, and Fujifilm. In the last 3 years, he has been paid for talks on behalf of Hikma, Gilead, Merck, Mylan and Pfizer. He is a long-standing member of the Infectious Disease Society of America Aspergillosis Guidelines group, the European Society for Clinical Microbiology, and Infectious Diseases Aspergillosis Guidelines group. The other co-authors declare no conflict of interests.
Figures
References
-
- Soubani AO, Chandrasekar PH. The clinical spectrum of pulmonary aspergillosis. Chest 2002; 121: 1988–1999. - PubMed
-
- Hogan C, Denning DW. Allergic bronchopulmonary aspergillosis and related allergic syndromes. Semin Respir Crit Care Med 2011; 32: 682–692. - PubMed
-
- Page ID, Richardson M, Denning DW. Antibody testing in aspergillosis – quo vadis? Med Mycol 2015; 53: 417–439. - PubMed
-
- Leading International Fungal Education. LIFE chronic pulmonary aspergillosis factsheet, http://www.lifeworldwide.org/chronic-pulmonary-aspergillosis1 (accessed 19 February 2017).
-
- Ohba H, Miwa S, Shirai M, et al. Clinical characteristics and prognosis of chronic pulmonary aspergillosis. Respir Med 2012; 106: 724–729. - PubMed
LinkOut - more resources
Full Text Sources
