. 2021 Sep 27:8:719982.
doi: 10.3389/fmolb.2021.719982. eCollection 2021.

Identification of Mast Cell-Based Molecular Subtypes and a Predictive Signature in Clear Cell Renal Cell Carcinoma

Affiliations

Identification of Mast Cell-Based Molecular Subtypes and a Predictive Signature in Clear Cell Renal Cell Carcinoma

Hanxiang Liu et al. Front Mol Biosci. .

Abstract

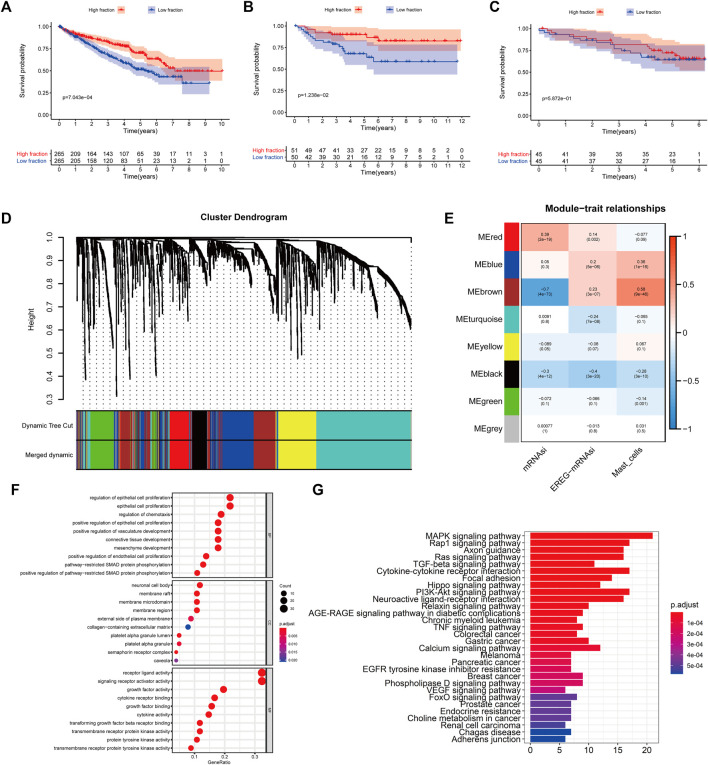
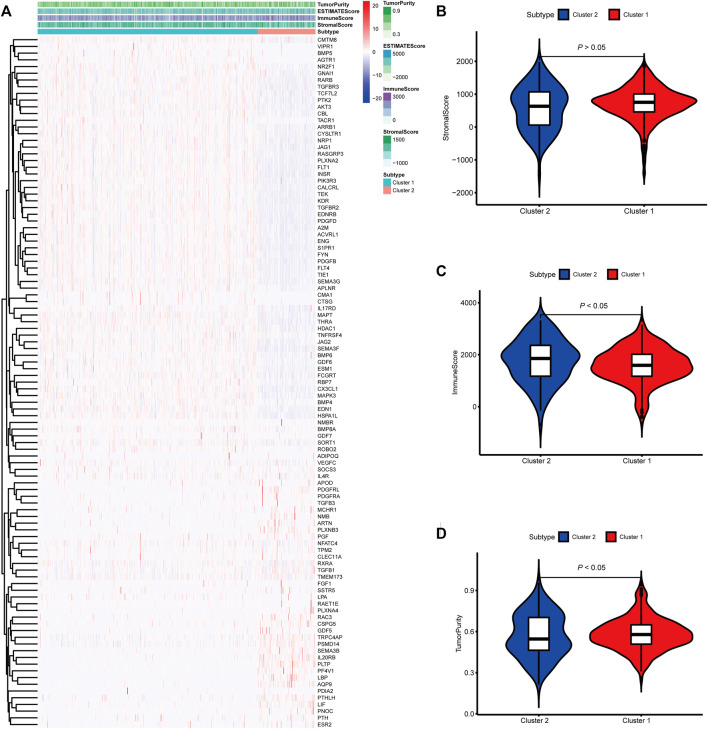
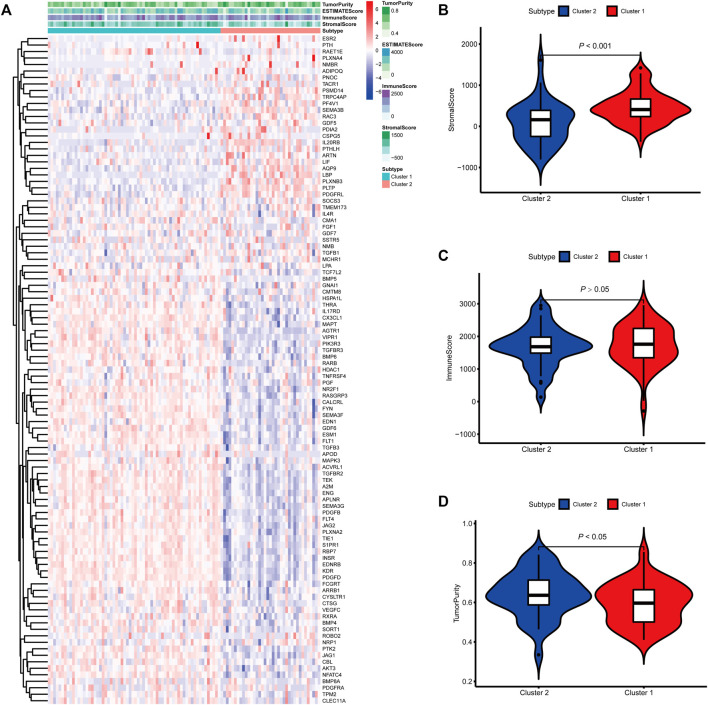
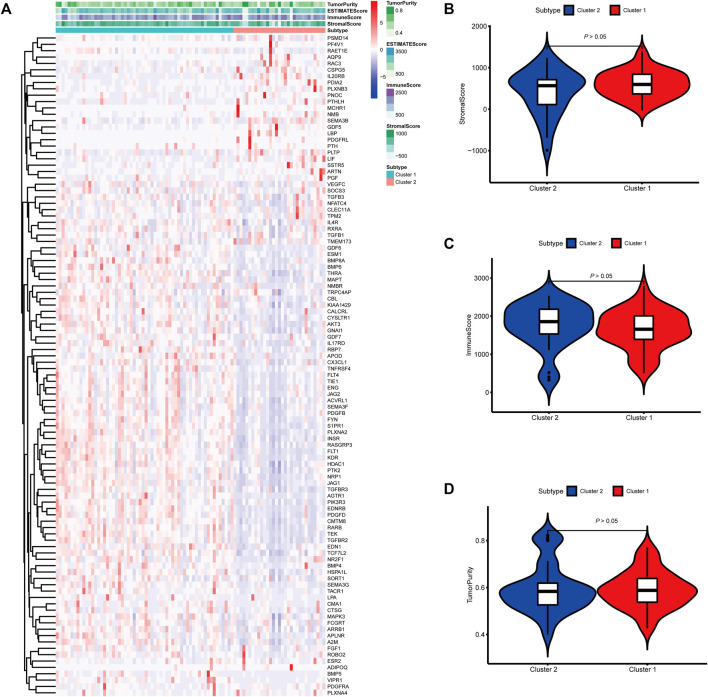
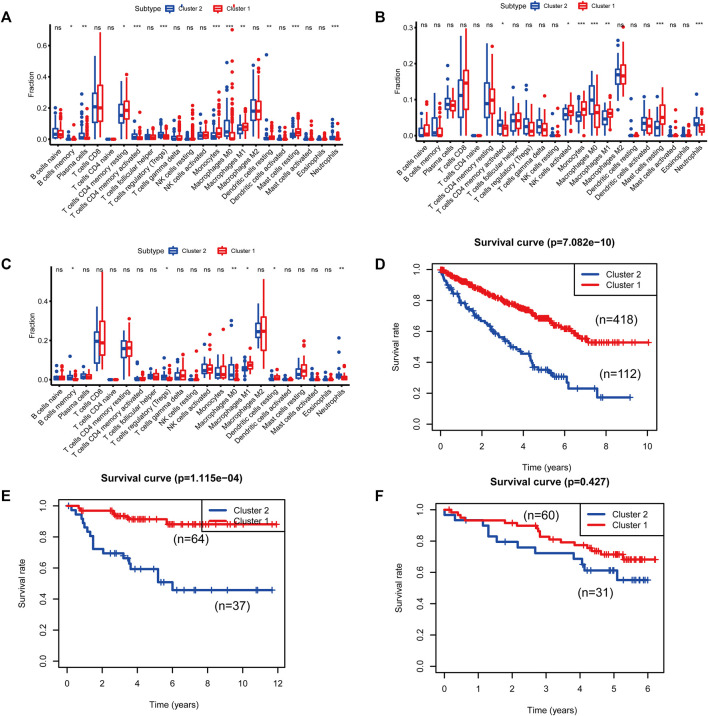
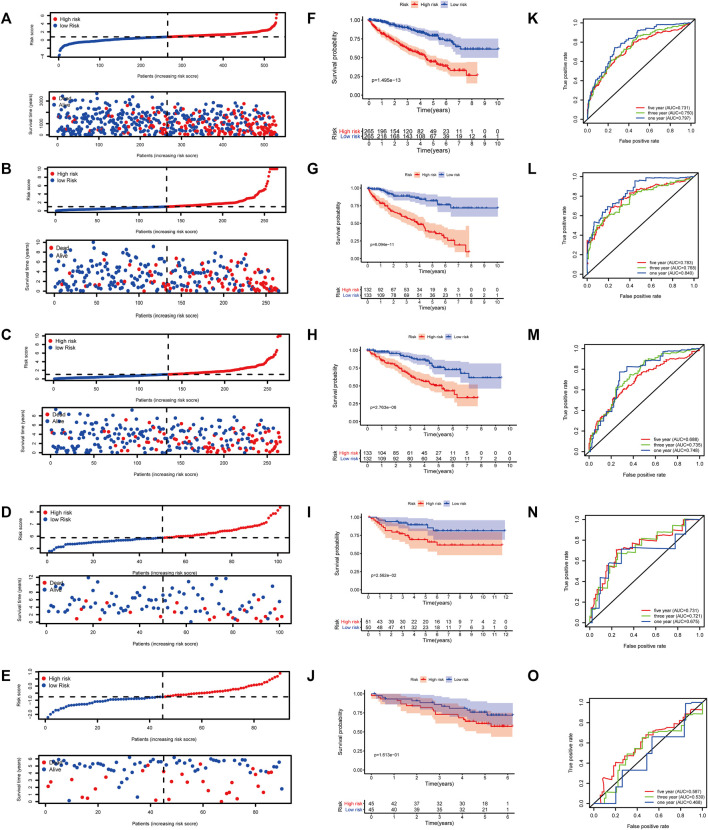
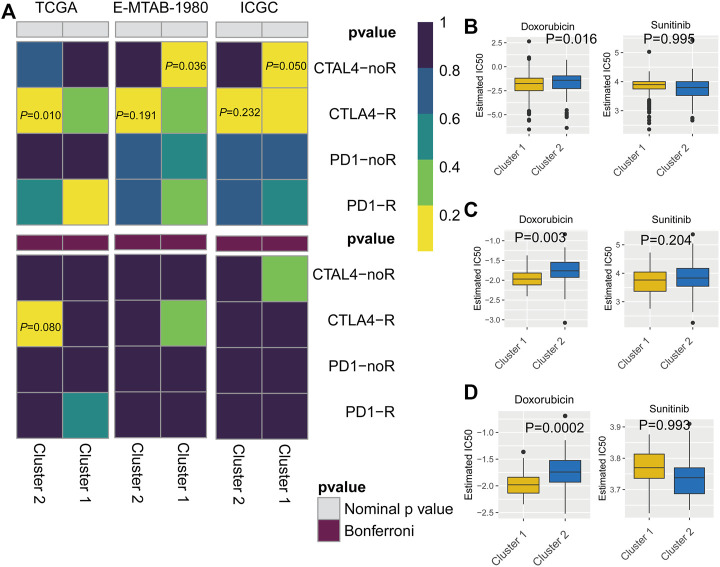
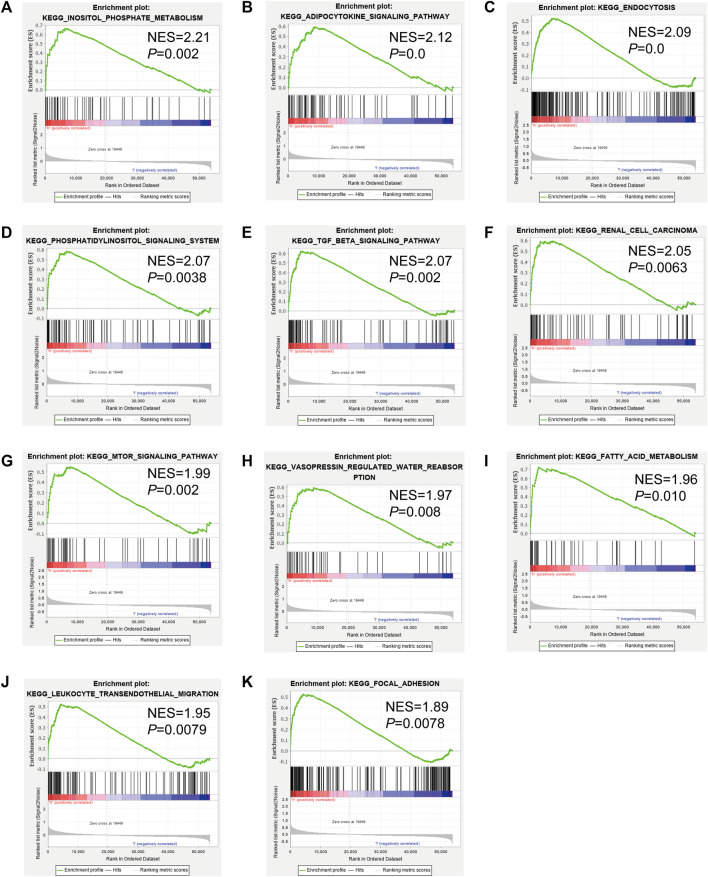
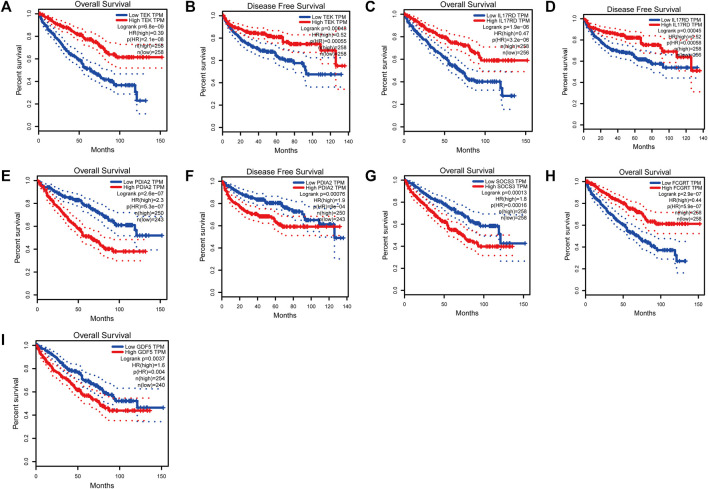
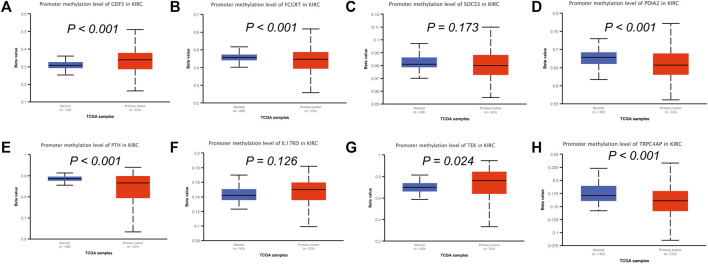
Background: Kidney renal clear cell carcinoma (KIRC) is a common malignant tumor of the urinary system. Surgery is the preferred treatment option; however, the rate of distant metastasis is high. Mast cells in the tumor microenvironment promote or inhibit tumorigenesis depending on the cancer type; however, their role in KIRC is not well-established. Here, we used a bioinformatics approach to evaluate the roles of mast cells in KIRC. Methods: To quantify mast cell abundance based on gene sets, a single-sample gene set enrichment analysis (ssGSEA) was utilized to analyze three datasets. Weighted correlation network analysis (WGCNA) was used to identify the genes most closely related to mast cells. To identify new molecular subtypes, the nonnegative matrix factorization algorithm was used. GSEA and least absolute shrinkage and selection operator (LASSO) Cox regression were used to identify genes with high prognostic value. A multivariate Cox regression analysis was performed to establish a prognostic model based on mast cell-related genes. Promoter methylation levels of mast cell-related genes and relationships between gene expression and survival were evaluated using the UALCAN and GEPIA databases. Results: A prolonged survival in KIRC was associated with a high mast cell abundance. KIRC was divided into two molecular subtypes (cluster 1 and cluster 2) based on mast cell-related genes. Genes in Cluster 1 were enriched for various functions related to cancer development, such as the TGFβ signaling pathway, renal cell carcinoma, and mTOR signaling pathway. Based on drug sensitivity predictions, sensitivity to doxorubicin was higher for cluster 2 than for cluster 1. By a multivariate Cox analysis, we established a clinical prognostic model based on eight mast cell-related genes. Conclusion: We identified eight mast cell-related genes and constructed a clinical prognostic model. These results improve our understanding of the roles of mast cells in KIRC and may contribute to personalized medicine.

Keywords: ICGC; TCGA; WGCNA; arrayexpress; clinical prognostic model; mast cell; renal clear cell carcinoma.


Conflict of interest statement

The authors declare that the research was conducted in the absence of any commercial or financial relationships that could be construed as a potential conflict of interest.

Figures

FIGURE 1
FIGURE 1
(A–C) Kaplan–Meier curves for patients with bladder cancer (BLCA) showed that in the six cohorts, patients with a low fibroblast abundance have a better prognosis than that of patients with a high fibroblast abundance [(A): The Cancer Genome Atlas (TCGA); (B): E-MTAB-1980; (C): International Cancer Genome Consortium (ICGC)] (C) Using weighted correlation network analysis (WGCNA), eight modules were identified. (D) The brown module was most highly correlated with mast cells (cor: 0.58, p = 9e-46). (E, F) Functional enrichment analysis of 258 mast cell-related genes.
FIGURE 2
FIGURE 2
Molecular subtypes identified based on mast cell-related genes in The Cancer Genome Atlas (TCGA) cohort. (A) Heatmap of differences between cluster 1 and cluster 2. (B–D) Differential analyses of the immune score, stromal score, and tumor purity between cluster 1 and cluster 2.
FIGURE 3
FIGURE 3
Molecular subtypes identified based on mast cell-related genes in the E-MTAB-1980 cohort. (A) Heatmap of differences between cluster 1 and cluster 2. (B–D) Differential analyses of the immune score, stromal score, and tumor purity between cluster 1 and cluster 2.
FIGURE 4
FIGURE 4
Molecular subtypes identified based on mast cell-related genes in the International Cancer Genome Consortium (ICGC) cohort. (A) Heatmap of differences between cluster 1 and cluster 2. (B–D) Differential analyses of the immune score, stromal score, and tumor purity between cluster 1 and cluster 2.
FIGURE 5
FIGURE 5
Differences in immune cell populations and survival between the two molecular subtypes of cluster 1 and cluster 2. [(A, D): The Cancer Genome Atlas (TCGA); (B, E): E-MTAB-1980; (C, F): International Cancer Genome Consortium (ICGC)].
FIGURE 6
FIGURE 6
Gene set enrichment analysis (GSEA) of Kyoto Encyclopedia of Genes and Genomes (KEGG) pathway differences between cluster 1 and cluster 2. [(A): inositol phosphate metabolism, (B): adipocytokine signaling pathway, (C): endocytosis, (D): phosphatidylinositol signaling system, (E): TGFβ signaling pathway, (F): renal cell carcinoma, (G): mTOR signaling pathway, (H): vasopressin regulated water reabsorption, (I): fatty acid metabolism, (J): leukocyte transendothelial migration, (K): focal adhesion]. NES: normalized enrichment score.
FIGURE 7
FIGURE 7
(A) Subclass mapping analysis showed that cluster 2 is sensitive to CTLA4-R. [The Cancer Genome Atlas (TCGA): PCTLA4-R = 0.010; E-MTAB-1980: PCTLA4-R = 0.191; International Cancer Genome Consortium (ICGC): PCTLA4-R = 0.232] Based on corrected p-values, cluster 1 is not sensitive to CTLA4-R. (B) Box plot of estimated IC50 values for sunitinib and doxorubicin in cluster 1 and cluster 2. [(A): TCGA; (B): E-MTAB-1980; (C): International Cancer Genome Consortium (ICGC)].
FIGURE 8
FIGURE 8
(A–E) Distribution of patients according to the risk index. (F–J) Risk score calculated from the clinical prognostic model can predict survival. (K–O) Receiver operating characteristic (ROC) curve to verify the prognostic value of the model. [(A, F, K): The Cancer Genome Atlas (TCGA); (B, G, L): TCGA training group; (C, H, M): TCGA testing group; (D, I, N): E-MTAB-1980; (E, J, O): International Cancer Genome Consortium (ICGC)].
FIGURE 9
FIGURE 9
Analysis of overall survival (OS) and disease-free survival (DFS) by the application of the constructed model based on mast cell-related genes of patients with kidney renal clear cell carcinoma (KIRC). (TEK: pOS < 0.001, pDFS = 0.00043; IL17RD: pOS < 0.001, pDFS = 0.00045; FCGRT: pOS < 0.001; PDIA2: pOS < 0.001, pDFS = 0.00076; SOCS3: pOS = 0.00013; GDF5: pOS = 0.00013).
FIGURE 10
FIGURE 10
Analysis of promoter methylation levels of mast cell-related genes in the constructed model. (A–H) GDF5: p < 0.001; SOCS3: p = 0.173; FCGRT: p < 0.001; PDIA2: p < 0.001; PTH: p < 0.001; IL17RD: p = 0.126; TEK: p = 0.024; TRPC4AP: p < 0.001.

References

    1. Abdel-Majid R. M., Marshall J. S. (2004). Prostaglandin E2Induces Degranulation-independent Production of Vascular Endothelial Growth Factor by Human Mast Cells. J. Immunol. 172, 1227–1236. 10.4049/jimmunol.172.2.1227 - DOI - PubMed
    1. Amini R.-M., Aaltonen K., Nevanlinna H., Carvalho R., Salonen L., Heikkilä P., et al. (2007). Mast Cells and Eosinophils in Invasive Breast Carcinoma. BMC Cancer 7, 165. 10.1186/1471-2407-7-165 - DOI - PMC - PubMed
    1. Beuselinck B., Job S., Becht E., Karadimou A., Verkarre V., Couchy G., et al. (2015). Molecular Subtypes of clear Cell Renal Cell Carcinoma Are Associated with Sunitinib Response in the Metastatic Setting. Clin. Cancer Res. 21, 1329–1339. 10.1158/1078-0432.CCR-14-1128 - DOI - PubMed
    1. Bindea G., Mlecnik B., Tosolini M., Kirilovsky A., Waldner M., Obenauf A. C., et al. (2013). Spatiotemporal Dynamics of Intratumoral Immune Cells Reveal the Immune Landscape in Human Cancer. Immunity 39, 782–795. 10.1016/j.immuni.2013.10.003 - DOI - PubMed
    1. Boesiger J., Tsai M., Maurer M., Yamaguchi M., Brown L. F., Claffey K. P., et al. (1998). Mast Cells Can Secrete Vascular Permeability Factor/Vascular Endothelial Cell Growth Factor and Exhibit Enhanced Release after Immunoglobulin E-dependent Upregulation of Fcε Receptor I Expression. J. Exp. Med. 188, 1135–1145. 10.1084/jem.188.6.1135 - DOI - PMC - PubMed