. 2020 Dec;1(3):64.
doi: 10.3847/psj/abbc14. Epub 2020 Nov 12.

Global Temporal and Geographic Stability of Brines on Present-day Mars

Affiliations

Global Temporal and Geographic Stability of Brines on Present-day Mars

Vincent F Chevrier et al. Planet Sci J. 2020 Dec.

Abstract

We combine experimentally verified constraints on brine thermodynamics along with a global circulation model to develop a new extensive framework of brine stability on the surface and subsurface of Mars. Our work considers all major phase changes (i.e., evaporation, freezing, and boiling) and is consistent, regardless of brine composition, so it is applicable to any brine relevant to Mars. We find that equatorial regions typically have temperatures too high for stable brines, while high latitudes are susceptible to permanent freezing. In the subsurface, this trend is reversed, and equatorial regions are more favorable to brine stability, but only for the lowest water activities (and lowest eutectic temperatures). At locations where brines may be stable, we find that their lifetimes can be characterized by two regimes. Above a water activity of ~0.6, brine duration is dominated by evaporation, lasting at most a few minutes per sol. Below a water activity of 0.6, brine duration is bound by freezing or boiling; such brines are potentially stable for up to several consecutive hours per sol. Our work suggests that brines should not be expected near or on the Martian surface, except for low eutectic water activity salts such as calcium or magnesium perchlorate or chlorate, and their (meta)stability on the surface would require contact with atmospheric water vapor or local ice deposits.


Figures

Figure 1.
Figure 1.
Measured eutectic temperatures as a function of water activity for various salts relevant to Mars (including sulfates, chlorides, perchlorates, and chlorates). The red line corresponds to the theoretical water activity line determined by the ratio of the saturation pressure over ice divided by the saturation pressure over liquid (Murphy & Koop 2005). The gray zone indicates the transition from evaporation dominated stability to freezing and boiling stability on Mars, around aH2O = 0.62 (Figure 6). Although ferric sulfate has a higher eutectic temperature, around 246.5 K (Hennings et al. 2013), it has been shown that supersaturated brines can easily undergo supercooling and remain liquid down to a glass transition around 205 K (Chevrier & Altheide 2008).
Figure 2.
Figure 2.
Maps of the evaporation of liquid brines (up to 60° latitude) for various water activities ranging from 1 (pure water) to 0.5 (lowest eutectic brines such as calcium perchlorate), projected on a MOLA shaded relief map. Evaporation rates are calculated in a dry atmosphere (pH2O = 0) using average surface temperature determined from the global circulation model MarsWRF (Section 2.1) and the theoretical framework presented in Section 2.2. The color maps are then interpolated from the original 5° × 5° grid. Brine stability is also presented with respect to boiling and freezing at the maximum yearly temperatures, thus providing an upper limit to brine stability. In the maps, light gray (high northern latitudes at aH2O = 1) indicates freezing conditions (temperature below the eutectic) while the shaded areas limited by thick black lines (at low latitudes and in the southern hemisphere) indicate boiling conditions (where the water equilibrium vapor pressure psat is above the atmospheric ambient pressure P). Liquid brines are only stable in the colored areas, where the maximum temperatures are above the eutectic corresponding to the water activity in the liquid phase and where the saturation pressure does not reach the boiling point.
Figure 3.
Figure 3.
Map of liquid brine evaporation at water activity of 0.5, projected on a MOLA shaded relief map. Evaporation rates are calculated using average surface temperature determined from the global circulation model MarsWRF (Section 2.1) and the theoretical framework presented in Section 2.2. The color maps are then interpolated from the original 5° × 5° grid. Brine stability is presented with respect to freezing at the minimum yearly temperature, thus providing a lower boundary to brine stability. Most of the surface is frozen (gray regions) except for the three colored regions delimited by a blue line. Moreover, any brine with a higher water activity is frozen at those temperatures. This shows that only brines with the lowest eutectics in these two regions (south of Chryse Planitia on the west and south of Isidis Basin on the east) can remain permanently liquid at the surface of Mars, with respect to freezing.
Figure 4.
Figure 4.
Map of liquid brine evaporation in the subsurface of Mars, projected on a MOLA shaded relief map. Evaporation rates are calculated using average surface temperature determined from the global circulation model MarsWRF (Section 2.1) and the theoretical framework presented in Section 2.2, but modified by diffusion through the regolith at a depth of three times the seasonal thermal skin depth. As the thermal amplitude is completely dampened, we use average temperatures to determine freezing. Thus, brines are permanently frozen in the gray areas and liquid only in the colored areas (delimited by a green line). At this depth, there is no boiling because of the overlying regolith. As stability is limited by the average temperature, only brines with water activities of 0.6 or below are stable, while any brine with a higher activity is systematically frozen in the subsurface.
Figure 5.
Figure 5.
Maps of average brine lifetime on the surface depending on the water activity, projected on a MOLA shaded relief map. The lifetime is based on the average evaporation rates calculated for each hour of the MarsWRF global circulation model output, excluding when freezing and boiling occur. Therefore, gray areas are when liquids are never stable (only freezing or boiling). Note that the maps are not on the same scale due to the wide range of evaporation rates at each water activity (as lower water activities allow for lower temperatures and therefore exponentially lower evaporation rates).
Figure 6.
Figure 6.
Maps of maximum brine lifetime on the surface depending on the water activity, projected on a MOLA shaded relief map. The lifetime is based on the minimum evaporation rates calculated for each hour of the MarsWRF global circulation model output, excluding when freezing and boiling occur. Gray areas are when liquids are never stable (only freezing or boiling). Note that the maps are not on the same scale due to the wide range of evaporation rates at each water activity (since lower water activities allow for lower temperatures and therefore exponentially lower evaporation rates).
Figure 7.
Figure 7.
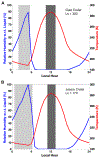
Two examples of diurnal cycle with overlaid brine stability for locations relevant to Mars exploration and a brine activity of 0.5 (eutectic temperature of 190 K, so slightly below calcium perchlorate). A. Gale Crater (Ls = 300) and B. Jezero Crater (Ls = 170). We chose the best-case scenario for brine stability, e.g., resulting in the maximum number of consecutive hours of liquid stability (Ls = 300 for Gale Crater and Ls = 170 for Jezero Crater). In the light gray zone, brines are fully stable with respect to freezing, evaporation and boiling. In the dark gray zone, brines are boiling (see Section 6). There is no freezing because temperatures are high enough to be above the eutectic temperatures.
Figure 8.
Figure 8.
Maps of continuous hours of brine metastability as a function of water activity, projected on a MOLA shaded relief map. These maps are similar to Figure 5, but presenting the duration per sol, so a brine extending to 24 hr is stable over an entire Martian day. Contrary to Figure 5, the minimum evaporation rate (Figure 6) is used to determine an upper boundary for the lifetime of the brine (e.g., best-case scenario). Water activities above 0.8 are ignored as they present a negligible timescale in the order of a few seconds.
Figure 9.
Figure 9.
Percentage of the Martian surface where evaporation dominated over boiling or freezing during the lifetime of a brine (based on Figure 5). On this plot, the percent found for a given water activity is shown as a cyan circle and the solid black line is illustrating the trend as a function of water activity. For high water activity brines (i.e., aH2O > 0.7), evaporation is faster than the hourly changing conditions across all of the surface and thus dominates the lifetime of a brine. Conversely, for aH2O < 0.58, evaporation is much slower compared to the hourly changing conditions, and so boiling and/or freezing regulate the lifetime of a brine across the surface of Mars, yet are more stable over time.
Figure 10.
Figure 10.
Maps of thermodynamically stable brine duration as a function of water activity, projected on a MOLA shaded relief map. These maps are similar to Figure 5, but include partial pressure of water in the atmosphere. When the water pressure is above the saturation partial pressure of the brine, then the liquid phase is fully stable (e.g., evaporation does not occur). Only brines with water activities below 0.55 are stable on the surface against freezing, boiling and evaporation, while no brine is ever fully stable over an entire day. In specific regions, brines with very low eutectic points can be stable at most for about 12 hr.
Figure 11.
Figure 11.
Maps of minimum brine lifetime on the surface depending on the water activity, projected on a MOLA shaded relief map. The lifetime is based on the maximum evaporation rates calculated for each hour of the MarsWRF global circulation model output, excluding when freezing and boiling occur. Gray areas are when liquids are never stable (only freezing or boiling). Note that the maps are not on the same scale due to the wide range of evaporation rates at each water activity (since lower water activities allow for lower temperatures and therefore exponentially lower evaporation rates).

References

    1. Altheide TS, Chevrier V, Nicholson C, & Denson J 2009, E&PSL, 282, 69
    1. Bandfield JL 2007, Natur, 447, 64 - PubMed
    1. Banfield D, Stern J, Davila A, et al. 2020, LPI, 2326, 2474
    1. Boynton WP, & Brattain WH 1929, in Interdiffusion of Gases and Vapors, International Critical Tables of Numerical Data, Physics, Chemistry and Technology, ed. Washburn EW (Washington, DC: National Research Council; ), 62
    1. Brass GW 1980, Icar, 42, 20

LinkOut - more resources