. 2022 Jan;38(1):e3539.
doi: 10.1002/cnm.3539. Epub 2021 Oct 24.

Computer simulation of tumour resection-induced brain deformation by a meshless approach

Affiliations

Computer simulation of tumour resection-induced brain deformation by a meshless approach

Yue Yu et al. Int J Numer Method Biomed Eng. 2022 Jan.

Abstract

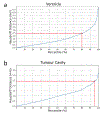
Tumour resection requires precise planning and navigation to maximise tumour removal while simultaneously protecting nearby healthy tissues. Neurosurgeons need to know the location of the remaining tumour after partial tumour removal before continuing with the resection. Our approach to the problem uses biomechanical modelling and computer simulation to compute the brain deformations after the tumour is resected. In this study, we use meshless Total Lagrangian explicit dynamics as the solver. The problem geometry is extracted from the patient-specific magnetic resonance imaging (MRI) data and includes the parenchyma, tumour, cerebrospinal fluid and skull. The appropriate non-linear material formulation is used. Loading is performed by imposing intra-operative conditions of gravity and reaction forces between the tumour and surrounding healthy parenchyma tissues. A finite frictionless sliding contact is enforced between the skull (rigid) and parenchyma. The meshless simulation results are compared to intra-operative MRI sections. We also calculate Hausdorff distances between the computed deformed surfaces (ventricles and tumour cavities) and surfaces observed intra-operatively. Over 80% of points on the ventricle surface and 95% of points on the tumour cavity surface were successfully registered (results within the limits of two times the original in-plane resolution of the intra-operative image). Computed results demonstrate the potential for our method in estimating the tissue deformation and tumour boundary during the resection.

Keywords: Total Lagrangian formulation; brain shift; medical image registration; meshless methods; patient-specific biomechanical simulations; tumour resection.


Figures

Figure 1.
Figure 1.
Biomechanics-based non-rigid medical image registration framework adapted from [10,11]. The flow chart outlines the steps used to register the pre-operative images to their intra-operative configurations using a biomechanical model. M is the moving image (pre-operative image). T is the transform that registers the pre-operative image to the current intra-operative configuration of the brain. In this paper, we used a meshless solver to compute the displacements at every node of the biomechanical model and calculated the transformation from the computed nodal displacements. Using a finite element method (FEM) solver is also possible [11], but the construction of high-quality finite element mesh is labour intensive and not compatible with clinical workflows [12]. The content for each block of the flowchart in this figure is given in the subsequent sections of this paper.
Figure 2.
Figure 2.
CSF content within the parenchyma tissue in one of the MRI slices. (a) Sagittal slice of the pre-operative MRI. CSF content within the parenchyma tissue is indicated by a yellow circle. Using “hard” segmentation to distinguish this CSF content would be very challenging. (b) Sagittal slice of the intra-operative MRI. The frontal lobe collapsed due to loss of the CSF content within the parenchyma tissue (indicated by a yellow circle). RAS anatomical coordinate system (R stands for right, A stands for anterior, S stands for superior).
Figure 3.
Figure 3.
Pre-operative MRI section classified by fuzzy tissue classification method (a) Pre-operative MRI in coronal view. (b) The fuzzy membership function of parenchyma tissue indicated at each pixel by the grey level (0 ≤ ujk ≤ 1). (c) The fuzzy membership function of ventricular CSF and CSF within the left hemisphere indicated at each pixel by the grey level (0 ≤ ujk ≤ 1). (d) The fuzzy membership function of CSF within the right hemisphere indicated at each pixel by the grey level (0 ≤ ujk ≤ 1). (e) The fuzzy membership function of the tumour indicated at each pixel by the grey level (ujk = 1).
Figure 4.
Figure 4.
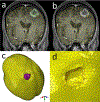
The meshless biomechanical brain model section (a) with tumour and (b) with cavity overlaid on the pre-operative MRI coronal slice (The tumour nodes are indicated in green and non-tumour nodes are indicated in yellow). (c) Surface visualisation of the computational grid (The tumour integration grid is indicated in magenta). (d) Shared nodes (red dots) between tumour and surrounding parenchyma tissue. In both (c) and (d), the non-tumour tissue integration grid is indicated in yellow. Our tetrahedral integration grid is not a finite element mesh and does not need to conform to strict quality requirements demanded by the finite element method.
Figure 5.
Figure 5.
The example used in this study to verify the Meshless Total Lagrangian Explicit Dynamics (MTLED) algorithm for problems involving gravity loading: cylinder subjected to gravity force. (a) undeformed model; (b) deformed model (displacements are in meters). Gravity is applied in the negative Z-direction and the bottom surface of the cylinder is fixed. See Table 3 for the material properties. There are no finite elements in this model, the triangles shown in this figure were created solely to visualise the model surface by connecting the selected nodes of the model.
Figure 6.
Figure 6.
Cylinder subjected to gravity force: Differences (measured using Euclidean distance in mm) between the deformation computed using MTLED and Abaqus FE. Left-hand-side column images show the differences using the colour scale, and the right-hand-side column images show the histograms of the differences. (a) Comparison between MTLED and the four-noded tetrahedral element (C3D4) Abaqus solution. (b) Comparison between MTLED and the ten-noded tetrahedral element (C3D10) Abaqus solution.
Figure 7.
Figure 7.
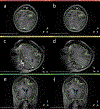
Comparison of the predicted intra-operative brain geometry contour (white) and the actual intra-operative brain geometry contour (green), together with the pre-operative geometry contour (yellow line, without tumour). (a) and (b) show the axial view, (c) and (d) show the sagittal view, (e) and (f) show the coronal view. Predicted (red) and intra-operative (blue) ventricle contours are shown in (c), (e) and (f). The MRI sections shown here are from the intra-operative MRI. In the tumour area, the yellow line represents the pre-operative tumour cavity and the green line represents the actual intra-operative tumour cavity. The figure highlights the importance of compensating the brain shift for neurosurgery.
Figure 8.
Figure 8.
Three-dimensional intra-operative segmentation. Gravity acts (orange arrow) in the negative A direction of the RAS anatomical coordinate system.
Figure 9.
Figure 9.
(a) Predicted intra-operative ventricle surface (Surface A) with Euclidean distance d (in mm) distribution to the actual intra-operative ventricle surface. (b) Actual intra-operative ventricle surface (Surface B) with Euclidean distance d (in mm) distribution to the predicted intra-operative ventricle surface. Maximum distance (local misalignment) occurs in the anterior part of the ventricle surfaces. One of the contributors to this misalignment could be the geometric distortion of the anterior part of the patient’s brain in the intra-operative MRI (intra-operative MRI distortion is shown in Figure 11). (c) Predicted intra-operative tumour cavity surface (Surface C) with Euclidean distance d (in mm) distribution to the actual intra-operative tumour cavity surface. (d) Actual intra-operative tumour cavity surface (Surface D) with Euclidean distance d (in mm) distribution to the predicted intra-operative tumour cavity surface.
Figure 10.
Figure 10.
(a) Hausdorff distance between predicted and intra-operative ventricles at different percentiles. Two times the in-plane resolution of the intra-operative image (2.4 mm, indicated by the red line) corresponds to 80-percentile HD. (b) The percentile of Hausdorff distance between the predicted and intra-operative tumour cavities. Two times the in-plane resolution of the intra-operative image (2.4 mm, indicated by the red line) corresponds to 95-percentile HD.
Figure 11.
Figure 11.
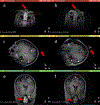
Geometric distortions (indicated by the red arrows) detected in the intra-operative MRIs used in this study. Images ((a), (c), and (e)) in the left column are from the pre-operative MRI and images ((b), (d), and (f)) in the right column are from the intra-operative MRI. We compare the right column images with the corresponding images in the left column. The comparison indicates distortion of the patient’s nose geometry (image(b)). Reflection of the patient’s neck showing above the head (image(d)), and distortion of patient’s neck geometry (image(f)).
Figure 12.
Figure 12.
(a) FE biomechanical brain model with three tissue types. Parenchyma tissue in green, tumour in red and ventricle in blue. (b) Comparison of MTLED based predicted intra-operative brain surface contour (white) with the Abaqus based predicted intra-operative brain surface contour (red). The contours are overlaid on the intra-operative MRI (Coronal View).
Figure 13.
Figure 13.
(a) Brain tumour in the pre-operative MRI. The yellow contour (indicated by the red arrow) represents the tumour region. (b) White areas (indicated by the orange arrow) in the intra-operative tumour cavity

Similar articles

Cited by

References

    1. Lapointe S, Perry A, & Butowski NA (2018). Primary brain tumours in adults. The Lancet (British edition), 392(10145), 432–446. 10.1016/S0140-6736(18)30990-5 - DOI - PubMed
    1. Fox BDMD, Cheung VJBA, Patel AJMD, Suki DP, & Rao GMD (2011). Epidemiology of Metastatic Brain Tumors. Neurosurgery clinics of North America, 22(1), 1–6. 10.1016/j.nec.2010.08.007 - DOI - PubMed
    1. Saenz del Burgo LP, Hernández RMP, Orive GP, & Pedraz JLP (2014). Nanotherapeutic approaches for brain cancer management. Nanomedicine, 10(5), e905–e919. 10.1016/j.nano.2013.10.001 - DOI - PubMed
    1. CANCER TODAY. Retrieved 16/12/2020, from World Health Organization. Global Health Observatory. Geneva: World Health Organization; https://gco.iarc.fr/today/home
    1. Minniti G, Filippi AR, Osti MF, & Ricardi U (2017). Radiation therapy for older patients with brain tumors. Radiation Oncology (London, England), 12(1), 101–101. 10.1186/s13014-017-0841-9 - DOI - PMC - PubMed

Publication types

LinkOut - more resources