. 2022 Jan;44(1):18-33.
doi: 10.1002/hed.26894. Epub 2021 Oct 14.

MiRNome analysis identifying miR-205 and miR-449a as biomarkers of disease progression in intestinal-type sinonasal adenocarcinoma

Affiliations

MiRNome analysis identifying miR-205 and miR-449a as biomarkers of disease progression in intestinal-type sinonasal adenocarcinoma

Massimo Re et al. Head Neck. 2022 Jan.

Abstract

Background: Patients with intestinal-type sinonasal adenocarcinoma (ITAC) have an unfavorable prognosis, and new diagnostic and therapeutic approaches are needed to improve clinical management.

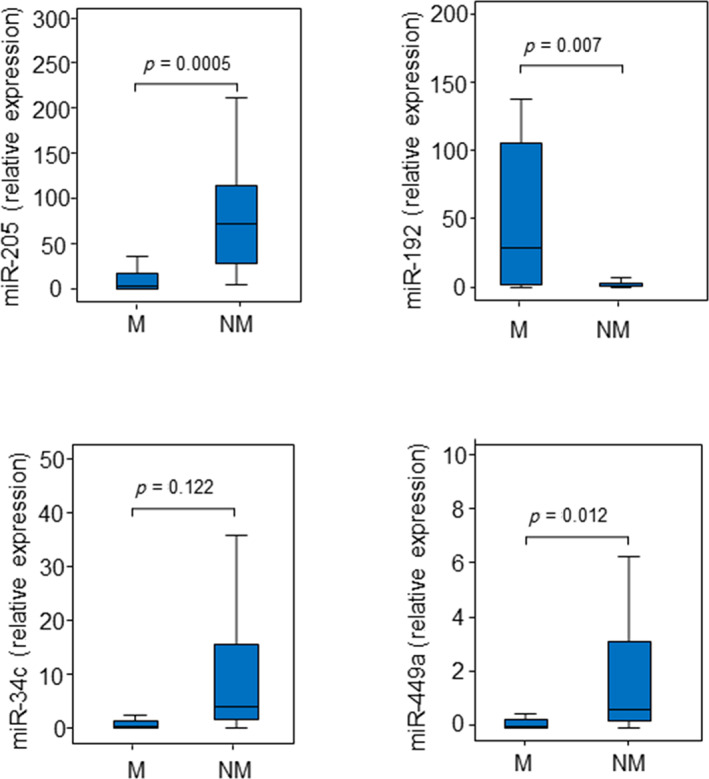
Methods: Next-generation sequencing-based miRNome analysis was performed on 43 ITAC patients who underwent surgical resection, and microRNA (miRNA) data were obtained from 35 cases. Four miRNAs were identified, and their expression levels were detected by reverse-transcription quantitative polymerase chain reaction and related to the relevant patient outcome. Overall survival and disease-free survival rates were evaluated through the Kaplan-Meier method and log-rank test, and multivariate analysis was performed by means of Cox proportional hazard analysis.

Results: High levels of miR-205 and miR-34c/miR-449 cluster expression were associated with an increased recurrence risk and, therefore, a worse prognosis. Multivariate analysis confirmed that miR-205 and miR-449 were significant prognostic predictors.

Conclusions: A high expression of miR-205 and miR-449 is independent predictors of poor survival for ITAC patients.

Keywords: biomarkers; ethmoid sinus; intestinal-type sinonasal adenocarcinoma (ITAC); miRNAs; miRNome.


Conflict of interest statement

The authors declare that they have no conflict of interest.

Figures

FIGURE 1
FIGURE 1
Hierarchical cluster analysis based on miRNA expression (miRNome). (A) Heatmap of significantly deregulated miRNA between malignant (M) and adjacent non‐malignant counterpart (NM). Intensity of color hints at the expression level (red‐orange, high expression; sky‐blue, low expression). (B) Volcano plot between cancer and normal tissue. There were relatively upregulated/downregulated miRNAs with statistical significance (adjusted p < 0.05) [Color figure can be viewed at wileyonlinelibrary.com]
FIGURE 2
FIGURE 2
Distribution of deregulated miRNAs in ITAC. Down‐ and upregulated miRNA in malignant tissues compared to non‐malignant tissues according to fold‐change (A) and p‐value (B). Differences with p < 0.05 were considered statistically significant [Color figure can be viewed at wileyonlinelibrary.com]
FIGURE 3
FIGURE 3
Distribution of selected miRNAs in ITAC. Expression of miR‐205, miR‐192, miR‐34c, and miR‐449a in malignant (M) and non‐malignant (NM) tissues. Comparisons between groups were determined by t‐test analysis. Differences with p < 0.05 were considered statistically significant [Color figure can be viewed at wileyonlinelibrary.com]
FIGURE 4
FIGURE 4
(A) Relationship between occupational exposure and miR‐34c. (B) ROC curves and the area under curve (AUC) with error standard (ES), confidence interval (CI), cut‐offs, sensitivity, and specificity in discriminating ITAC tissues from non‐malignant tissues. Differences with p < 0.05 were considered statistically significant
FIGURE 5
FIGURE 5
Kaplan–Meier survival curves for ITAC stratified for miRNA expression. Low and high miRNA expressions of miR‐205 (A), miR‐34c (B), and miR‐449a (C) were associated with disease‐free survival (DFS). Comparisons between groups were made using log‐rank test, and two‐sided p < 0.05 was considered statistically significant. Median values and a 95% confidential interval (CI) [minimum–maximum] are summarized in the chart on the right [Color figure can be viewed at wileyonlinelibrary.com]
FIGURE 6
FIGURE 6
Kaplan–Meier survival curves for ITAC stratified for miRNA expression. Low and high expressions of miR‐205 (A) and miR‐34c (B) were associated with overall survival. Comparisons between groups were made using log‐rank test, and two‐sided p < 0.05 was considered statistically significant. Median values and a 95% confidential interval (CI) [minimum–maximum] are summarized in the chart on the right [Color figure can be viewed at wileyonlinelibrary.com]

Similar articles

Cited by

References

    1. Turner JH, Reh DD. Incidence and survival in patients with sinonasal cancer: a historical analysis of population‐based data. Head Neck. 2012;34:877‐885. - PubMed
    1. Kilic S, Samarrai R, Kilic SS, Mikhael M, Baredes S, Eloy JA. Incidence and survival of sinonasal adenocarcinoma by site and histologic subtype. Acta Otolaryngol. 2018;138(4):415‐421. - PubMed
    1. Weber AL, Stanton AC. Malignant tumors of the paranasal sinuses: radiologic, clinical, and histopathologic evaluation of 200 cases. Head Neck Surg. 1984;6(3):761‐776. - PubMed
    1. D'Aguillo CM, Kanumuri VV, Khan MN, et al. Demographics and survival trends of sinonasal adenocarcinoma from 1973 to 2019. Int Forum Allergy Rhinol. 2014;4:771‐776. - PubMed
    1. Binazzi A, Ferrante P, Marinaccio A. Occupational exposure and sinonasal cancer: a systematic review and meta‐analysis. BMC Cancer. 2015;15:49. - PMC - PubMed

Publication types