. 2021 Nov;8(22):e2102157.
doi: 10.1002/advs.202102157. Epub 2021 Oct 14.

Obesity Impairs Embryonic Myogenesis by Enhancing BMP Signaling within the Dermomyotome

Affiliations

Obesity Impairs Embryonic Myogenesis by Enhancing BMP Signaling within the Dermomyotome

Liang Zhao et al. Adv Sci (Weinh). 2021 Nov.

Abstract

Obesity during pregnancy leads to adverse health outcomes in offspring. However, the initial effects of maternal obesity (MO) on embryonic organogenesis have yet to be thoroughly examined. Using unbiased single-cell transcriptomic analyses (scRNA-seq), the effects of MO on the myogenic process is investigated in embryonic day 9.5 (E9.5) mouse embryos. The results suggest that MO induces systematic hypoxia, which is correlated with enhanced BMP signaling and impairs skeletal muscle differentiation within the dermomyotome (DM). The Notch-signaling effectors, HES1 and HEY1, which also act down-stream of BMP signaling, suppress myogenic differentiation through transcriptionally repressing the important myogenic regulator MEF2C. Moreover, the major hypoxia effector, HIF1A, enhances expression of HES1 and HEY1 and blocks myogenic differentiation in vitro. In summary, this data demonstrate that MO induces hypoxia and impairs myogenic differentiation by up-regulating BMP signaling within the DM, which may account for the disruptions of skeletal muscle development and function in progeny.

Keywords: bone morphogenetic proteins signaling; embryonic myogenesis; maternal obesity; single cell RNA sequencing.


Conflict of interest statement

The authors declare no conflict of interest.

Figures

Figure 1
Figure 1
Single‐cell transcriptomic profiling of mouse embryos at embryonic 9.5 day (E9.5). A) Schematic of the experimental pipeline. After mating and plug‐checking, E9.5 embryos were collected from the control or obese (CT and MO) mothers. After disassociation, cell suspensions were processed with the 10X Genomics platform to capture single cells for library construction and sequencing using Illumina Novaseq 6000 (S4). B) UMAP visualization of 24 transcriptionally distinct clusters from integrated dataset of CT and MO samples. Cells with similar transcriptional profiles were grouped in each cluster and were shown in different colors. C) Dot plot showing one selected lineage‐specific marker gene expression for each cluster. D) Overall proportions of each cluster in E9.5 embryos. SCL, sclerotome; FLB, forelimb bud; ALNT, allantois; NTB1, neural tubes 1, SPP, splanchnopleure; NTB2, neural tubes 2; strNTB, stressed neural tubes; DM, dermomyotome; NMPs, neuromesodermal progenitors; SMP, somatopleure; EPID, epidermis; PSM, pre‐somitic mesoderm; ENDTH, endothelium; ENDO, endoderm; ERCS, erythroid cells; HR, heart; NC, neural crest; GLA, ganglia; NPs, Neural Crest; MSN, mesonephroi; LV, liver bud; SNs, sensory neurons; BLPs, blood progenitors; NOTO, notochord.
Figure 2
Figure 2
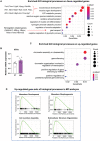
MO induces transcriptomic changes in E9.5 embryos. A) Representative terms of biological processes that are enriched by GO term analysis on down‐regulated genes of the whole cell population in the MO group. B) Relative mRNA expression of Hif1a in E9.5 mouse embryos. Three embryos from each litter were pooled together for mRNA extraction and the litter was an experimental unit. N = 6. **p < 0.01 (two tailed t‐test). CT, the control group. MO, the maternal obese group. C) Representative terms of biological processes that are enriched by GO term analysis on upregulated genes of the whole cell population in the MO group. D) Representative terms of biological processes that are enriched by GSEA on the whole cell population in the MO group.
Figure 3
Figure 3
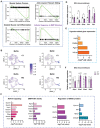
MO impairs myogenic processes within the DM. A) Representative terms of biological processes that are enriched by GSEA specific in the DM of the MO group. B) Feature plots showing the distribution of Mef2c and Mef2a in the DM. C) Representative genes with up‐regulated expression in the DM of the MO group that are involved in cellular response to BMP signals. D) Relative mRNA expression in E9.5 mouse embryos. E) Representative genes with up‐regulated expression in the DM of the MO group that are involved in hypoxic signaling and glycolysis. F) Relative mRNA expression in E9.5 mouse embryos. For (D,F), three embryos from each litter were pooled together for mRNA extraction and the litter was an experimental unit. N = 6. **p < 0.01, *p < 0.05 (two tailed t‐test), mean ± SEM. CT, the control group. MO, the maternal obese group. For (C) and (D), the P.adj (Benjamini–Hochberg adjusted p value, MAST test) < 0.05.
Figure 4
Figure 4
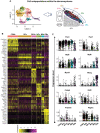
Single‐cell transcriptomic profiling of myogenic and brown adipogenic lineages identified in the DM. A) Through unsupervised clustering, cells in the DM were further sub‐divided into 6 populations and their distribution within the DM in vivo was grouped by marker gene expression. B) Heatmap showing the top 10 expressed genes within each cell population. C) VlnPlot showing the expression of manually selected canonical myogenic and brown adipogenic related genes across different cell populations. CDMs, central dermomyotomal cells; MPs, myogenic progenitors; MBs, myoblasts; PMs, primary myofibers; BPs, brown adipogenic progenitors; BPAs, brown preadipocytes; NTB, neural tube; NOTO, notochord; SCL, sclerotome.
Figure 5
Figure 5
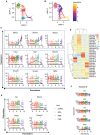
Re‐constructing the myogenic trajectory in vivo. A) Cells involved in myogenic lineages were selected; and B) used for trajectory construction by Monocle 3. C) Pseudotemporal changes of Mef2 family members and genes interacting with BMP signaling through the myogenic trajectory. D) Pseudotemporal changes of BMP signaling regulators through the pseudo myogenic path. E) Variable genes with changes as a function of pseudo time were grouped into 26 modules. F) Pseudotemporal changes of representative genes detected in Module 16. CDMs, central dermomyotomal cells; MPs, myogenic progenitors; MBs, myoblasts; PMs, primary myofibers.
Figure 6
Figure 6
HES1 and HEY1 represses myogenic differentiation through the regulation of Mef2c. A) A timeline of myogenic differentiation in the P19 EC cells. Relative mRNA expression of Hes1, Hey1, and Mef2c was shown across the timeline. ChIP‐qPCR analysis of B) HES1‐ or C) HEY1‐bound Mef2c promoter regions, and their positive (PS) and negative (NG) controls (CON), respectively. Relative enrichment folds were normalized to the IgG group. D) Immunoblotting of HES1 in transfected P19 cells at day 6 of myogenic induction. CON, control; HES1, overexpression of HES1 open reading frame; shHes1, shRNA of Hes1. E) Relative mRNA expression of Mef2c and Myog at day 6 of myogenic induction in transfected P19 cells (D). F) Immunofluorescence of MHC in transfected P19 cells after 9 days of differentiation (D). The percentage of MHC+ areas were measured. Bar, 1:200 µm. G) Immunoblotting of HEY1 in transfected P19 cells at day 6 of myogenic induction. CON, control; HEY1, overexpression of HEY1 open reading frame; shHey1, shRNA of Hey1. H) Relative mRNA expression of Mef2c and Myog at day 6 of myogenic induction in transfected P19 cells (G). I) Immunofluorescence of MHC in transfected P19 cells after 9 days of differentiation (G). The percentage of MHC+ areas were measured. Bar, 1:200 µm. For statistical analysis, the one‐way AVOVA followed by Bonferroni correction was used for (A), (E), (F), (H), and (I) while the two tailed t‐test was used for (B) and (C). **p < 0.01, *p < 0.05, mean ± SEM; N  =  3.
Figure 7
Figure 7
HIF1A represses myogenic differentiation through its regulation on HES1 and HEY1. A) Immunoblotting and arbitrary units of HIF1A, HES1, and HEY1 in transfected P19 cells at day 6 of myogenic induction. B,C) Relative mRNA expression of Mef2c and Myog at day 6 of myogenic induction in transfected P19 cells. D) Immunofluorescence of MHC in transfected P19 cells after 9 days of differentiation. The percentage of MHC+ areas were measured. Bar, 1:200 µm. E) Relative mRNA expression of BMP ligands at day 6 of myogenic induction in transfected P19 cells. CON, control; HIF1A, overexpression of HIF1A; HIF1A + shHes1, overexpression of HIF1A with knocked‐down expression of HES1; HIF1A + shHey1, overexpression of HIF1A with knocked‐down expression of HEY1. **p < 0.01, *p < 0.05 (one‐way ANOVA followed by Bonferroni correction), mean ± SEM; N  =  3.
Figure 8
Figure 8
Stage‐specific disruptions to myogenic lineages due to MO. A) Representative terms of biological processes that were enriched by GSEA in MPs within the DM of the MO group. B–D) Representative terms of biological processes that were enriched by GSEA in MBs within the DM of the MO group. E) Representative terms of biological processes that were enriched by GSEA in PMs within the DM of the MO group. DM, dermomyotome; MPs, myogenic progenitors; MBs, myoblasts; PMs, primary myofibers; CT, the control group; MO, the maternal obese group; GSEA, gene set enrichment analysis.

References

    1. Poston L., Caleyachetty R., Cnattingius S., Corvalán C., Uauy R., Herring S., Gillman M. W., Lancet Diabetes Endocrinol. 2016, 4, 1025. - PubMed
    1. Singh G. K., DiBari J. N., J. Obes. 2019, 2019, 2419263. - PMC - PubMed
    1. Godfrey K. M., Reynolds R. M., Prescott S. L., Nyirenda M., Jaddoe V. W., Eriksson J. G., Broekman B. F., Lancet Diabetes Endocrinol. 2017, 5, 53. - PMC - PubMed
    1. Neri C., Edlow A. G., Cold Spring Harb. Perspect. Med. 2016, 6, a026591. - PMC - PubMed
    1. Barker D. J., BMJ. 1990, 301, 1111. - PMC - PubMed

Publication types

Substances