

Brain cross-protection against SARS-CoV-2 variants by a lentiviral vaccine in new transgenic mice
- PMID: 34647691
- PMCID: PMC8646827
- DOI: 10.15252/emmm.202114459
Brain cross-protection against SARS-CoV-2 variants by a lentiviral vaccine in new transgenic mice
Abstract
COVID-19 vaccines already in use or in clinical development may have reduced efficacy against emerging SARS-CoV-2 variants. In addition, although the neurotropism of SARS-CoV-2 is well established, the vaccine strategies currently developed have not taken into account protection of the central nervous system. Here, we generated a transgenic mouse strain expressing the human angiotensin-converting enzyme 2, and displaying unprecedented brain permissiveness to SARS-CoV-2 replication, in addition to high permissiveness levels in the lung. Using this stringent transgenic model, we demonstrated that a non-integrative lentiviral vector, encoding for the spike glycoprotein of the ancestral SARS-CoV-2, used in intramuscular prime and intranasal boost elicits sterilizing protection of lung and brain against both the ancestral virus, and the Gamma (P.1) variant of concern, which carries multiple vaccine escape mutations. Beyond induction of strong neutralizing antibodies, the mechanism underlying this broad protection spectrum involves a robust protective T-cell immunity, unaffected by the recent mutations accumulated in the emerging SARS-CoV-2 variants.
Keywords: SARS-CoV-2 emerging variants of concern; central nervous system; hACE2 transgenic mice; intranasal vaccination; olfactory bulb.
© 2021 The Authors. Published under the terms of the CC BY 4.0 license.
Conflict of interest statement
PC is the founder and CSO of TheraVectys. MWK, FA, PA, AN, FM, BV, FN, JL, IF, and KN are employees of TheraVectys. Other authors declare that they have no conflict of interest. MWK, FA, AN, FLV, LM, and PC are inventors of a pending patent directed to the B6.K18‐hACE2IP‐THV transgenic mice and the potential of i.n. LV::S vaccination at protecting brain against SARS‐CoV‐2.
Figures

- A
Representative genotyping results from 15 N1 B6.K18‐hACE2IP‐THV mice as performed by qPCR to determine their hACE2 gene copy number per genome. Dots represent individual mice.
- B
Phenotyping of the same mice, presented in the same order, inoculated i.n. with 0.3 × 10⁵ TCID50 of SARS‐CoV‐2 at the age of 5–7 weeks and viral RNA content was determination in the indicated organs at 3 dpi by conventional E‐specific qRT‐PCR. Red lines indicate the qRT‐PCR limits of detection.
- C, D
Quantification (C) and images (D) of hACE2 protein expression level by Western blot from the lungs of the same mice as in panels A and B, presented in the same order.
- E, F
Kinetics of SARS‐CoV‐2 replication in the lungs and brain of B6.K18‐hACE2IP‐THV mice as followed by measuring viral RNA contents by conventional E‐specific qRT‐PCR (E) or by PFU counting (F).
- G
Percentage of initial weight measured from the mice of panels E and F.

- A
Representative H&E whole‐lung section at 3 dpi in B6.K18‐hACE2IP‐THV transgenic mice inoculated i.n. with 0.3 × 10⁵ TCID50 of SARS‐CoV‐2, compared with non‐infected controls (NI). In the infected lung, less transparent, purple‐red areas resulted from inflammatory lesions of the lung parenchyma. Scale bar: 500 μm.
- B–E
Examples of lesions observed in the lungs of infected mice at higher magnification. The two top panels depict mild (B) (scale bar: 100 μm) and mild‐to‐moderate (C) interstitium thickening accompanied by dense inflammatory infiltrates predominantly localized in the vicinity of bronchioles (yellow stars) and also present around blood vessels (green stars) (scale bar: 200 μm). (D) Alveoli filled with a proteinaceous exudate containing a few cells (green arrows) (scale bar: 50 μm). (E) Discrete degenerative lesions of the bronchiolar epithelium, such as perinuclear clear spaces (blue arrows), hyper‐eosinophilic cells with condensed nuclei (orange arrow) and some intraluminal fibrinous and cell debris (black arrow) in an overall well‐preserved epithelium (scale bar: 20 μm).
- F
Heatmap representing the histological scores for various parameters in infected mice at 3 dpi, compared to NI controls (n = 3/group). Statistical significance was evaluated by Mann–Whitney test (*P < 0.05, **P < 0.01, ****P < 0.0001, ns = not significant).
- G
Representative NCoV‐2‐specific IHC image of the brain in NI control or SARS‐CoV‐2‐infected mice at 3 dpi. Scale bar: 500 μm.
- H
Closer view of a NCoV‐2 positive area from an infected mouse. Scale bar: 500 μm.

Comparative permissiveness of various organs from B6.K18‐hACE2IP‐THV and B6.K18‐ACE22prlmn/Jax transgenic mice (n = 5–6/group) to SARS‐CoV‐2 replication, as determined at 3 dpi by conventional E‐specific or sub‐genomic Esg‐specific qRT‐PCR. Red lines indicate the qRT‐PCR limits of detection.
Comparative quantitation of hACE‐2 mRNA in the lungs and brain of B6.K18‐hACE2IP‐THV and B6.K18‐ACE22prlmn/Jax transgenic mice (n = 5–6/group).
Heatmaps represent log2‐fold change in cytokine and chemokine mRNA expression in the lungs or brain of B6.K18‐hACE2IP‐THV and B6.K18‐ACE22prlmn/Jax mice at 3 dpi (n = 5–6/group). Data were normalized versus untreated controls.

Timeline of prime‐boost LV::S vaccination and SARS‐CoV‐2 challenge in B6.K18‐hACE2IP‐THV mice (n = 6/group). The LVs used in this experiment were integrative.
Serum neutralization capacity of anti‐SCoV‐2 Abs in LV::S‐vaccinated mice compared with sham mice (n = 6/group).
Viral RNA content as determined in various organs at 3 dpi (n = 6/group) by use of conventional E‐specific or sub‐genomic Esg‐specific qRT‐PCR. Red lines indicate the qRT‐PCR detection limits.
Percentages of NK cells or neutrophils in the lungs of LV::S‐ or sham‐vaccinated and SARS‐CoV‐2‐challenged B6.K18‐hACE2IP‐THV transgenic mice at 3 dpi (n = 6/group). Percentages were calculated versus total lung live CD45+ cells.
Relative log2‐fold change in cytokine and chemokine mRNA expression in the brain of LV::S‐ or sham‐immunized and SARS‐CoV‐2‐challenged B6.K18‐hACE2IP‐THV transgenic mice at 3 dpi (n = 6/group). Means ± SD are shown. Data were normalized versus untreated controls.

Cytometric analysis of innate cell population and qRT‐PCR analysis of cytokines and chemokines in the lungs of LV::S‐ or sham‐vaccinated and SARS‐CoV‐2‐challenged B6.K18‐hACE2IP‐THV transgenic mice. Cytometric gating strategy to quantify various lung innate immune cells at 3 dpi. Cells were first gated on hematopoietic CD45+ cells and then by sequential gates, through three distinct paths.
Percentages of selected innate immune subsets versus total lung CD45+ cells were determined in individual mice (n = 6/group).
Heatmap representing log2‐fold change in cytokine and chemokine mRNA expression in the lungs of LV::S‐ or sham‐vaccinated mice at 3 dpi (n = 6/group). Data were normalized versus untreated controls. Statistical significance was evaluated by Mann–Whitney test (*P < 0.05, **P < 0.01, ns = not significant).

- A
Representative IFN‐γ response by lung CD8+ T cells of as studied at week 7 after in vitro stimulation with the indicated SCoV‐2‐derived peptides.
- B, C
Cytometric strategy to detect lung CD8+ T central memory (Tcm, CD44+CD62L+CD69−), T effector memory (Tem, CD44+CD62L−CD69−), and T resident memory (Trm, CD44+CD62L−CD69+CD103+) and (C) percentages of these subsets among CD8+ T cells in LV::S‐vaccinated (n = 9) or sham (n = 5) mice.
- D
Cytometric strategy to detect SCoV‐2‐specific CD8+ T cells by use of the H‐2Db‐SCoV‐2:538‐546 dextramer in the lungs of LV::S or sham‐vaccinated mice. Inside CD8+ dextramer+ T‐cell subset, Tcm, Tem, and Trm have been distinguished.
- E
Percentages of dextramer+ cells were calculated versus CD8+ T cells in both mouse groups and those of Tcm, Tem, and Trm were calculated versus dextramer+ CD44+ cells in LV::S‐vaccinated mice (n = 4/group). N/A = not applicable.
- F, G
Anti‐SCoV‐2 IgG or IgA titers (F) and neutralizing activity (EC50) (G) in the sera or lung homogenates at 3 dpi. Samples from individual mice (n = 4/group) were studied.
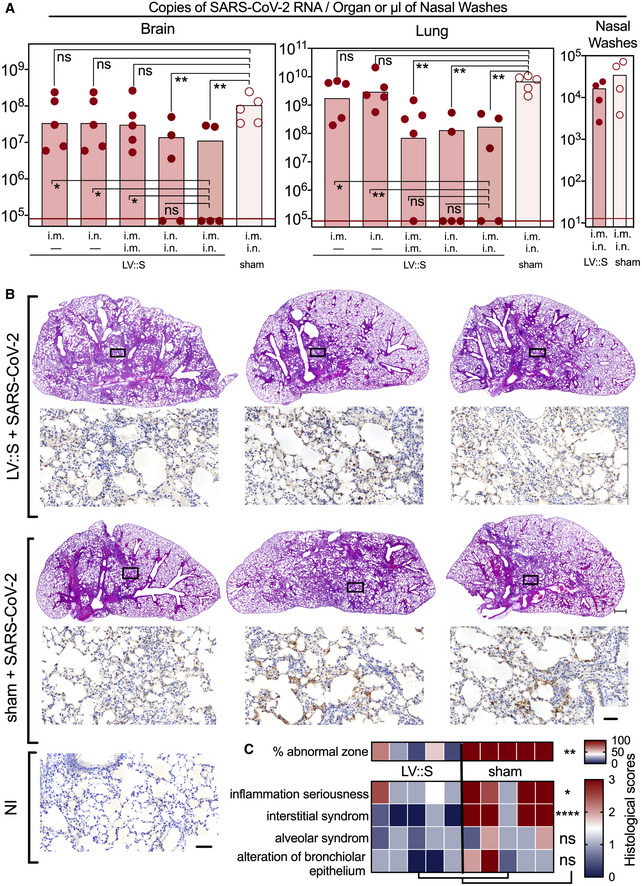
B6.K18‐hACE2IP‐THV mice were immunized with LV::S via i.m. or i.n. at week 0 and boosted via i.m. or i.n. at week 5 (n = 5/group) with non‐integrative LV::S. Control mice were injected i.m. i.n. with an empty LV (sham). Viral RNA contents were determined by conventional E‐specific RT‐PCR at 3 dpi, in the brain, lung, and nasal washes.
Lung histology in B6.K18‐hACE2IP‐THV mice, vaccinated with LV::S after SARS‐CoV‐2 inoculation. H&E (rows 1 and 3) (scale bar: 500 μm) and NCoV‐2‐specific IHC (rows 2 and 4) (scale bar: 50 μm) staining of whole‐lung sections (scale bar: 50 μm) from the primed (i.m.), boosted (i.n.), and challenged B6.K18‐hACE2IP‐THV mice compared with their sham controls. H&E and NCoV‐2‐specific IHC were performed on contiguous sections. The IHC fields correspond to the rectangles in the corresponding H&E images above them. A representative NCoV‐2‐specific IHC on a lung section from a non‐infected (NI) mouse is also shown.
Heatmap representing the histological scores for various parameters in LV::S‐vaccinated or sham mice at 3 dpi (n = 6/group).

- A
Example of CD3‐positive cells in an olfactory bulb from an LV::S i.m.‐i.n. vaccinated and protected mice and representative results from this group versus sham‐vaccinated and unprotected mice at 3 dpi (n = 7–9/group). Scale bar: 50 μm. Statistical significance was evaluated by Mann–Whitney test (**P < 0.01).
- B–D
Cytometric analysis of cells extracted from pooled olfactory bulbs from the same groups. (C, D) Innate immune cells in the olfactory bulbs (C) or brain (D). The CD11b+ Ly6C+ Ly6G+ population in the olfactory bulbs are neutrophils and the CD11b+ Ly6C+ Ly6G− cells of the brain are inflammatory monocytes.
- E
Brain H&E histology at 3 dpi. The top right and both bottom panels show examples, in two different mice, of leukocyte clusters (arrows) alongside the ventricular wall. No such clusters were detected in the LV::S i.m.‐i.n. vaccinated mice (top left panel). Scale bar: 200 μm. The close‐up view (bottom right panel) highlights the thickened, disorganized ependymal lining, compared to the normal ependymal cells and cilia of an LV::S i.m.‐i.n. vaccinated mouse (top left panel). Scale bar: 50 μm.

Timeline of LV::S i.m.‐i.n. immunization and challenge with SARS‐CoV‐2 Gamma in B6.K18‐hACE2IP‐THV mice (n = 5/group). The LVs used in this experiment were non‐integrative. Olfactory bulbs, brains, and lungs were collected at 3 dpi.
Brain or lung viral RNA contents, determined by conventional E‐specific or sub‐genomic Esg‐specific qRT‐PCR at 3 dpi. Two mice out of the 5 sham‐vaccinated mice did not have detectable viral RNA in the lungs despite high viral RNA content in the brain and hACE2 mRNA expression levels comparable to that of the other mice in the same group.
Neutralizing activity (EC50) of sera from individual LV::S‐vaccinated mice against pseudo‐viruses harboring SCoV‐2 from the ancestral strain or D614G, Alpha, Beta, or Gamma variants. Red asterisk indicates significance versus ancestral, blue asterisk indicates significance versus D614G variant, while orange asterisk indicates significance versus Alpha variant. Statistical comparisons were made at the respective boosting time point. In homologous settings, sera from mice immunized with LV::SBeta or LV::SGamma, fully inhibited pseudo‐viruses bearing S from Beta or Gamma, validating the assay for all pseudo‐viruses used.
Cytometric analysis of CD8+ T cells in pooled olfactory bulbs of LV::S i.m.‐i.n. vaccinated and protected mice versus sham‐vaccinated and unprotected mice.
Wild‐type or µMT KO mice (n = 5–9/group) were injected by LV::S or sham following the time line shown in (A), then pretreated with Ad5::hACE2 4 days before challenge with the ancestral SARS‐CoV‐2 strain. Lung viral RNA contents were determined at 3 dpi.
T‐splenocyte responses in LV::S‐primed and LV::S‐boosted C57BL/6 WT mice or sham controls (n = 3–5/group), evaluated by IFN‐γ ELISPOT using 15‐mer peptides encompassing SCoV‐2 MHC‐I‐restricted epitopes.

- A, B
H&E (rows 1 and 3) and NCoV‐2‐specific IHC (rows 2 and 4) staining of 3 dpi whole‐lung sections from B6.K18‐hACE2IP‐THV mice, LV::S‐, or sham‐vaccinated and challenged, following the time line in Fig 7A. H&E and IHC were performed on contiguous sections. Scale bar: 500 μm. The boxed area in the IHC images harbors NCoV‐2‐specific labeling, as exemplified at higher magnification in (B) Scale bar: 100 μm. They correspond to inflammatory infiltrates seen in the corresponding H&E‐stained sections.
- C
Representative images of NCoV‐2‐specific IHC staining of whole‐brain section in sham or LV::S‐vaccinated mice. Boxes highlight clusters of NCoV‐2 positive cells. Scale bar: 500 μm.
- D
An example of brain IHC signal at higher magnification and frequency of NCoV2 + cells in brains from vaccinated and sham animals. Scale bar: 100 μm. Numbers of NCov2 + cells per mm2 of brain were determined in individual mice (n = 5/group). Statistical significance was evaluated by Mann–Whitney test (**P < 0.01).
References
-
- Berth SH, Leopold PL, Morfini GN (2009) Virus‐induced neuronal dysfunction and degeneration. Front Biosci (Landmark Ed) 14: 5239–5259 - PubMed
MeSH terms
Substances
Supplementary concepts
Grants and funding
LinkOut - more resources
Full Text Sources
Other Literature Sources
Medical
Molecular Biology Databases
Miscellaneous
