. 2022 Jan 29;118(2):542-555.
doi: 10.1093/cvr/cvab322.

Cardiac SARS-CoV-2 infection is associated with pro-inflammatory transcriptomic alterations within the heart

Affiliations

Cardiac SARS-CoV-2 infection is associated with pro-inflammatory transcriptomic alterations within the heart

Hanna Bräuninger et al. Cardiovasc Res. .

Abstract

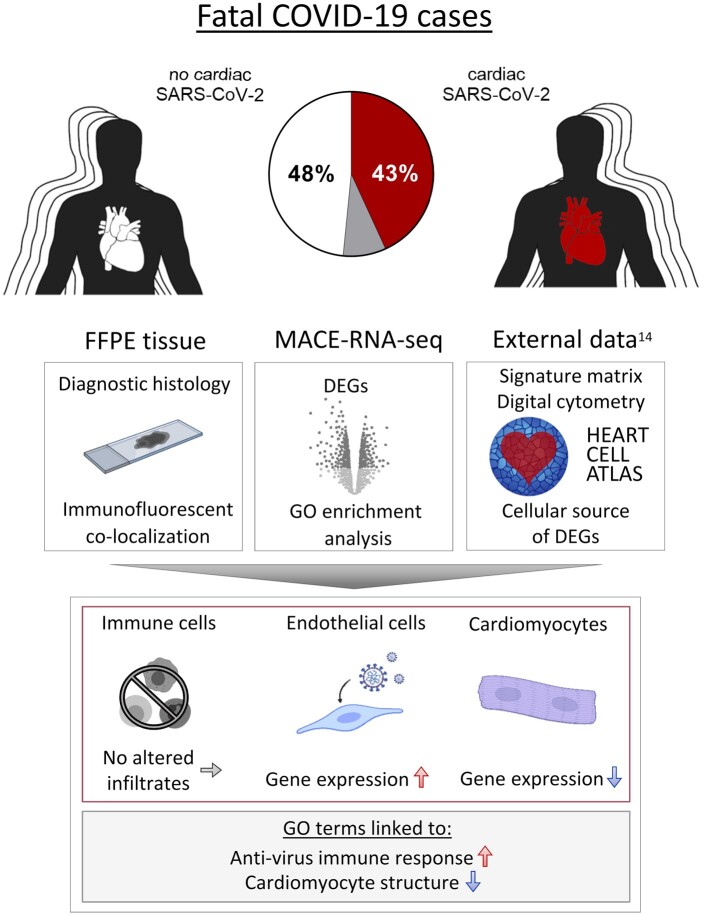
Aims: Cardiac involvement in COVID-19 is associated with adverse outcome. However, it is unclear whether cell-specific consequences are associated with cardiac SARS-CoV-2 infection. Therefore, we investigated heart tissue utilizing in situ hybridization, immunohistochemistry, and RNA-sequencing in consecutive autopsy cases to quantify virus load and characterize cardiac involvement in COVID-19.

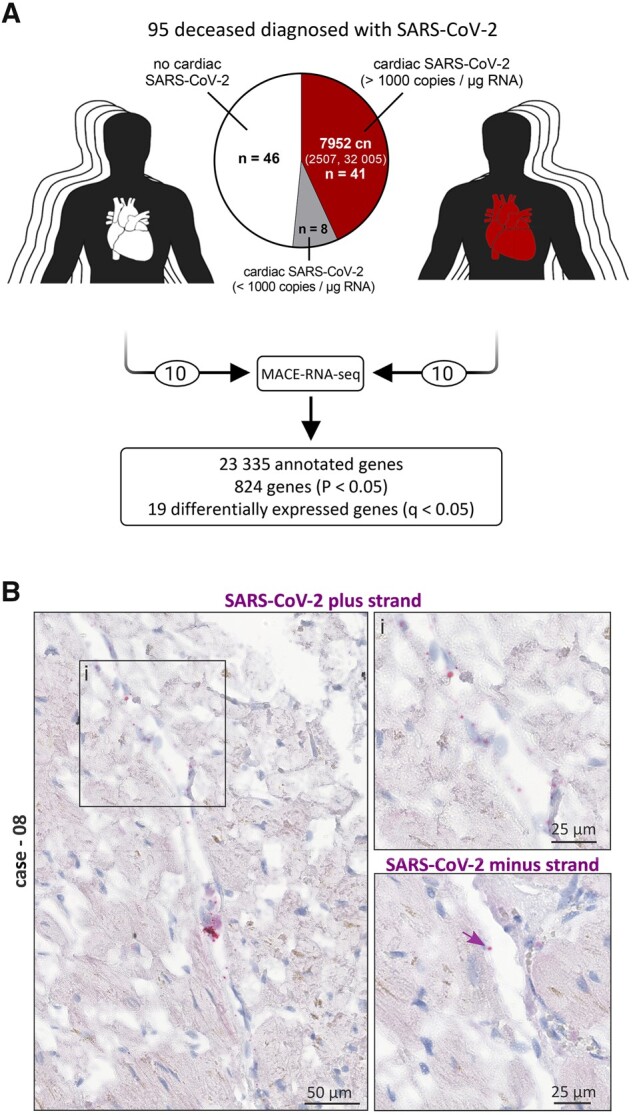
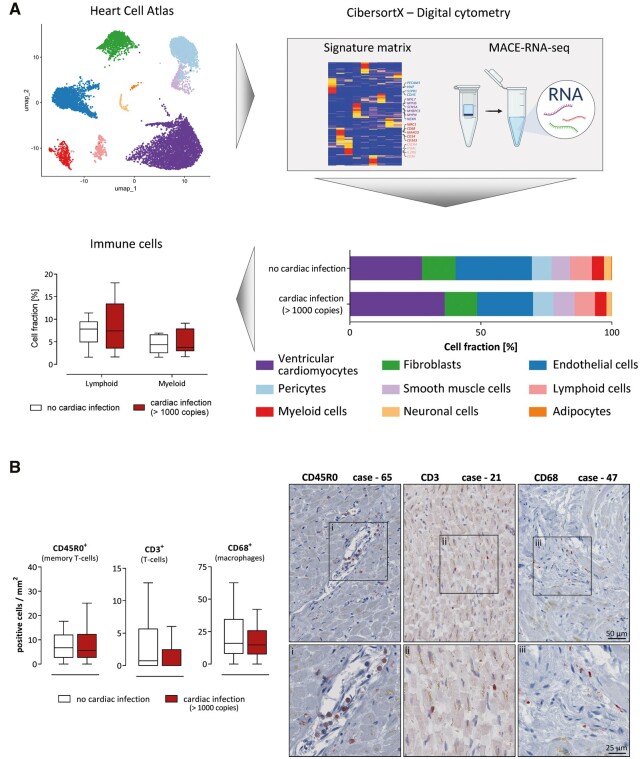
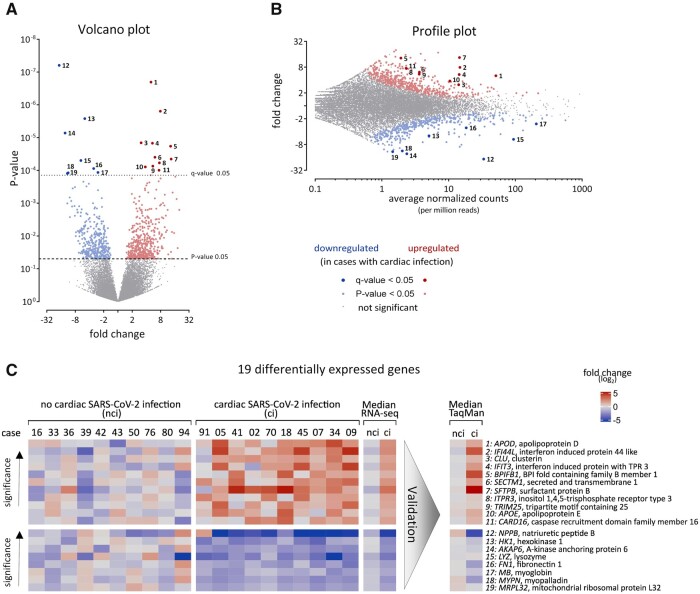
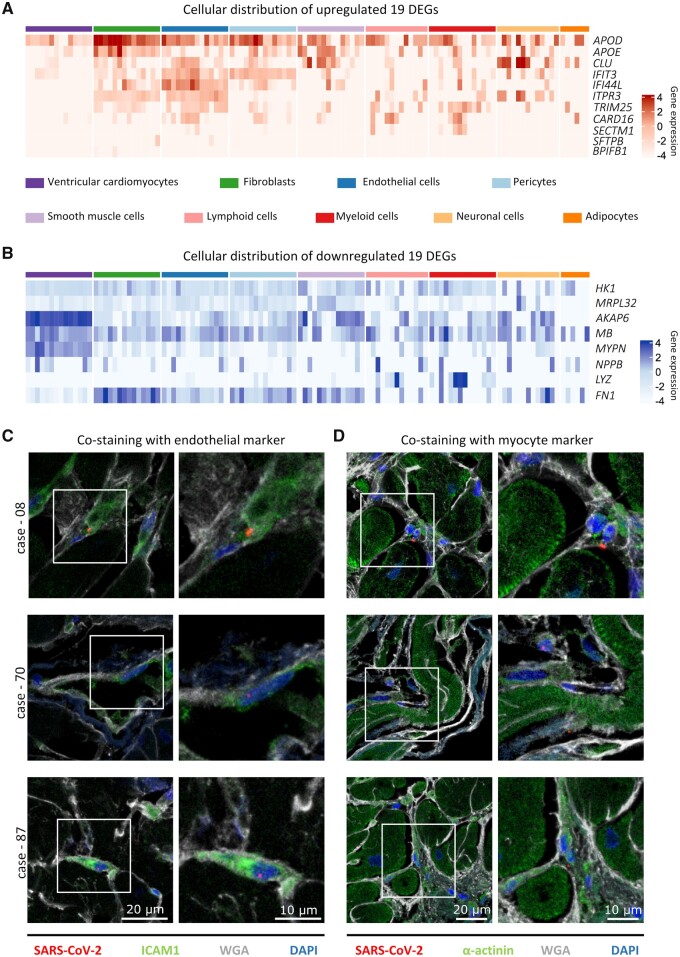
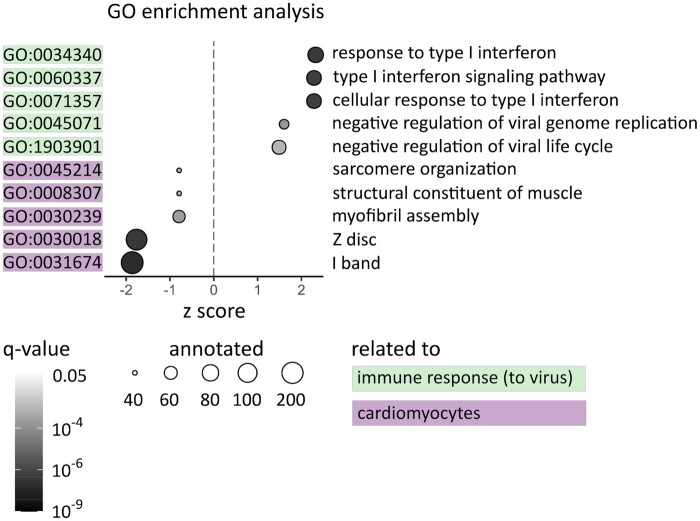
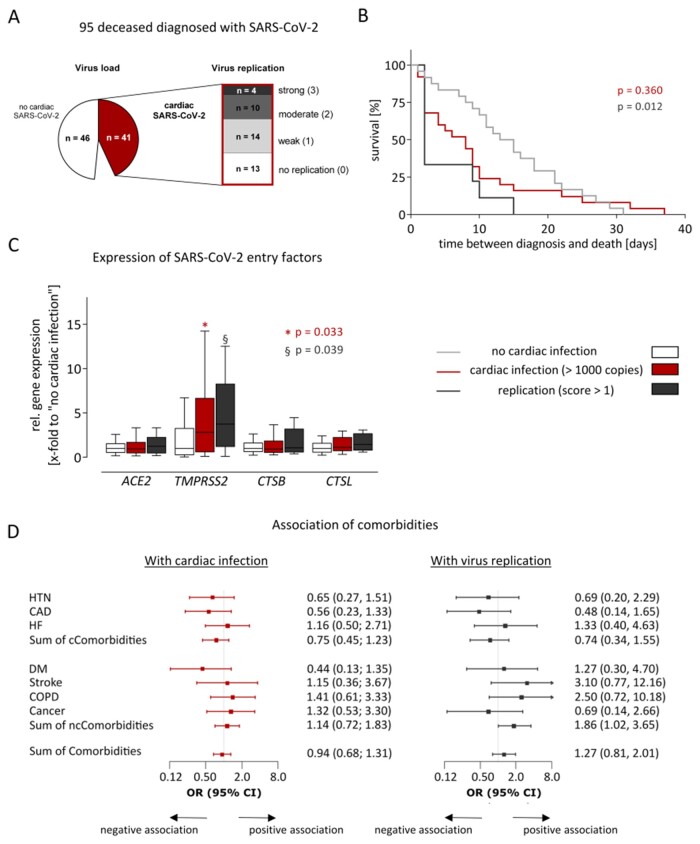
Methods and results: In this study, 95 SARS-CoV-2-positive autopsy cases were included. A relevant SARS-CoV-2 virus load in the cardiac tissue was detected in 41/95 deceased (43%). Massive analysis of cDNA ends (MACE)-RNA-sequencing was performed to identify molecular pathomechanisms caused by the infection of the heart. A signature matrix was generated based on the single-cell dataset 'Heart Cell Atlas' and used for digital cytometry on the MACE-RNA-sequencing data. Thus, immune cell fractions were estimated and revealed no difference in immune cell numbers in cases with and without cardiac infection. This result was confirmed by quantitative immunohistological diagnosis. MACE-RNA-sequencing revealed 19 differentially expressed genes (DEGs) with a q-value <0.05 (e.g. up: IFI44L, IFT3, TRIM25; down: NPPB, MB, MYPN). The upregulated DEGs were linked to interferon pathways and originate predominantly from endothelial cells. In contrast, the downregulated DEGs originate predominately from cardiomyocytes. Immunofluorescent staining showed viral protein in cells positive for the endothelial marker ICAM1 but rarely in cardiomyocytes. The Gene Ontology (GO) term analysis revealed that downregulated GO terms were linked to cardiomyocyte structure, whereas upregulated GO terms were linked to anti-virus immune response.

Conclusion: This study reveals that cardiac infection induced transcriptomic alterations mainly linked to immune response and destruction of cardiomyocytes. While endothelial cells are primarily targeted by the virus, we suggest cardiomyocyte destruction by paracrine effects. Increased pro-inflammatory gene expression was detected in SARS-CoV-2-infected cardiac tissue but no increased SARS-CoV-2 associated immune cell infiltration was observed.

Keywords: COVID-19; Cardiac infection; Cardiac signature matrix; MACE; RNA-seq; SARS-CoV-2.


Figures

None
Graphical abstract
Figure 1
Figure 1
Presence of SARS-CoV-2 in cardiac left ventricular tissue of fatal COVID-19 cases. (A) Presence of SARS-CoV-2 RNA was examined in the cardiac tissue of 95 SARS-CoV-2-positive deceased. Virus load in 1 µg RNA was quantified by reverse transcription followed by quantitative polymerase chain reaction (RT–PCR). Despite the SARS-CoV-2 diagnosis, 46 out of 95 cases revealed no SARS-CoV-2 in the cardiac tissue. A copy number >1000 copies per µg RNA in the heart was deemed as clinically relevant and was detected in 41 cases, while 8 cases did not exceed the relevant number and were therefore excluded from further analyses. Cases without cardiac infection are depicted in white, whereas cases with cardiac infection are depicted in red. The median copy number (cn) per µg RNA was 7952 (IQR: 2507–32 005). Virus load for each case individually is plotted as heatmap in Supplementary material online, Figure S1A. MACE-RNA-seq identified 19 differentially expressed genes (DEGs) comparing cardiac tissue with (n = 10) and without (n = 10) cardiac infection. (B) In situ hybridization was used to visualize SARS-CoV-2 RNA on tissue specimens. Hybridized probes are specific either for the plus strand representing the viral genome or the minus strand representing the intermediate strand for replication. Representative images of Case 08 are displayed. Negative and positive controls for chromogenic in situ hybridization are shown in Supplementary material online, Figure S2.
Figure 2
Figure 2
Cardiac SARS-CoV-2 infection was not associated with increased immune cell infiltration. (A) The previously published ‘Heart Cell Atlas’ served as single-cell RNA-sequencing dataset to generate a signature matrix using CibersortX from left ventricular tissue originated cells. Digital cytometry was performed, applying the generated signature matrix to our MACE-RNA-seq data by CibersortX. Cell fractions were estimated for each individual case. Comparing the immune cell fractions between cases with (n = 10) and without (n = 10) cardiac infection, no significant differences were determined using Mann–Whitney U test. Cell fractions are depicted as Tukey-style box plots with median and inter-quartile range without outliers. (B) The number of positively stained immune cells per mm2 is displayed. Cases without cardiac infections (n = 46) are depicted in white, whereas cases with cardiac infection (n = 41) are depicted in red. The patient groups were compared using Mann–Whitney U test revealing no significant differences. Data are depicted as Tukey-style box plots with median and inter-quartile range without outliers. Representative staining of immune cells in cardiac tissue is displayed. On the left panel, the CD45R0 staining for Case 65, quantified as 15.1 cells per mm2, is shown. The middle panel depicts the CD3 staining for Case 21 (7.4 cells/mm2). For Case 47, the CD68 staining is shown on the right panel (14.7 cells/mm2). Magnifications are displayed below for each case.
Figure 3
Figure 3
Identification of 19 differentially expressed genes (DEGs). Gene expression was analysed by MACE-RNA-seq in 10 cases with and 10 cases without cardiac infection. Downregulated genes in SARS-CoV-2-infected cardiac tissue are depicted in blue, while red highlights upregulated genes. FDR-adjusted P-value (q-value) revealed 19 DEGs. (A) Fold change and P-value are displayed in the volcano plot to visualize significant differences in gene expression; 11 upregulated and 8 downregulated DEGs were identified. Gene symbols and full names are displayed in (C) according to here depicted numbers. DEGs were calculated using DESeq2. (B) In the profile plot, fold change and average of normalized counts per 1 million reads are displayed. Red and blue colours highlight genes with P-value <0.05 (small dots) or q-value <0.05 (large dots). Gene symbols and full names are displayed in (C) according to here depicted numbers. (C) The 19 DEGs are displayed for each biological replicate separately. Gene symbols and full names are given. Gene expression is normalized to the mean of the group without cardiac infection and plotted as fold change (log2). As summary, median fold change of each DEG is plotted. Additionally, DEGs were validated using TaqMan analysis and the gene expression is plotted as median fold change (log2). Individual TaqMan values are plotted as heatmap in Supplementary material online, Figure S8. ci, cardiac infection; nci, no cardiac infection.
Figure 4
Figure 4
Cellular distribution of differentially expressed genes (DEGs) and cell-specific virus infection. (A and B) The cellular origin of the 19 DEGs was examined in healthy hearts of the published dataset ‘Heart Cell Atlas’. Log2 gene expression is plotted, separately for each donor, as the average expression of all cells within the same cell type. Note that data from lymphoid cells are available in 13 of 14 donors and adipocytes in 6 out of 14. (A) The gene expression of the upregulated DEGs is displayed. While APOD is highly expressed in most cell types, its weaker expression in cardiomyocytes is evident. A distinct cluster of the genes IFIT3, IFI44L, ITPR3, and TRIM25 is visible in endothelial cells. IFIT3 is also highly expressed in pericytes. (B) The gene expression of the downregulated DEGs is displayed. The genes AKAP6, MB, MYPN, and NPPB are forming a highly expressed cluster in cardiomyocytes. (C and D) Representative immunofluorescent staining on cardiac tissue from three different cases is depicted. For visualization of the tissue structure, cell membranes and fibrotic tissue are stained with wheat germ agglutinin (WGA, white). (C) Co-staining of SARS-CoV-2 nuclear protein (red) and the endothelial marker intercellular adhesion molecule 1 (ICAM1, green). In all depicted cases, the viral protein is localized within an ICAM1-positive cell. (D) SARS-CoV-2 nuclear protein (red) is not co-localized with α-actinin (green) in all representative cases, but can be found in small cells adjacent to cardiomyocytes.
Figure 5
Figure 5
Top regulated Gene Ontology (GO) terms are linked to cardiomyocytes and immune response. For each GO term, the gene ratio of regulated genes and annotated genes was calculated. Displayed are GO terms with a gene ratio >0.2 and a q-value <0.001. Whether the majority of genes in this term is up- or downregulated is indicated on the X-axis (z score). The q-value of the respective GO term is displayed by the colour gradient of the respective dot. The size of the dots represents the number of annotated genes. The GO terms are linked to immune response (green) or cardiomyocyte structure (purple). However, cardiomyocyte-specific GO terms are downregulated (negative z score), while GO terms linked to immune response are upregulated (positive z score).
Figure 6
Figure 6
Cardiac replication of SARS-CoV-2 was associated with accelerated death but not with comorbidities. (A) 95 fatal COVID-19 cases were included in this study, whereof 41 exceed a virus load of >1000 copies per µg RNA in the heart. In these cases, virus replication was examined, using a tagged minus strand-specific primer for reverse transcription followed by quantitative PCR of the tagged cDNA. Replication was scored according to the Ct-values (0: no replication/1: weak/2: moderate/3: strong). (B) Kaplan–Meier curves show time between diagnosis and death for cases grouped by cardiac infection and virus replication. Time between diagnosis and death is given by the interval between the first positive respiratory swab for SARS-CoV-2 and date of death. The compared groups were defined using information that was unknown before death. The groups with cardiac infection (red, n = 25) or replication (dark grey, n = 9) were compared to the group without cardiac infection (light grey, n = 26) utilizing log-rank test. To compare multiple survival curves, P-values were adjusted by the Hochberg correction. (C) Expression of four SARS-CoV-2 entry genes was determined using TaqMan analysis. Cases without cardiac infection (n = 46) are depicted in white, whereas cases with cardiac infection (n = 41) are depicted in red. Cases with cardiac infection were constricted to those with virus replication scores >1 (n = 14) and are depicted in dark grey. Gene expression is normalized to the median expression of the group without cardiac infection. Data are depicted as Tukey-style box plots with median and IQR without outliers. Both groups with cardiac infection were separately compared to the group without cardiac infection. Significant differences were determined using Mann–Whitney U test. A P-value <0.05 was considered statistically significant. (D) Comorbidities and cardiac infection (n = 41) or replication (n = 14) were fitted using univariate logistic regression models. Odds ratios (OR) and 95% confidence intervals (CI) were displayed as forest plots. The vertical line at an OR of one is the line of no effect. Due to graphical issues, the CI is clipped indicated by arrows. A P-value <0.05 was considered statistically significant, but was not reached for this analysis. The data availability for all variables is shown in Supplementary material online, Table S4. CAD, coronary artery disease; cCormobidites, cardiac Comorbidities; COPD, chronic obstructive pulmonary disease; DM, diabetes mellitus; HF, heart failure; HTN, hypertension; IQR, inter-quartile range; ncCormobidities, non-cardiac comorbidities.

References

    1. GBD 2017 Causes of Death Collaborators. Global, regional, and national age-sex-specific mortality for 282 causes of death in 195 countries and territories, 1980-2017: a systematic analysis for the Global Burden of Disease Study 2017. Lancet 2018;392:1736–1788. - PMC - PubMed
    1. WHO Solidarity Trial Consortium. Repurposed antiviral drugs for Covid-19—interim WHO solidarity trial results. N Engl J Med 2021;384:497–511. - PMC - PubMed
    1. RECOVERY Collaborative Group, Horby P, Lim WS, Emberson JR, Mafham M, Bell JL, Linsell L, Staplin N, Brightling C, Ustianowski A, Elmahi E, Prudon B, Green C, Felton T, Chadwick D, Rege K, Fegan C, Chappell LC, Faust SN, Jaki T, Jeffery K, Montgomery A, Rowan K, Juszczak E, Baillie JK, Haynes R, Landray MJ. Dexamethasone in hospitalized patients with COVID-19. N Engl J Med 2021;384:693–704. - PMC - PubMed
    1. Shao Z, Feng Y, Zhong L, Xie Q, Lei M, Liu Z, Wang C, Ji J, Liu H, Gu Z, Hu Z, Su L, Wu M, Liu Z. Clinical efficacy of intravenous immunoglobulin therapy in critical ill patients with COVID-19: a multicenter retrospective cohort study. Clin Transl Immunology 2020;9:e1192. - PMC - PubMed
    1. Puelles VG, Lutgehetmann M, Lindenmeyer MT, Sperhake JP, Wong MN, Allweiss L, Chilla S, Heinemann A, Wanner N, Liu S, Braun F, Lu S, Pfefferle S, Schroder AS, Edler C, Gross O, Glatzel M, Wichmann D, Wiech T, Kluge S, Pueschel K, Aepfelbacher M, Huber TB. Multiorgan and renal tropism of SARS-CoV-2. N Engl J Med 2020;383:590–592. - PMC - PubMed

Publication types