. 2021 Nov 8;49(19):11005-11021.
doi: 10.1093/nar/gkab864.

STAG2 loss-of-function affects short-range genomic contacts and modulates the basal-luminal transcriptional program of bladder cancer cells

Affiliations

STAG2 loss-of-function affects short-range genomic contacts and modulates the basal-luminal transcriptional program of bladder cancer cells

Laia Richart et al. Nucleic Acids Res. .

Abstract

Cohesin exists in two variants containing STAG1 or STAG2. STAG2 is one of the most mutated genes in cancer and a major bladder tumor suppressor. Little is known about how its inactivation contributes to tumorigenesis. Here, we analyze the genomic distribution of STAG1 and STAG2 and perform STAG2 loss-of-function experiments using RT112 bladder cancer cells; we then analyze the genomic effects by integrating gene expression and chromatin interaction data. Functional compartmentalization exists between the cohesin complexes: cohesin-STAG2 displays a distinctive genomic distribution and mediates short and mid-ranged interactions that engage genes at higher frequency than those established by cohesin-STAG1. STAG2 knockdown results in down-regulation of the luminal urothelial signature and up-regulation of the basal transcriptional program, mirroring differences between STAG2-high and STAG2-low human bladder tumors. This is accompanied by rewiring of DNA contacts within topological domains, while compartments and domain boundaries remain refractive. Contacts lost upon depletion of STAG2 are assortative, preferentially occur within silent chromatin domains, and are associated with de-repression of lineage-specifying genes. Our findings indicate that STAG2 participates in the DNA looping that keeps the basal transcriptional program silent and thus sustains the luminal program. This mechanism may contribute to the tumor suppressor function of STAG2 in the urothelium.


Figures

Figure 1.
Figure 1.
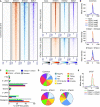
STAG1 and STAG2 show both overlapping and unique distributions over genomic elements and chromatin states in RT112 cells. (A) ChIP-Seq read density heatmaps for STAG1, STAG2, and SMC1 at common, STAG1-enriched (STAG1 > STAG2), and STAG2-enriched (STAG2 > STAG1) cohesin positions within a peak-centered 6kb window. (B) Read density distribution for STAG1 and STAG2 at common, STAG1-enriched, and STAG2-enriched positions within a peak-centered 6kb window. (C) Bar-plot diagram showing the distribution of common, STAG1-enriched, and STAG2-enriched cohesin positions over genomic elements. (D) Distribution of cohesin-bound genomic sites throughout chromatin states identified in RT112 cells by ChromHMM and based on combinations of histone modifications and CTCF (see Supplementary Figure S1C for definition of chromatin states). (E) Peak-centered enrichment plot for CTCF over the three categories of cohesin-bound positions showing relative depletion in STAG2-enriched sites.
Figure 2.
Figure 2.
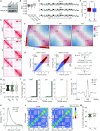
STAG2 loss in RT112 cells does not interfere with A/B compartments or TAD boundaries. (A) Western blot analysis of control (shNT) and STAG2-silenced RT112 cells showing efficient depletion of STAG2 at the protein level. (B) Reproducibility, measured by a stratum-adjusted correlation coefficient (SCC), between pair-wise comparisons of Hi-C datasets. (C) Hi-C matrices for chr2 at 500 kb resolution in cells transduced with control or STAG2-targeting shRNAs. The darker red reflects a greater frequency of interaction. (D) Compartment tracks for chr2 at 100 kb resolution as determined by the values of the first principal component (PC1) in control and STAG2-silenced cells. (E) Expression, as defined by RNA-Seq (log2 FPKM), of genes within compartments A and B. As expected, genes assigned to compartment A are more transcriptionally active than genes in compartment B. t-test: ***P < 0.001. (F) Compartmentalization saddle plots: average intra-chromosomal interaction frequencies between 200kb bins, normalized by expected interaction frequency based on genomic distance. Bins are sorted by their PC1 value derived from control cells Hi-C data. Preferential B-B interactions are in the upper left corner, and preferential A-A interactions are in the lower right corner. Numbers in corners represent the strength of AA interactions as compared to AB interactions and BB interactions over BA interactions. (G) Scatterplot of PC1 values of the eigenvectors of intrachromosomal interaction matrices for control and STAG2-silenced cells. The Venn diagrams show the overlap in terms of compartment-switching bins between sh1 and sh2. The number of genes mapped to genomic bins switching compartments is also indicated. Only one GO term is significantly enriched (FDR < 0.01) among genes switching from A to B: GO:0050907 (detection of chemical stimulus involved in sensory perception). (H) Effect of STAG2-depletion on the number of TADs per chromosome. Boxplot notches represent the confidence interval around the median. The number of total TADs is indicated below the boxplots. (I) Histograms depicting the strength of the TAD borders detected in control and STAG2-silenced cells, according to the TADbit score. (J) Average insulation profile around TAD boundaries (±600 kb) in control and STAG2-silenced cells. (K) Density plot depicting the distribution of TAD sizes identified in control and STAG2-silenced cells. (L) Hi-C normalized interaction matrices for chr2 at 100kb resolution comparing TAD organization in control and STAG2-silenced cells. (M) Effect of STAG2-depletion on conservation of TAD borders. Boxplot notches represent the confidence interval around the median.
Figure 3.
Figure 3.
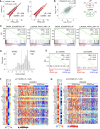
STAG2 depletion leads to deregulation of the basal/luminal transcriptional programs in RT112. (A) Scatter plots of expression values (FPKM) of genes in control versus STAG2-silenced cells. Statistically significant differentially expressed genes are highlighted in dark (FDR < 0.05) or light red (P < 0.05). (B) Scatter plot showing a positive and significant correlation between gene expression changes in sh1 and sh2 (left). Venn diagrams displaying the overlap between sh1 and sh2 in terms of significant up- and down-regulated genes. (C) GSEA enrichment plots of gene sets associated with the luminal and basal subtypes of muscle-invasive UBC showing significant deregulation in STAG2-silenced RT112 cells. (D) Distribution of STAG2 expression (FPKM) in the UROMOL cohort of 476 UBC samples (56), highlighting the thresholds of the first and fourth quartiles (119 samples per group). We defined ‘STAG2 high’ cases as those with expression values in the fourth quartile, and ‘STAG2 low’ cases as those with STAG2 levels in the first quartile. (E) GSEA enrichment plots for genes down-regulated in STAG2-silenced cells in ‘STAG2 high’ versus ‘STAG2 low’ tumor samples. (FG) Heatmaps displaying relative expression values (Z-score of FPKM) of genes significantly down-regulated in RT112 cells with sh1 (F) or sh2 (G) and in ‘STAG2 low’ versus ‘STAG2 high’ tumor samples.
Figure 4.
Figure 4.
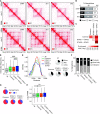
STAG2-enriched cohesin mediates short and mid-range contacts that engage actively transcribed genes. (A) Snapshots of coverage-normalized contact matrices at 25 kb (upper) and 50 kb (lower) resolution in control and STAG2-depleted cells illustrating the loss of short-ranged contacts and the formation of long-ranged contacts upon STAG2 silencing. The darker red reflects a greater frequency of interaction. Contact matrices were visualized in Juicebox (59). Below each contact matrix, the proportion of short (<250 kb), mid (250 kb–1 Mb) and long (>1 Mb) interactions for that genomic window is shown. (B) Proportion of short, mid and long interactions in control and STAG2-silenced cells. (C) Pairwise feature enrichment at the anchors of interactions overlapping cohesin-binding sites. (D) Interaction frequency of DNA contacts overlapping cohesin binding sites in control cells. (E) Left: density plot showing the distribution of genomic distances spanned by interactions overlapping cohesin binding sites in control cells. The distribution of genomic distances spanned by all interactions is included as control. Right: pie charts plotting the proportion of short (<250 kb), mid (250 kb–1 Mb), and long-ranged (>1 Mb) contacts among interactions overlapping cohesin binding sites. (F) Distribution of all and cohesin-overlapping interactions, in control cells, over genomic elements and (G) A/B compartments. (H) RNA-Seq expression values (log2 FPKM) of genes engaged by all or cohesin-overlapping interactions, in control cells. t-test: *P < 0.05; **P < 0.01.
Figure 5.
Figure 5.
STAG2 silencing is accompanied by rewiring of DNA contacts. (A) MD plots depicting the fold change in interaction frequency of DNA contacts in control (shNT) versus STAG2-silenced cells in relation to the linear distance between interacting regions for chromosome 15. Interactions showing statistically significant differences (adjusted P< 0.05) are highlighted in red (gained) or blue (lost). (B) Scatter plot comparing changes in interaction frequency between cells transduced with sh1 versus cells transduced with sh2. Gained and lost interactions are highlighted in red and blue, respectively. (C) Interaction frequency of lost and gained contacts in shNT and STAG2-silenced cells. (D) Distance between peaks of lost and gained DNA contacts. Gained interactions span longer distances than lost interactions. (E) Top four scoring motifs enriched in the subsets of interactions defined in C. For a more extensive list of significantly enriched motifs, see Supplementary Table S2. (F) Distribution of control, lost, and gained interactions over compartments and (G) chromatin states in RT112 cells (see Supplementary Figure S1C). (H) Left: chromatin contact network generated from the 20kb resolution Hi-C interaction map of control cells, showing in pink the nodes involved in contacts that are lost upon STAG2 silencing. Right: chromatin assortativity of nodes that lose contacts as the network is filtered eliminating contacts spanning short distances.
Figure 6.
Figure 6.
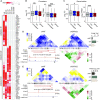
Rewiring of chromatin looping arising from loss of STAG2 results in transcriptional changes. (A) Heatmap representing the statistical significance (FDR) of motif analyses of promoters of differentially expressed genes and genomic positions involved in differential DNA looping in STAG2-silenced cells. We identify three collections of motifs: #1, motifs enriched in differential interactions; #2, motifs enriched in differentially expressed genes; and #3, motifs enriched in both interactions and transcriptionally deregulated genes. (B) Average fold change in gene expression values (FPKM) of genes engaged by control and differential interactions overlapping promoters or (C) gene bodies. Boxplot notches represent the confidence interval around the median. t-test: *P < 0.05; **P < 0.01; ***P < 0.001. (DE) Hi-C contact matrices at the TNC and COL17A1 loci in control and STAG2-silenced cells. The contact matrices for the STAG2-silenced condition are the result of averaging the matrices for sh1 and sh2. Snapshots of the ChIP-Seq tracks for STAG1 and STAG2, differential contact matrices, H3K27me3 peaks, and gene expression values (FPKM) are included. Loss of interactions overlapping the promoter of TNC and COL17A1 upon STAG2 silencing correlates with a consistent increase in gene expression. Error bars represent mean ± SEM.

References

    1. Lawrence M.S., Stojanov P., Mermel C.H., Robinson J.T., Garraway L.A., Golub T.R., Meyerson M., Gabriel S.B., Lander E.S., Getz G.. Discovery and saturation analysis of cancer genes across 21 tumour types. Nature. 2014; 505:495–501. - PMC - PubMed
    1. Romero-Pérez L., Surdez D., Brunet E., Delattre O., Grünewald T.G.P.. STAG mutations in cancer. Trends Cancer. 2019; 5:506–520. - PubMed
    1. Solomon D.A., Kim T., Diaz-Martinez L.A., Fair J., Elkahloun A.G., Harris B.T., Toretsky J.A., Rosenberg S.A., Shukla N., Ladanyi M.et al. .. Mutational inactivation of STAG2 causes aneuploidy in human cancer. Science. 2011; 333:1039–1043. - PMC - PubMed
    1. Balbás-Martínez C., Sagrera A., Carrillo-de-Santa-Pau E., Earl J., Márquez M., Vazquez M., Lapi E., Castro-Giner F., Beltran S., Bayés M.et al. .. Recurrent inactivation of STAG2 in bladder cancer is not associated with aneuploidy. Nat. Genet. 2013; 45:1464–1469. - PMC - PubMed
    1. Solomon D.A., Kim J.-S., Bondaruk J., Shariat S.F., Wang Z.-F., Elkahloun A.G., Ozawa T., Gerard J., Zhuang D., Zhang S.et al. .. Frequent truncating mutations of STAG2 in bladder cancer. Nat. Genet. 2013; 45:1428–1430. - PMC - PubMed

Publication types

MeSH terms