. 2021 Oct;10(12):e12157.
doi: 10.1002/jev2.12157.

Extracellular vesicles derived from the periodontal pathogen Filifactor alocis induce systemic bone loss through Toll-like receptor 2

Affiliations

Extracellular vesicles derived from the periodontal pathogen Filifactor alocis induce systemic bone loss through Toll-like receptor 2

Hyun Young Kim et al. J Extracell Vesicles. 2021 Oct.

Abstract

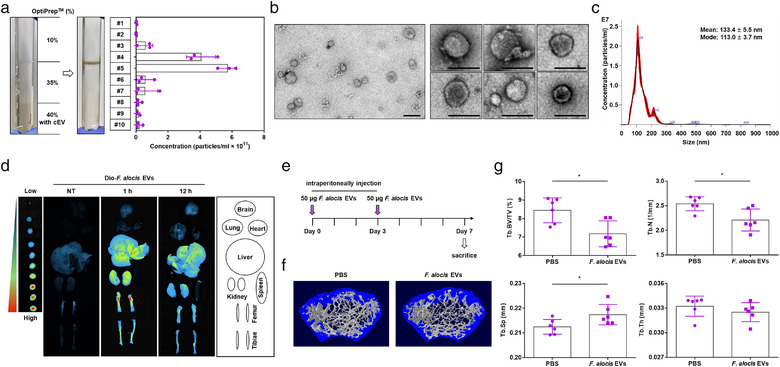
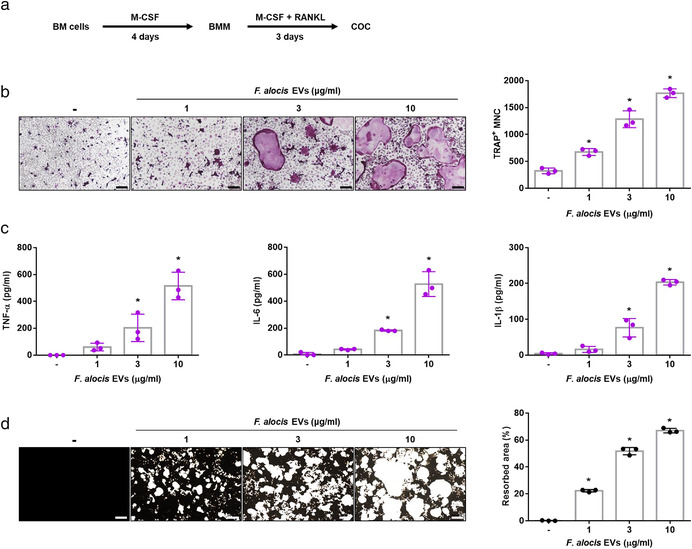
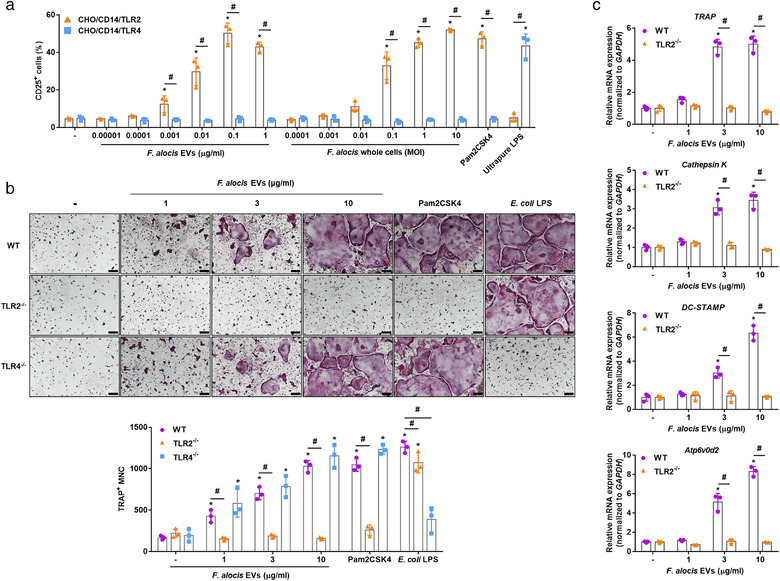
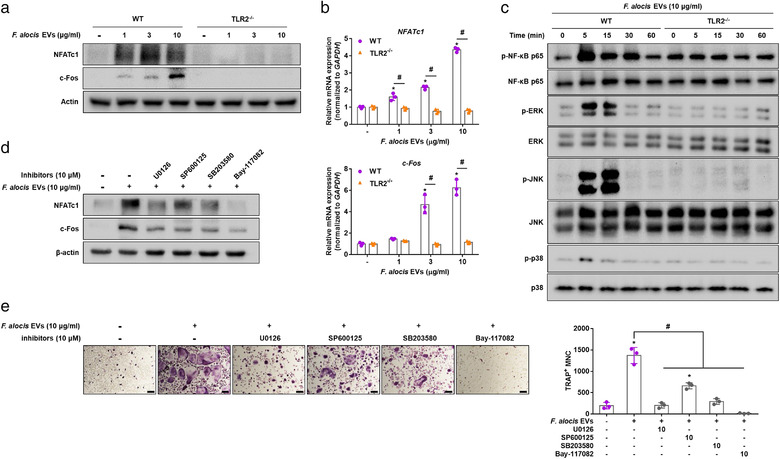
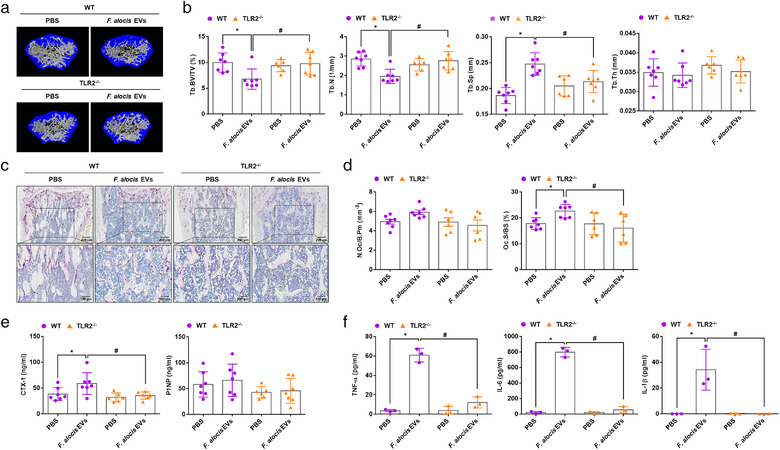
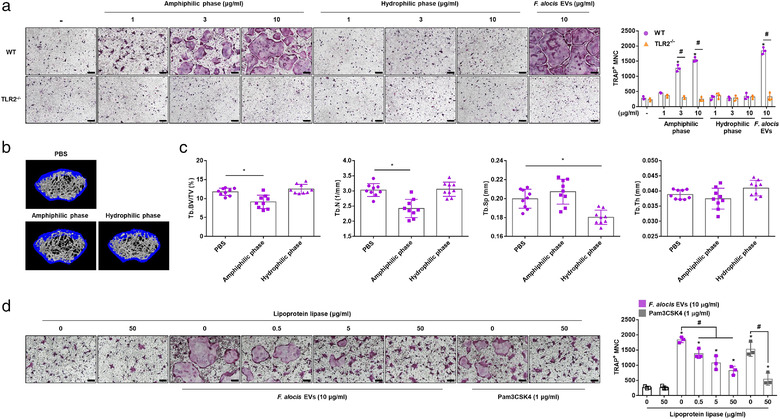
Periodontitis is an inflammatory disease induced by local infection in tooth-supporting tissue. Periodontitis is associated with systemic bone diseases, but little is known about the mechanism of the causal effect of periodontitis on systemic bone resorption. Bacteria-derived extracellular vesicles (EVs) act as natural carriers of virulence factors that are responsible for systemic inflammation. In this study, we investigated the role of EVs derived from Filifactor alocis, a Gram-positive, anaerobic periodontal pathogen, in systemic bone loss and osteoclast differentiation. F. alocis EVs accumulated in the long bones of mice after intraperitoneal administration. These EVs induced proinflammatory cytokines, osteoclastogenesis, and bone resorption via Toll-like receptor 2 (TLR2). The phase separation of F. alocis EVs showed that amphiphilic molecules were responsible for the induced bone resorption and osteoclastogenesis. The osteoclastogenic effects of F. alocis EVs were reduced by lipoprotein lipase. Proteomic analysis of the amphiphilic molecules identified seven lipoproteins. Our results indicate that lipoprotein-like molecules in F. alocis EVs may contribute to systemic bone loss via TLR2.

Keywords: TLR2; bacterial extracellular vesicles; bone resorption; lipoproteins; osteoclastogenesis.


Conflict of interest statement

The authors have no competing financial interests to declare.

Figures

FIGURE 1
FIGURE 1
Bone loss in long bones in response to F. alocis EVs. (a) Representative image of F. alocis EV purification by buoyant density gradient ultracentrifugation using the OptiPrep reagent. The number of particles from each gradient fraction (#1–10) was analysed by NTA using nanoparticle tracking analysis software/instrument. Data are shown as the mean values ± standard deviations of three biological replicates. Fractions #4 and #5 were pooled and subjected to the isolation of F. alocis EVs. (b) F. alocis EVs were examined under TEM at both 10,000× magnification (left panel, scale bar: 100 nm) and 25,000× magnification (right panel, scale bar: 100 nm). (c) Size distributions of F. alocis EVs (1:1000 diluted sample) were analysed by NTA using nanoparticle tracking analysis software/instrument. For the TEM and NTA analysis, representative data from at least three biological replicates are shown. (d) Eight‐week‐old male mice were administered DiO‐labeled F. alocis EVs (50 μg of protein) for the indicated time periods. The brain, lung, heart, liver, kidney, spleen, femur and tibiae were isolated, and the distributions of DiO‐labeled F. alocis EVs were determined by an in vivo imaging system. (e‐g) Eight‐week‐old male mice were administered F. alocis EVs (50 μg of protein) on Days 0 and 3. On Day 7, the femurs were isolated, and trabecular bone was analysed by μCT (PBS, and F. alocis EVs: n = 6). Representative 3D reconstruction images of femurs from PBS‐treated or F. alocis EV‐treated mice (f). Trabecular bone volume/total volume (Tb.BV/TV), trabecular number (Tb.N), trabecular separation (Tb.Sp), and trabecular thickness (Tb.Th) were calculated with the μCT analysis program (g, n = 6). The graphs are shown as the mean values ± standard deviations. Statistical significance was determined by two‐tailed Student's t‐test. Representative data are shown for at least three biological replicates. * < 0.05 compared to PBS group
FIGURE 2
FIGURE 2
Osteoclast differentiation and activation by F. alocis EVs. (a) Schematic overview of the preparation of COCs from BM cells. (b) COCs were stimulated with F. alocis EVs (1, 3, or 10 μg/ml of protein; 0.6 ×, 1.8 ×, or 6 × 10⁶ of EV particles/cell) in the presence of M‐CSF (30 ng/ml) for 2 days. Then, the cells were stained for TRAP activity, and the representative images of TRAP‐positive MNCs from triplicate samples are shown (left panel, scale bar: 200 μm). The number of TRAP‐positive MNCs was counted with triplicate samples (right panel). (c) COCs were stimulated with F. alocis EVs (1, 3, or 10 μg/ml of protein; 0.6 ×, 1.8 ×, or 6 × 10⁶ of EV particles/cell) in the presence of M‐CSF (30 ng/ml) for 24 h. TNF‐α, IL‐6, and IL‐1β in the culture supernatants from triplicate samples were analysed using ELISA. (d) COCs were cultured in calcium phosphate‐coated plates and stimulated with F. alocis EVs (1, 3, or 10 μg/ml of protein; 0.6 ×, 1.8 ×, or 6 × 10⁶ of EV particles/cell) in the presence of M‐CSF (30 ng/ml) for 10 days. Then, calcium phosphate was stained with Von Kossa reagents, and the representative images from triplicate samples are shown (left panel, Scale bar: 200 μm). The resorption area was measured from triplicate samples by ImageJ software (right panel). The graphs are shown as the mean values ± standard deviations. Representative data from three biological replicates are shown. Statistical significance was determined by one‐way ANOVA with Bonferroni's multiple comparison test. * < 0.05 compared to the nontreatment group. (‐) denotes the nontreatment group
FIGURE 3
FIGURE 3
TLR2 signalling in osteoclasts induced by F. alocis EVs. (a) CHO/CD14/TLR2 or CHO/CD14/TLR4 cells were stimulated with the indicated treatments for 24 h. The expression of the TLR activation marker CD25 was measured by flow cytometry. Pam2CSK4 (100 ng/ml) and ultrapure LPS (100 ng/ml) were used as positive controls for TLR2 and TLR4 activation, respectively. Data are shown as the mean values ± standard deviations of triplicate samples. (b) WT, TLR2–/–, and TLR4–/– COCs were stimulated with F. alocis EVs (1, 3, or 10 μg/ml of protein; 0.6 ×, 1.8 ×, or 6 × 10⁶ of EV particles/cell) in the presence of M‐CSF (30 ng/ml) for 2 days. Then, the cells were stained for TRAP activity, and the representative images of TRAP‐positive MNCs from triplicate samples are shown (upper panel, scale bar: 200 μm). The number of TRAP‐positive MNCs was counted with triplicate samples (lower panel). (c) WT and TLR2–/– COCs were stimulated with F. alocis EVs (1, 3, or 10 μg/ml of protein; 0.6 ×, 1.8 ×, or 6 × 10⁶ of EV particles/cell) in the presence of M‐CSF (30 ng/ml) for 12 h and subjected to real‐time RT‐PCR to determine the mRNA expression levels of osteoclastogenic markers (TRAP, Cathepsin K, DC‐STAMP, and Atp6v0d2). The expression of osteoclastogenic markers was normalized to the expression of GAPDH. Relative expression of the genes was quantified between the nontreatment and treatment groups from the mean value of triplicate samples. The graphs are shown as the mean values ± standard deviations. Representative data from three biological replicates are shown. Statistical significance was determined by two‐way ANOVA with Bonferroni's multiple comparison test. * < 0.05 compared to nontreatment group. # P < 0.05 compared to the indicated group. (‐) denotes the nontreatment group
FIGURE 4
FIGURE 4
Activation of transcription factors by F. alocis EVs in COCs. (a, b) WT and TLR2–/– COCs were stimulated with F. alocis EVs (1, 3, or 10 μg/ml of protein; 0.12 ×, 0.36 ×, or 1.2 × 10⁶ of EV particles/cell) in the presence of M‐CSF (30 ng/ml) for 12 h. The protein and mRNA expression levels of transcription factors (NFATc1 and c‐Fos) were measured by Western blotting (a) and real‐time RT‐PCR (b), respectively. (c) WT and TLR2–/– COCs were stimulated with F. alocis EVs (10 μg/ml of protein; 1.2 × 10⁶ of EV particles/cell) for the indicated times and subjected to Western blotting to determine the phosphorylation levels of NF‐κB, ERK, p38 and JNK. (d, e) COCs were pre‐treated with U0126, SB203580, SP600125 or Bay‐117082 for 1 h. Then, the cells were stimulated with F. alocis EVs (10 μg/ml of protein; 1.2 × 10⁶ of EV particles/cell) for 2 days. The protein expression levels of NFATc1 and c‐Fos were measured by Western blotting (d). The representative images of TRAP‐positive MNCs from triplicate samples are shown (e, left panel, scale bar: 200 μm). The number of TRAP‐positive MNCs was counted with triplicate samples (e, right panel). The graphs are shown as the mean values ± standard deviations. Representative data from the three biological replicates are shown. Statistical significances were determined by two‐way ANOVA with Bonferroni's multiple comparison test (b) or by one‐way ANOVA with Bonferroni's multiple comparison test (e). * < 0.05 compared to the nontreatment group. # P < 0.05 compared to the indicated group. (‐) denotes the nontreatment group
FIGURE 5
FIGURE 5
TLR2‐dependent bone resorption induced by F. alocis EVs. (a‐e) Eight‐week‐old male WT or TLR2–/– mice were intraperitoneally administered F. alocis EVs (50 μg of protein) on Days 0 and 3. On Day 7, the femurs were isolated, and trabecular bone was analysed by μCT. Representative 3D reconstruction images of femurs from PBS‐treated or F. alocis EV‐treated WT or TLR2–/– mice were obtained by μCT analysis (a). Tb.BV/TV, Tb.N, Tb.Sp, and Tb.Th were calculated by μCT analysis (b, n = 7 for WT‐PBS, WT‐F. alocis EVs, and TLR2–/–F. alocis EVs; n = 6 for TLR2–/–‐PBS). Decalcified femurs were embedded in paraffin, sectioned, and stained with haematoxylin and for TRAP (c). The number of osteoclast/bone parameter (N.Oc/B.Pm) and osteoclast surface/bone surface (Oc.S/BS) were measured in femoral sections (d, n = 7 for WT‐PBS and WT‐F. alocis EVs; n = 6 for TLR2–/–‐PBS and TLR2–/–F. alocis EVs). CTX‐1 and P1NP levels in mouse serum were analysed using ELISA (e). (f) Eight‐week‐old male mice (n = 3) were administered F. alocis EVs (50 μg of protein) for 3 h. TNF‐α, IL‐6, and IL‐1β in the serum were analysed using ELISA. The graphs are shown as the mean values ± standard deviations. Representative data from three biological replicates are shown. Statistical significance was determined by two‐way ANOVA with Bonferroni's multiple comparison test. * < 0.05 compared to the PBS group. # P < 0.05 compared to the indicated group
FIGURE 6
FIGURE 6
Bone resorption and osteoclastogenesis mediated by amphiphilic molecules in F. alocis EVs. (a) The WT and TLR2–/– COCs were stimulated with the indicated treatments in the presence of M‐CSF (30 ng/ml) for 2 days. Then, the cells were stained for TRAP activity, and representative images of TRAP‐positive MNCs from triplicate samples are shown (left panel, scale bar: 200 μm). The number of TRAP‐positive MNCs was counted with triplicate samples (right panel). (b, c) Eight‐week‐old male mice were administered the amphiphilic phase or hydrophilic phase (50 μg of protein) on Days 0 and 3. On Day 7, femurs were isolated, and trabecular bone was analysed by μCT. Representative 3D reconstruction images of femurs from PBS‐treated, amphiphilic phase‐treated or hydrophilic phase‐treated mice were analysed by μCT (b). Tb.BV/TV, Tb.N, Tb.Sp, and Tb.Th were calculated by μCT analysis (c, n = 9). (d) F. alocis EVs or Pam3CSK4 were incubated in the presence or absence of the indicated concentration of lipoprotein lipase at 37°C for 16 h. Then, COCs were stimulated with the indicated treatments in the presence of M‐CSF (30 ng/ml) for 2 days. Then, the cells were stained for TRAP activity, and representative images of TRAP‐positive MNCs from triplicate samples are shown (left panel, scale bar: 200 μm). The number of TRAP‐positive MNCs was counted with triplicate samples (right panel). The graphs are shown as the mean values ± standard deviations. Representative data from three biological replicates are shown. Statistical significance was determined by two‐way ANOVA with Bonferroni's multiple comparison test (a) or by one‐way ANOVA with Bonferroni's multiple comparison test (c, d). * < 0.05 compared to the nontreatment group. # P < 0.05 compared to the indicated group. (‐) denotes the nontreatment group

Similar articles

Cited by

References

    1. Armbruster, K. M. , & Meredith, T. C. (2018). Enrichment of bacterial lipoproteins and preparation of N‐terminal lipopeptides for structural determination by mass spectrometry. Journal of Visualized Experiments, 21(135), 56842. 10.3791/56842 - DOI - PMC - PubMed
    1. Armstrong, C. L. , Miralda, I. , Neff, A. C. , Tian, S. , Vashishta, A. , Perez, L. , Le, J. , Lamont, R. J. , & Uriarte, S. M. (2016). Filifactor alocis promotes neutrophil degranulation and chemotactic activity. Infection and Immunity, 84(12), 3423–3433. 10.1128/IAI.00496-16 - DOI - PMC - PubMed
    1. Aruni, A. W. , Roy, F. , & Fletcher, H. M. (2011). Filifactor alocis has virulence attributes that can enhance its persistence under oxidative stress conditions and mediate invasion of epithelial cells by Porphyromonas gingivalis . Infection and Immunity, 79(10), 3872–3886. 10.1128/Iai.05631-11 - DOI - PMC - PubMed
    1. Aruni, W. , Chioma, O. , & Fletcher, H. M. (2014). Filifactor alocis: The newly discovered kid on the block with special talents. Journal of Dental Research, 93(8), 725–732. 10.1177/0022034514538283 - DOI - PMC - PubMed
    1. Azuma, Y. , Kaji, K. , Katogi, R. , Takeshita, S. , & Kudo, A. (2000). Tumor necrosis factor‐α induces differentiation of and bone resorption by osteoclasts. Journal of Biological Chemistry, 275(7), 4858–4864. 10.1074/jbc.275.7.4858 - DOI - PubMed

Publication types

Substances

Supplementary concepts

LinkOut - more resources