. 2021 Nov 12;374(6569):868-874.
doi: 10.1126/science.abf7266. Epub 2021 Oct 14.

CD4+ T cells contribute to neurodegeneration in Lewy body dementia

Affiliations

CD4+ T cells contribute to neurodegeneration in Lewy body dementia

David Gate et al. Science. .

Abstract

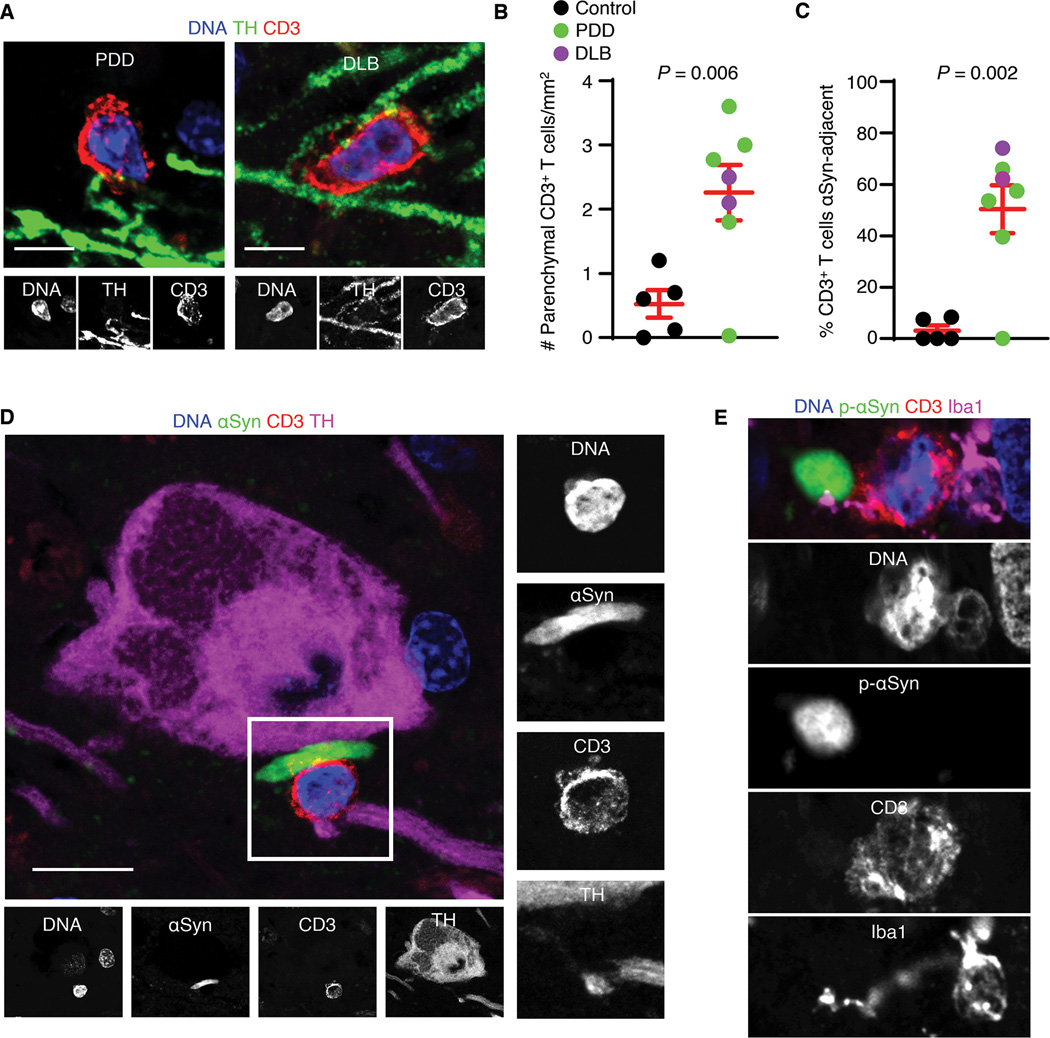
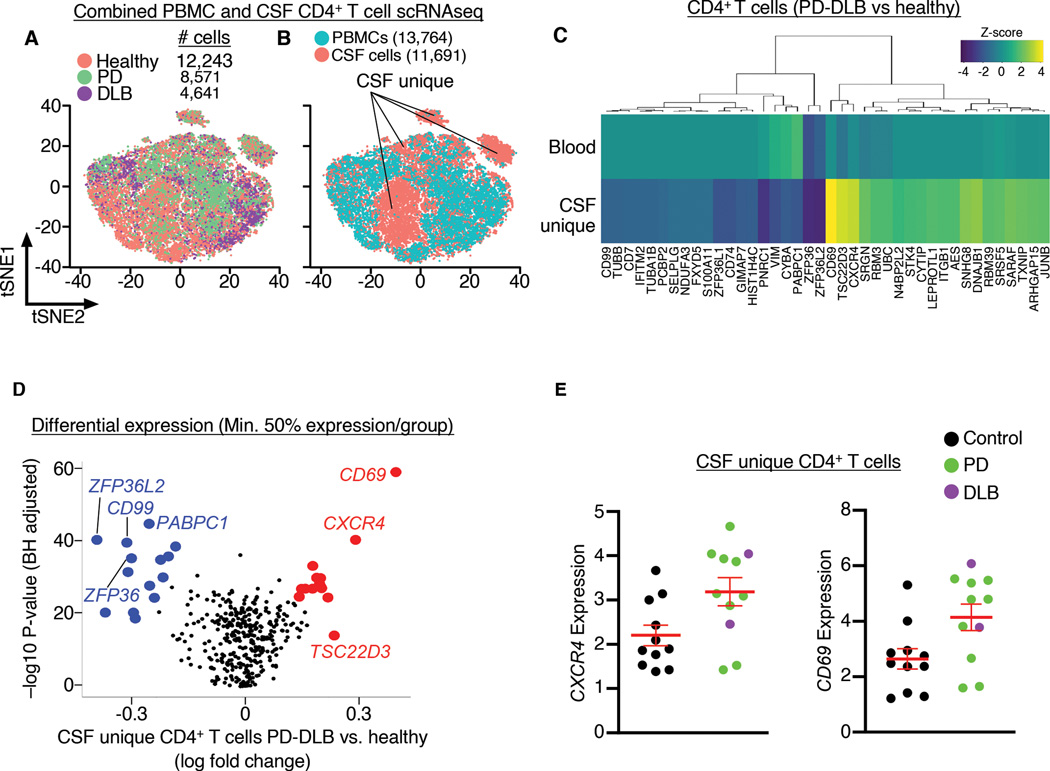
Recent studies indicate that the adaptive immune system plays a role in Lewy body dementia (LBD). However, the mechanism regulating T cell brain homing in LBD is unknown. Here, we observed T cells adjacent to Lewy bodies and dopaminergic neurons in postmortem LBD brains. Single-cell RNA sequencing of cerebrospinal fluid (CSF) identified up-regulated expression of C-X-C motif chemokine receptor 4 (CXCR4) in CD4+ T cells in LBD. CSF protein levels of the CXCR4 ligand, C-X-C motif chemokine ligand 12 (CXCL12), were associated with neuroaxonal damage in LBD. Furthermore, we observed clonal expansion and up-regulated interleukin 17A expression by CD4+ T cells stimulated with a phosphorylated α-synuclein epitope. Thus, CXCR4-CXCL12 signaling may represent a mechanistic target for inhibiting pathological interleukin-17–producing T cell trafficking in LBD.


Conflict of interest statement

Competing interests: K.L.P. has stock options and has received paid consulting fees from CuraSen Therapeutics, Inc.

Figures

Fig. 1.
Fig. 1.
T cells localize to dopaminergic neurons and α-synuclein deposits in the LBD brain. (A) Confocal images of parenchymal CD3+ T cells adjacent to TH+ neuronal processes in PDD and DLB substantia nigra. Scale bars = 10 μm. CD3+ T cells were detected in 6/7 LBD brains analyzed. (B) Quantification of parenchymal CD3+ T cells reveals higher numbers of T cells in LBD vs. healthy substantia nigra. Data are mean ± SEM. (C) Quantification of percent parenchymal CD3+ T cells adjacent to α-synuclein deposits in LBD brains. Cells determined to be adjacent to α-synuclein deposits were within 5μm distance. Data are mean ± SEM. (D) Confocal image of PDD substantia nigra showing a CD3+ T cell in close proximity to an α-synuclein+ Lewy neurite. Scale bar = 10 μm. Similar results were observed in 6/7 LBD brains. (E) An Iba1+ innate immune cell in the PDD substantia nigra. Note the Iba1+ process appearing to contact the CD3+ T cell and α-synuclein+ Lewy body in PDD. Scale bar = 5 μm. Similar results were observed in 6/7 LBD brains.
Fig. 2.
Fig. 2.
Upregulated CXCR4 demarks CD4+ T cells in PD-DLB. (A) scRNAseq of CSF cells shows clusters of various types of immune cells by tSNE. (B) Marker expression of CSF immune cells used to classify clusters. (C) UpSet plot showing cell-type specific analysis of differentially expressed genes of PD-DLB vs. healthy CSF immune cells indicating the highest number of differentially expressed genes in CD4+ T cells. (D) Volcano plot showing differentially expressed genes of CD4+ T cells from LBD vs. healthy CSF. Note the increased expression of CXCR4 in LBD. (E) scTCRseq of CSF immune cells showing clonal vs. non-clonal T cells plotted by tSNE. (F) Volcano plot of differential expression analysis of clonal CD4+ T cells showing increased expression of CD69, KLRB1 and CXCR4 in PD-DLB vs. healthy CSF. (G) Dot plot showing higher levels of CXCR4 and CD69 in PD-DLB vs. healthy CSF clonal CD4+ T cells.
Fig. 3.
Fig. 3.
CXCL12 is associated with neurodegeneration in LBD. (A) A PDD substantia nigra brain blood vessel showing localization of CXCL12 to the cerebral vasculature. Arrowheads indicate CD3+ T cells in the perivascular space. Asterisk indicates blood vessel lumen. Scale bar = 50 μm. Similar results were observed in 7/7 LBD brains. (B) Single molecule array measurement of CXCL12 indicating higher levels in PD vs. healthy CSF. Data are mean ± SEM. (C) Regression analysis correlating CSF CXCL12 and NEFL levels in healthy, PD-NCI and PDD. Note the significant correlation of CXCL12 and NEFL in PDD but not PD-NCI or healthy CSF.
Fig. 4.
Fig. 4.
CXCR4 demarks CD4+ T cells that are unique to the CSF in LBD. (A) tSNE plot showing overlayed distribution of peripheral versus CSF CD4+ T cells from healthy, PD and DLB subjects. (B) tSNE plot showing clusters of CD4+ T cells that are unique to the CSF. (C) Hierarchical clustering of standardized z-scores comparing PD-DLB to healthy CD4+ T cells from PBMCs and CSF. Note the clustering of genes CXCR4, CD69 and TSC22D3 that demark CSF unique CD4+ T cells. (D) Volcano plot showing differential expression analysis comparing PD-DLB to healthy CSF unique CD4+ T cells. (E) Quantification of individual subjects’ CXCR4 and CD69 expression of PD-DLB versus healthy CSF unique CD4+ T cells showing higher expression of each gene in PD-DLB. Data are mean ± SEM.
Fig. 5.
Fig. 5.
Stimulation of LBD T cells with α-synuclein promotes IL-17A expression. (A) Heatmap showing fold change of T cell activation (% HLA-DR+CD38+ CD3+ T cells) between unstimulated and stimulated PBMCs. Cells were incubated with α-synuclein peptides known to be antigenic. Note that peptide DNEAYEMPSEEGYQD (p129) increased T cell activation in patients #1 and #2. (B) Flow cytometry plots of unstimulated and DNEAYEMPSEEGYQD (p129)-stimulated cells showing increased T cell activation (% HLA-DR+CD38+ CD3+ T cells) by the α-synuclein peptide. (C) Histograms showing increased expression of CXCR4 in DNEAYEMPSEEGYQD (p129)-stimulated HLA-DR+CD38+CD4+ T cells in both patients by flow cytometry. (D) Differential expression analysis of stimulated vs. unstimulated HLA-DR+CD38+CD3+ T cells shows increased expression of antigen-dependent T cell activation genes ACTG1 and ACTB, the proliferative gene MKI67, and the pro-inflammatory cytokine IL17A. (E) tSNE plots indicating overlap of cells expressing IL17A and clonally expanded T cells (clonotypes) from both patients. (F) Confocal images of control (non-neurologic disease) and PDD post-mortem brains showing CD4+IL-17A+ T cells adjacent to an IL-17A+TH+ neuron in the PDD substantia nigra. Scale bar = 10 μm. (G) Quantification of IL-17A immunoreactivity (IR) in the substantia nigra of control and LBD brains showing increased IL-17A in LBD. Similar results were observed in 6/7 LBD brains. Data are mean ± SEM.

Comment in

References

    1. Armstrong MJ, Okun MS, Diagnosis and Treatment of Parkinson Disease: A Review. JAMA 323, 548–560 (2020). - PubMed
    1. Walker Z, Possin KL, Boeve BF, Aarsland D, Lewy body dementias. Lancet 386, 1683–1697 (2015). - PMC - PubMed
    1. Iba M. et al., Neuroinflammation is associated with infiltration of T cells in Lewy body disease and alpha-synuclein transgenic models. J Neuroinflammation 17, 214 (2020). - PMC - PubMed
    1. Lindestam Arlehamn CS et al., alpha-Synuclein-specific T cell reactivity is associated with preclinical and early Parkinson’s disease. Nat Commun 11, 1875 (2020). - PMC - PubMed
    1. Sulzer D. et al., T cells from patients with Parkinson’s disease recognize alpha-synuclein peptides. Nature 546, 656–661 (2017). - PMC - PubMed

MeSH terms