. 2021 Oct 15;374(6565):eabh2858.
doi: 10.1126/science.abh2858. Epub 2021 Oct 15.

Astrocyte Ca2+-evoked ATP release regulates myelinated axon excitability and conduction speed

Affiliations

Astrocyte Ca2+-evoked ATP release regulates myelinated axon excitability and conduction speed

Jonathan Lezmy et al. Science. .

Abstract

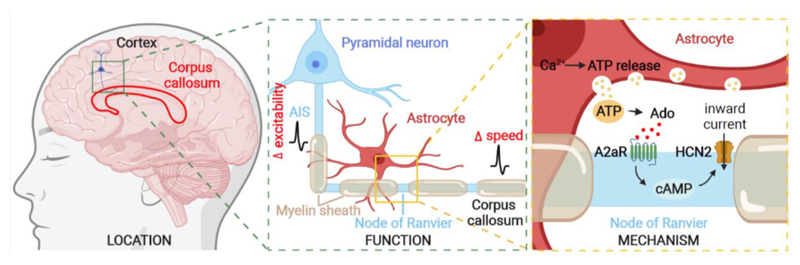
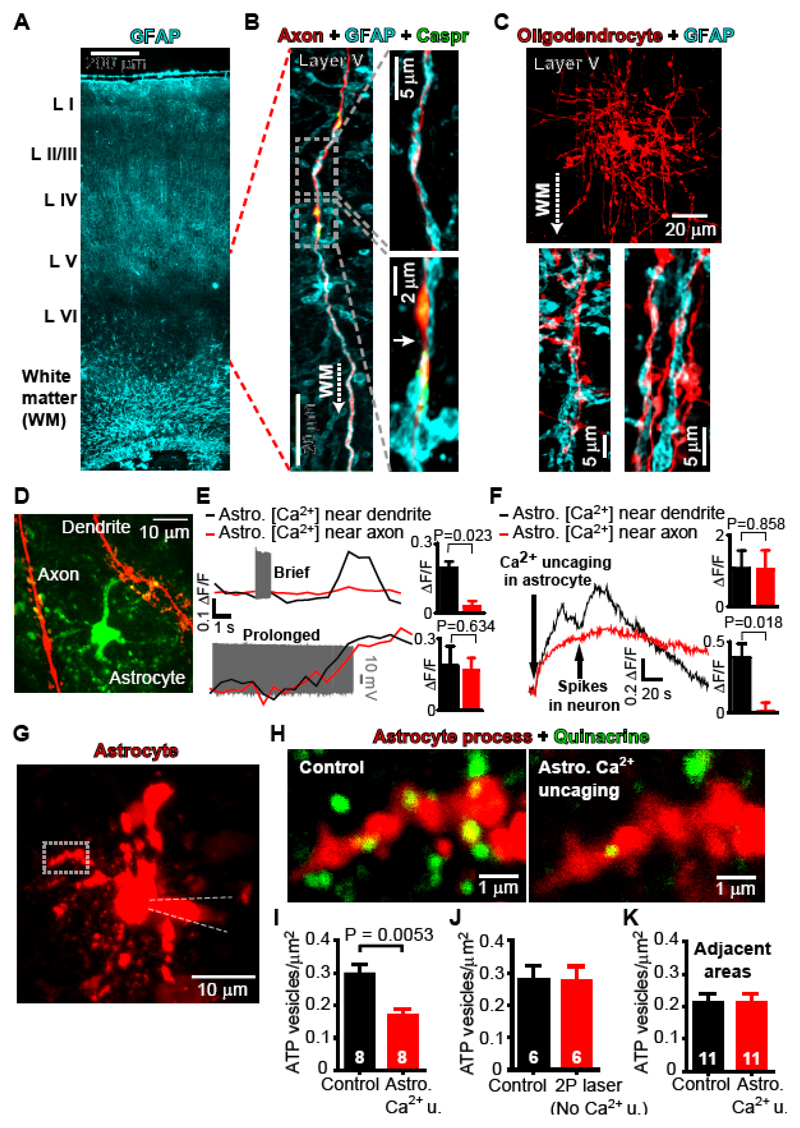
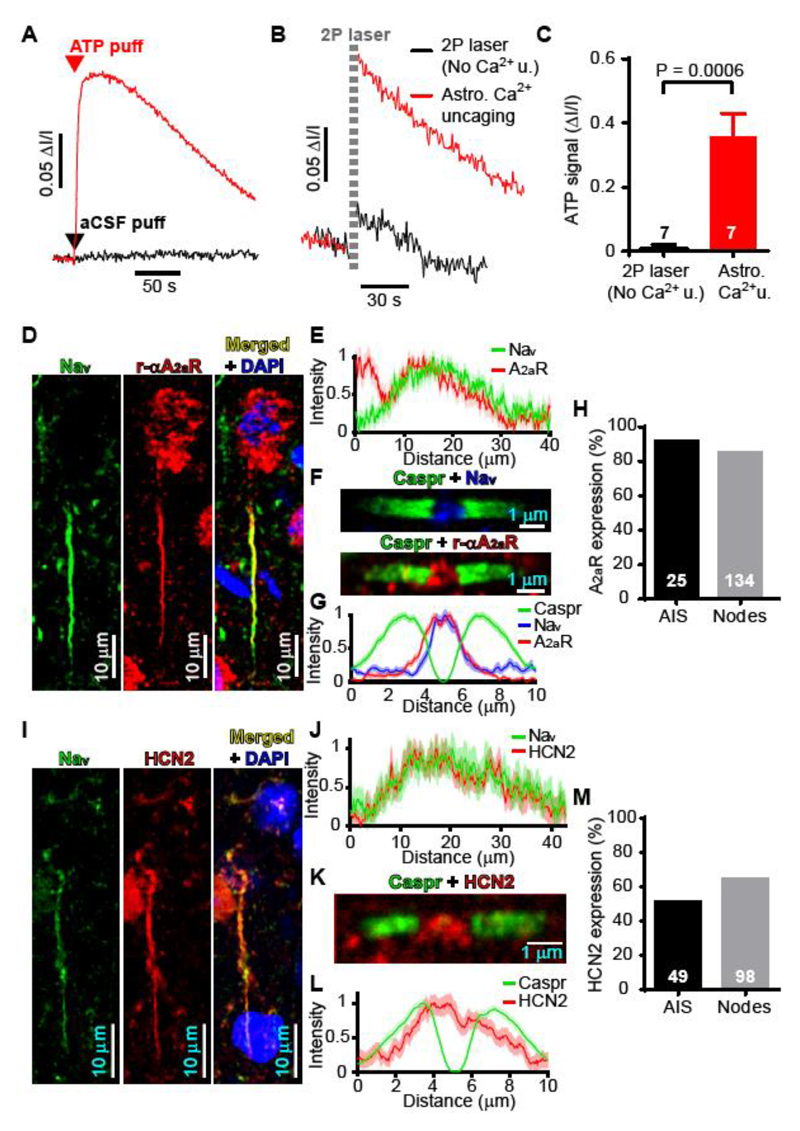
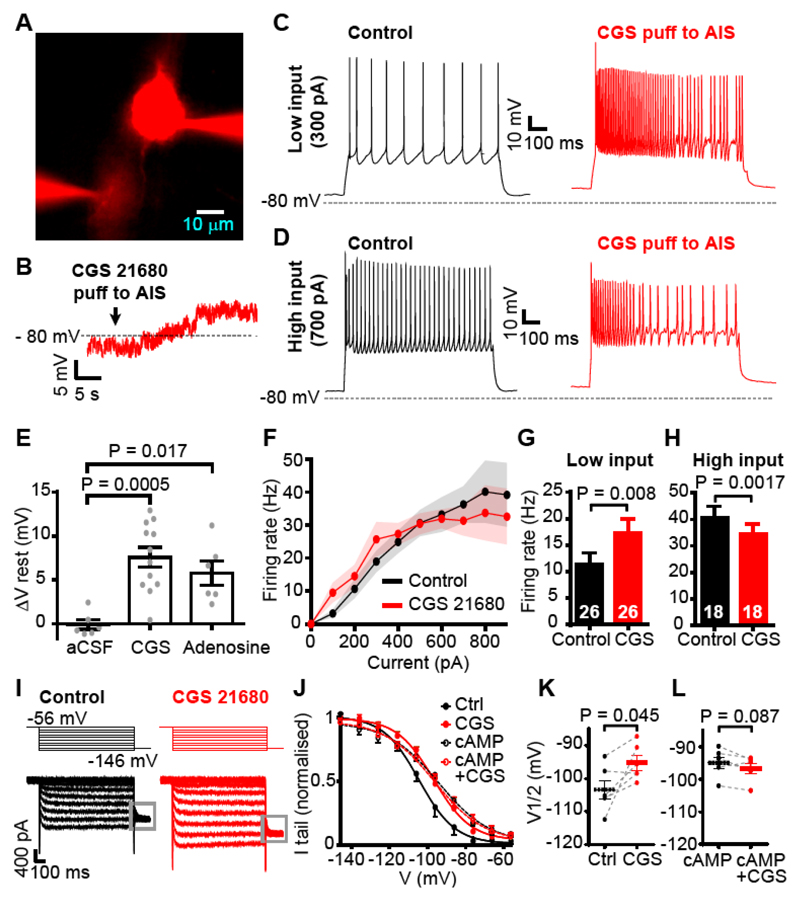
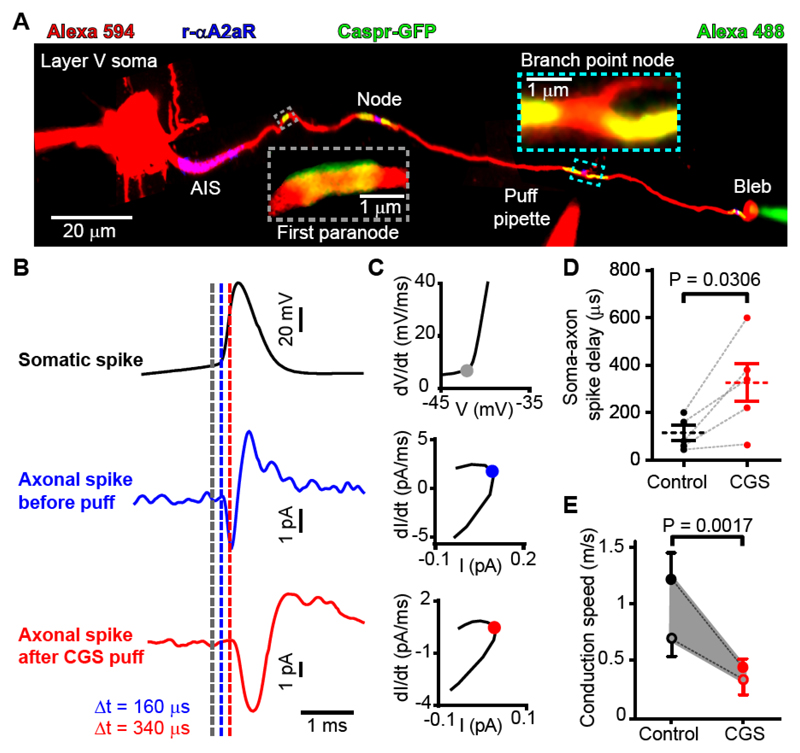
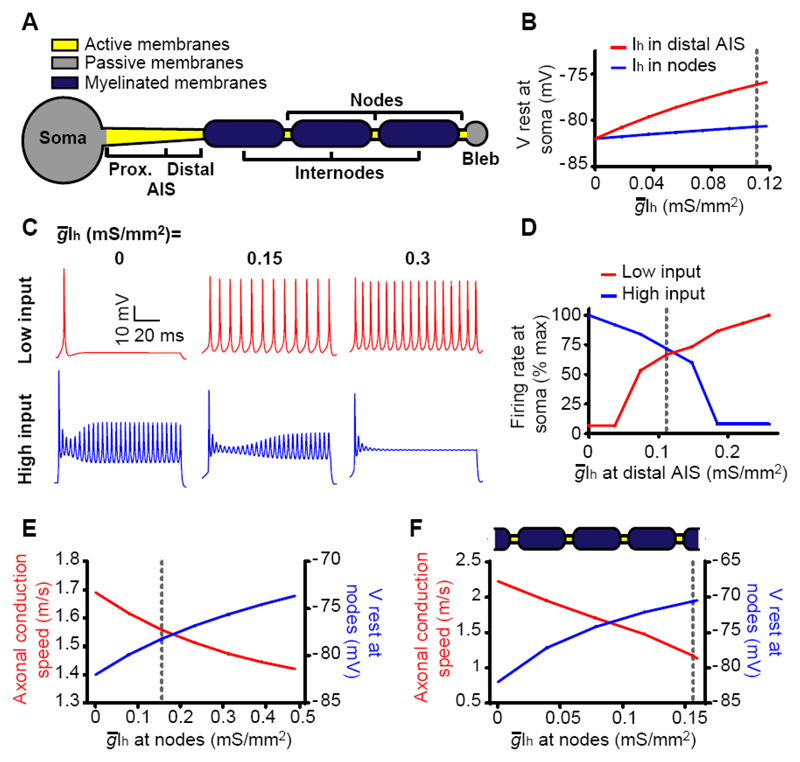
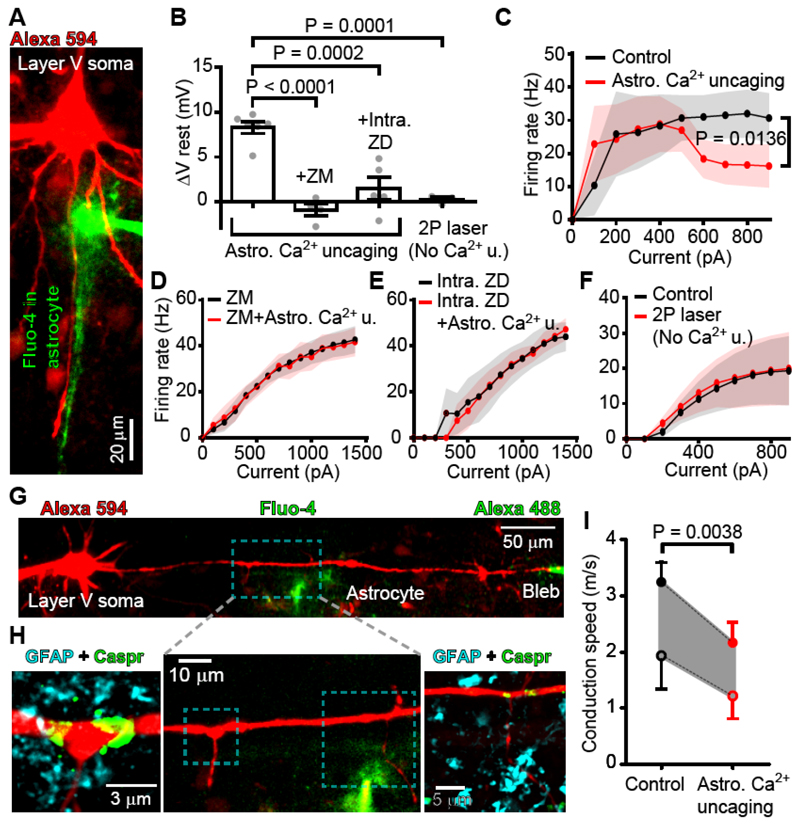
In the brain’s gray matter, astrocytes regulate synapse properties, but their role is unclear for the white matter, where myelinated axons rapidly transmit information between gray matter areas. We found that in rodents, neuronal activity raised the intracellular calcium concentration ([Ca2+]i) in astrocyte processes located near action potential–generating sites in the axon initial segment (AIS) and nodes of Ranvier of myelinated axons. This released adenosine triphosphate, which was converted extracellularly to adenosine and thus, through A2a receptors, activated HCN2-containing cation channels that regulate two aspects of myelinated axon function: excitability of the AIS and speed of action potential propagation. Variations in astrocyte-derived adenosine level between wake and sleep states or during energy deprivation could thus control white matter information flow and neural circuit function.


Conflict of interest statement

Competing interests

None.

Figures

None
Astrocytes regulate myelinated axon excitability and conduction speed.
For cortical neurons with myelinated axons crossing the corpus callosum (left), astrocytes regulate axon initial segment (AIS) excitability and axonal conduction speed (middle). Increases of astrocyte [Ca2+]i release ATP which, after conversion to adenosine (Ado) extracellularly, activates A2a receptors that raise the intracellular cyclic AMP concentration, and thus generate an inward current via HCN2 channels in the AIS and nodes of Ranvier (right). Created with BioRender.com.
Fig. 1
Fig. 1. Astrocyte processes near myelinated axons release ATP in response to [Ca2+]i rises.
(A) GFAP labeling of mouse coronal slice shows astrocytes in grey and white matter. (B) Patch-clamp loaded Alexa 594 labels axon of layer V pyramidal cell. Expanded internodal (top) and nodal (bottom, identified by Caspr labeling, node is at arrow) regions reveal astrocytes at both locations. (C) Patch-clamped oligodendrocyte in layer V with insets below showing GFAP labeling around myelinated internodes. (D) Dendrite and axon of patch-clamped rat layer V pyramidal cell near an astrocyte loaded with Ca2+ sensor Fluo-4. (E) [Ca2]i response in astrocyte processes near dendrite (black) and axon (red) to neuron depolarization with 500 pA for 1 sec (top, n=5) or 10 sec (bottom, n=3) to evoke spiking (grey). (F) [Ca2+]i response in astrocyte processes to Ca2+ uncaging and to brief neuronal spike trains (n=6). Top bar chart shows Ca2+ response just before spiking; bottom bar chart shows Ca2+ response following neuron spiking evoked by 500 pA for 1 sec. (G) Patch-clamped rat astrocyte loaded with Ca2+ cage NP-EGTA and Rhod-2 to measure [Ca2]i showing region imaged for H. (H) Quinacrine labeled puncta in astrocyte process are depleted on uncaging Ca2+ (Rhod 2 may not enter the smallest astrocyte processes, explaining why some puncta appear outside the astrocyte). (I-K) Quantification of ATP vesicles present per μm2 of astrocyte process: (I) before and after uncaging (Astro. Ca2+ u.); (J) before and after excitation that did not evoke a [Ca2]i rise in the astrocyte (No Ca2+ u.; see Fig. S2); (K) in regions outside the astrocyte (5 μm away) before and after uncaging. Numbers of processes shown on bars. Processes came from 12 cells. Panels A-C are on mice, D-K are on rats.
Fig. 2
Fig. 2. ATP release from astrocytes may target adenosine receptors on myelinated axons of layer V pyramidal neurons.
(A) Using luciferin-luciferase to detect ATP puffed into extracellular solution. (B) Response to 2-photon excitation uncaging Ca2+ in astrocytes evoked a luciferin-luciferase signal, unless the excitation failed to raise astrocyte [Ca2+]i (No Ca2+ u.; see Fig. S2). (C) Quantification of experiments in B in 7 cells. (D-H) A2aRs are present in the AIS (D) where they overlap with voltage-gated Na+ channel (Nav) expression (E, mean of 14 Nav and 25 A2aR profiles) and at the node of Ranvier (F) where they overlap with Nav and are flanked by Caspr labeling (G, mean of 48 Caspr, 48 A2aR and 24 Nav profiles). (H) Percentage of 25 AISs and 134 nodes that express A2aRs. (I-M) HCN2 channel subunits are present in the AIS (I) where they overlap with voltage-gated Na+ channel (Nav) expression (J, mean of 19 NaV and 16 HCN2 profiles) and at the node of Ranvier (K) where they overlap with Nav and are flanked by Caspr labeling (L, mean of 53 Caspr and HCN2 profiles). (M) Percentage of 49 AISs and 98 nodes that express HCN2. Panels A-E and I-J are on rats; F-G and K-L are on mouse; H and M combine rat AIS and mouse node data.
Fig. 3
Fig. 3. A2a receptors, via cAMP and Ih, modulate excitability at the AIS.
(A) Patch-clamped layer V pyramidal cells loaded with Alexa 594. Lower pipette puffing adenosine at distal AIS contains Alexa 594 to delineate region affected by adenosine. (B) Depolarization of soma evoked by puffing the A2aR agonist CGS 21680 (0.5 μM). (C-D) Voltage response to (C) 300 pA or (D) 700 pA injected current with and without CGS 21680 application. (E) Mean resting potential change when puffing aCSF (n=6), 0.5 μM CGS 21680 (n=12) or 100 μM adenosine (n=6) onto the AIS. (F) Firing rate averaged over 1 sec as a function of injected current, in control conditions or with CGS 21680 applied to the AIS (n=9; s.e.m. shown faint). (G-H) Firing rate change for (G) “low” (averaged over 100-300 pA, 26 current steps from 9 cells) or (H) “high” (700-900 pA, 18 current steps from 8 cells) input currents. (I) Specimen currents on stepping from -56 mV to various pulse potentials, and then to -136 mV to evoke tail currents allowing construction of the activation curve, in control conditions and with CGS 21680 puffed at the AIS. (J) Ih activation curves for normal conditions, puff application of CGS 21680 (n=6), and both of these with 50 μM cAMP included in the patch pipette (n=6). (K) V1/2 values (50% activation voltage of fitted Boltzmann curve) before (Ctrl) and during CGS 21680 application. (L) As in K, but with cAMP in patch pipette. All data are from rat.
Fig. 4
Fig. 4. A2a receptors in the node of Ranvier modulate conduction velocity.
(A) Myelinated axon in Thy1-Caspr-GFP mouse filled with Alexa 594 and patch-clamped at the cell soma and end-of-axon bleb. (B) Average of >100 evoked action potentials in the soma and bleb in control conditions and while puffing 0.5 μM CGS 21680 at a node of Ranvier. Dashed lines show times of initiation of action potential derived from threshold values of dV/dt and dI/dt (see text). (C) Phase plane plots showing times indicated on B (dots). (D) Response latency in bleb. (E) Conduction velocities derived making assumptions discussed in the main text (closed circles assume spike starts at the middle of the AIS and the forward speed is twice the backward speed; open circles assume spike starts at the end of the AIS and the forward speed is three times faster than the backward speed). Data in A-C are from mouse; data in D-E combine data from rats and mice (neither the initial speed nor the percentage change evoked by CGS 21680 differed significantly between rats and mice, p=0.43 and 0.15 respectively).
Fig. 5
Fig. 5. Computational modeling predicts the adenosine-evoked decrease of axonal conduction speed.
(A) Schematic diagram of the model of the experiment in Fig. 4. (B) Adding different densities of adenosine-sensitive maximal Ih conductance (g¯Ih) to the distal AIS evokes a larger soma depolarization than adding it to the nodes of Ranvier. Vertical dashed line shows measured maximal conductance (0.11 mS/mm2) (C) Voltage response at soma to injecting 20 pA (top row) or 180 pA (bottom row) with 3 different levels of g¯Ih added (as indicated) to the distal AIS. As observed experimentally (Fig. 3C-H) at low injected current the action potential frequency is increased; at high injected current it is decreased (owing to the simulated decrease of action potential amplitude, we defined an action potential as occurring if the voltage crossed -50 mV). (D) Firing rate as a function of g¯Ih for simulations as in C. (E) Action potential speed from the first to the last node in A, and average resting potential of the 3 nodes, as a function of g¯Ih added to each node (vertical dashed line shows the estimated physiological value of 0.1565 mS/mm2, see Materials and Methods). (F) Predictions of infinite axon model for conduction speed and node resting potential as a function of g¯Ih.
Fig. 6
Fig. 6. Ca2+ concentration rises in astrocytes regulate pyramidal cell excitability and axonal conduction speed.
(A) A patch-clamped L5 pyramidal neuron (with Alexa 594 in the left pipette, red) and a periaxonal astrocyte filled with the Ca2+ cage NP-EGTA and Fluo-4 (right pipette, green). [Ca2+]i rises in astrocyte processes near the axon (see movie S3). (B) Resting potential (Vrest) depolarized following astrocyte Ca2+ uncaging, but not when blocking A2aRs with superfused ZM 241385 (100 nM) or Ih channels with ZD7288 (20 μM in the pipette), nor when 2-photon laser excitation failed to raise [Ca2+]i (No Ca2+ u.; see Fig. S2) (Astro. Ca2+ uncaging: n=6, +ZM: n=4, +Intra. ZD: n=5, 2P laser without uncaging: n=3; one-way ANOVA p<0.0001). (C) Neuronal firing rate evoked by injecting 1 s current steps in 100 pA increments before (black) and after astrocytic Ca2+ uncaging (red). (D-F) As in C but with ZM 241385 (D, n=4), or ZD7288 (E, n=4), or with illumination that failed to uncage Ca2+ (F, n=3). (G) Live imaging of a L5 pyramidal neuron patch-clamped at the soma (left pipette, loading red Alexa 594) and the axon end (right pipette, green). A perinodal astrocyte (near axon branches) was patch-filled with NP-EGTA and Fluo-4. (H) Middle: high resolution image of the dashed box in G. Left and right images show the areas in the dashed boxes of the middle image, after immunostaining for GFAP and Caspr. Nodes flanked by Caspr (green) are close to GFAP-positive astrocyte processes (cyan). (I) Estimated axonal conduction speed before and after astrocyte Ca2+ uncaging (see text associated with Fig. 4E for assumptions made). Data in panels A-H are from rat; panel I combines data from rats and mice (neither the initial speed nor the percentage change evoked by Ca2+ uncaging differed significantly between rats and mice, p=0.08 and 0.93 respectively).

References

    1. Allen NJ. Astrocyte regulation of synaptic behavior. Ann Rev Cell Dev Biol. 2014;30:439–463. - PubMed
    1. Kole MHP, Ilschner SU, Kampa BM, Williams SR, Ruben PC, Stuart GJ. Action potential generation requires a high sodium channel density in the axon initial segment. Nat Neurosci. 2008;11:178–186. - PubMed
    1. Larson VA, Mironova Y, Vanderpool KG, Waisman A, Rash JE, Agarwal A, Bergles DE. Oligodendrocytes control potassium accumulation in white matter and seizure susceptibility. eLife. 2018;7:e34829. - PMC - PubMed
    1. Saab AS, Tzvetanova ID, Nave K-A. The role of myelin and oligodendrocytes in axonal energy metabolism. Curr Opin Neurobiol. 2013;23:1065–1072. - PubMed
    1. french-Constant C, Miller RH, Kruse J, Schachner M, Raff MC. Molecular specialization of astrocyte processes at nodes of Ranvier in rat optic nerve. J Cell Biol. 1986;102:844–852. - PMC - PubMed

Publication types