. 2021 Nov 12;374(6569):eabj1541.
doi: 10.1126/science.abj1541. Epub 2021 Nov 12.

Mapping the proteo-genomic convergence of human diseases

Affiliations

Mapping the proteo-genomic convergence of human diseases

Maik Pietzner et al. Science. .

Abstract

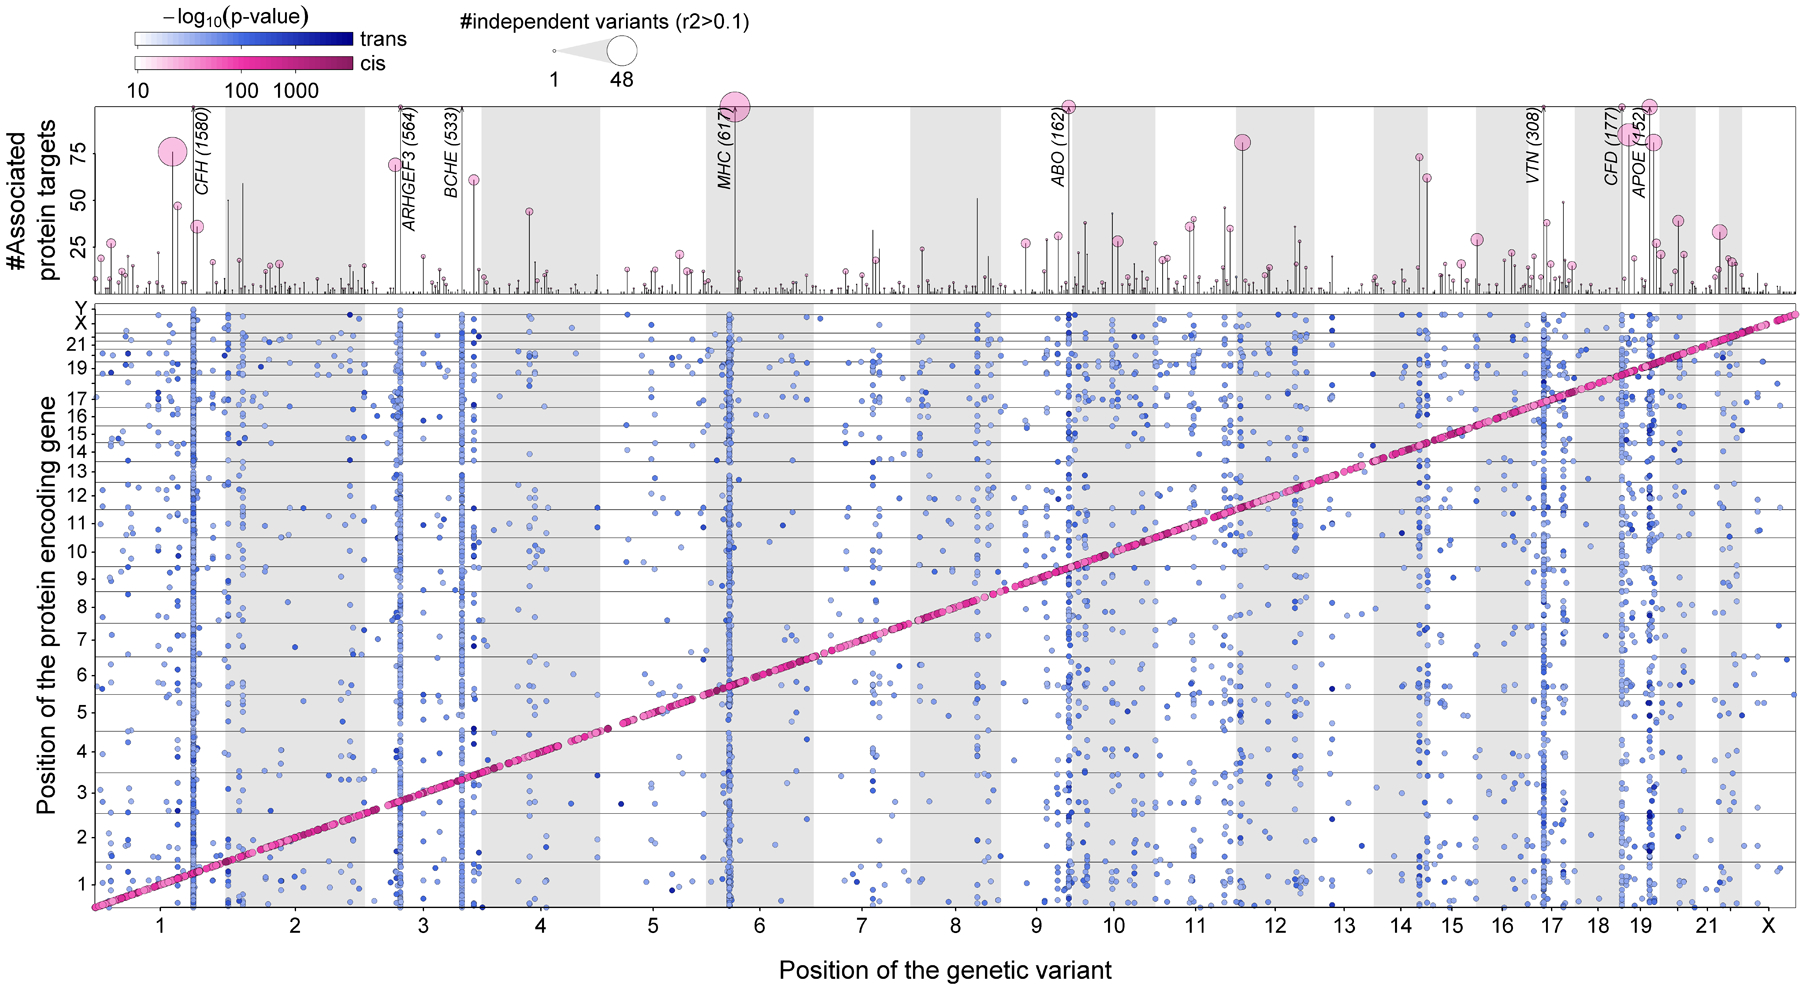
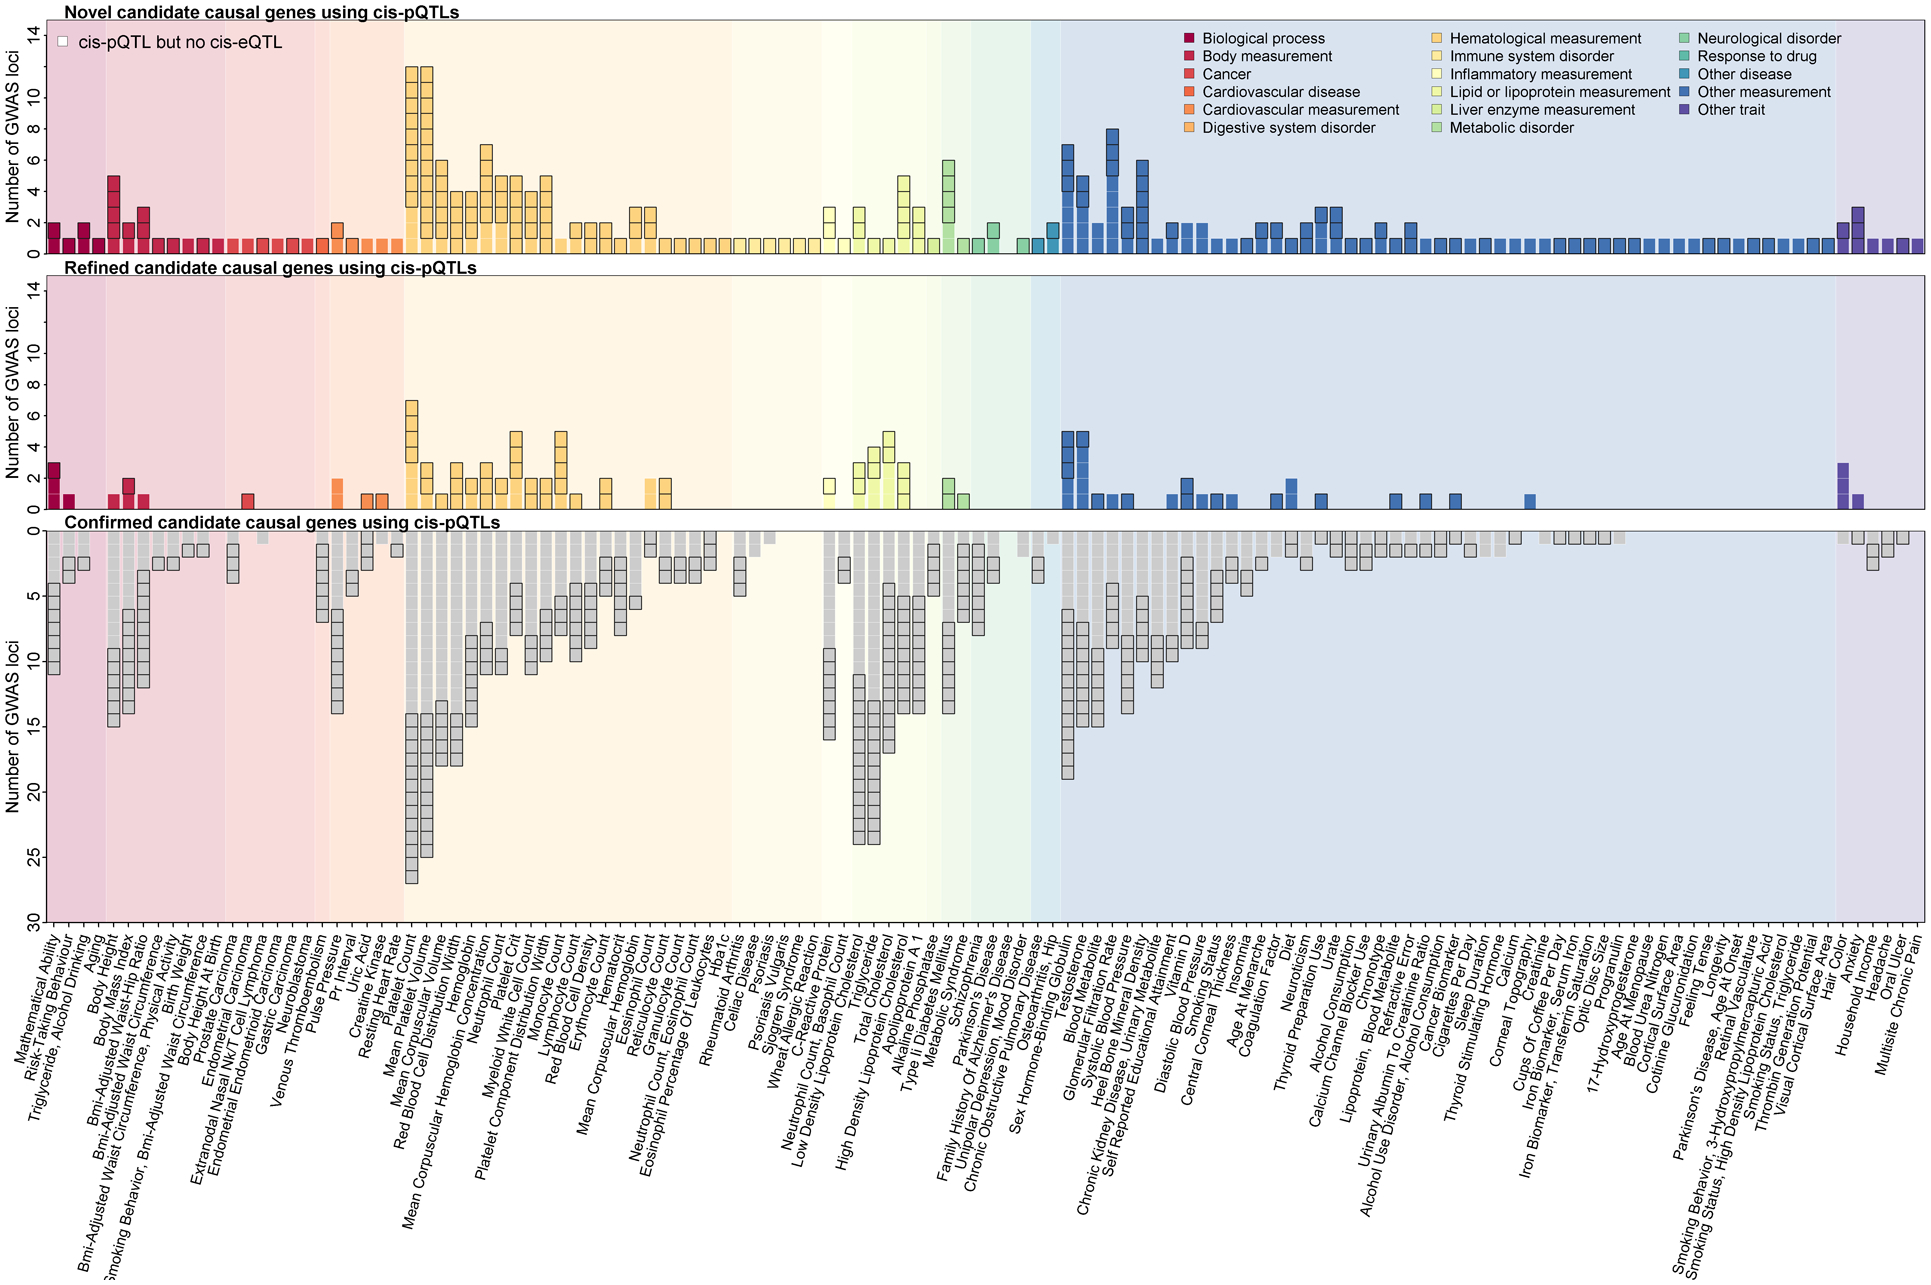
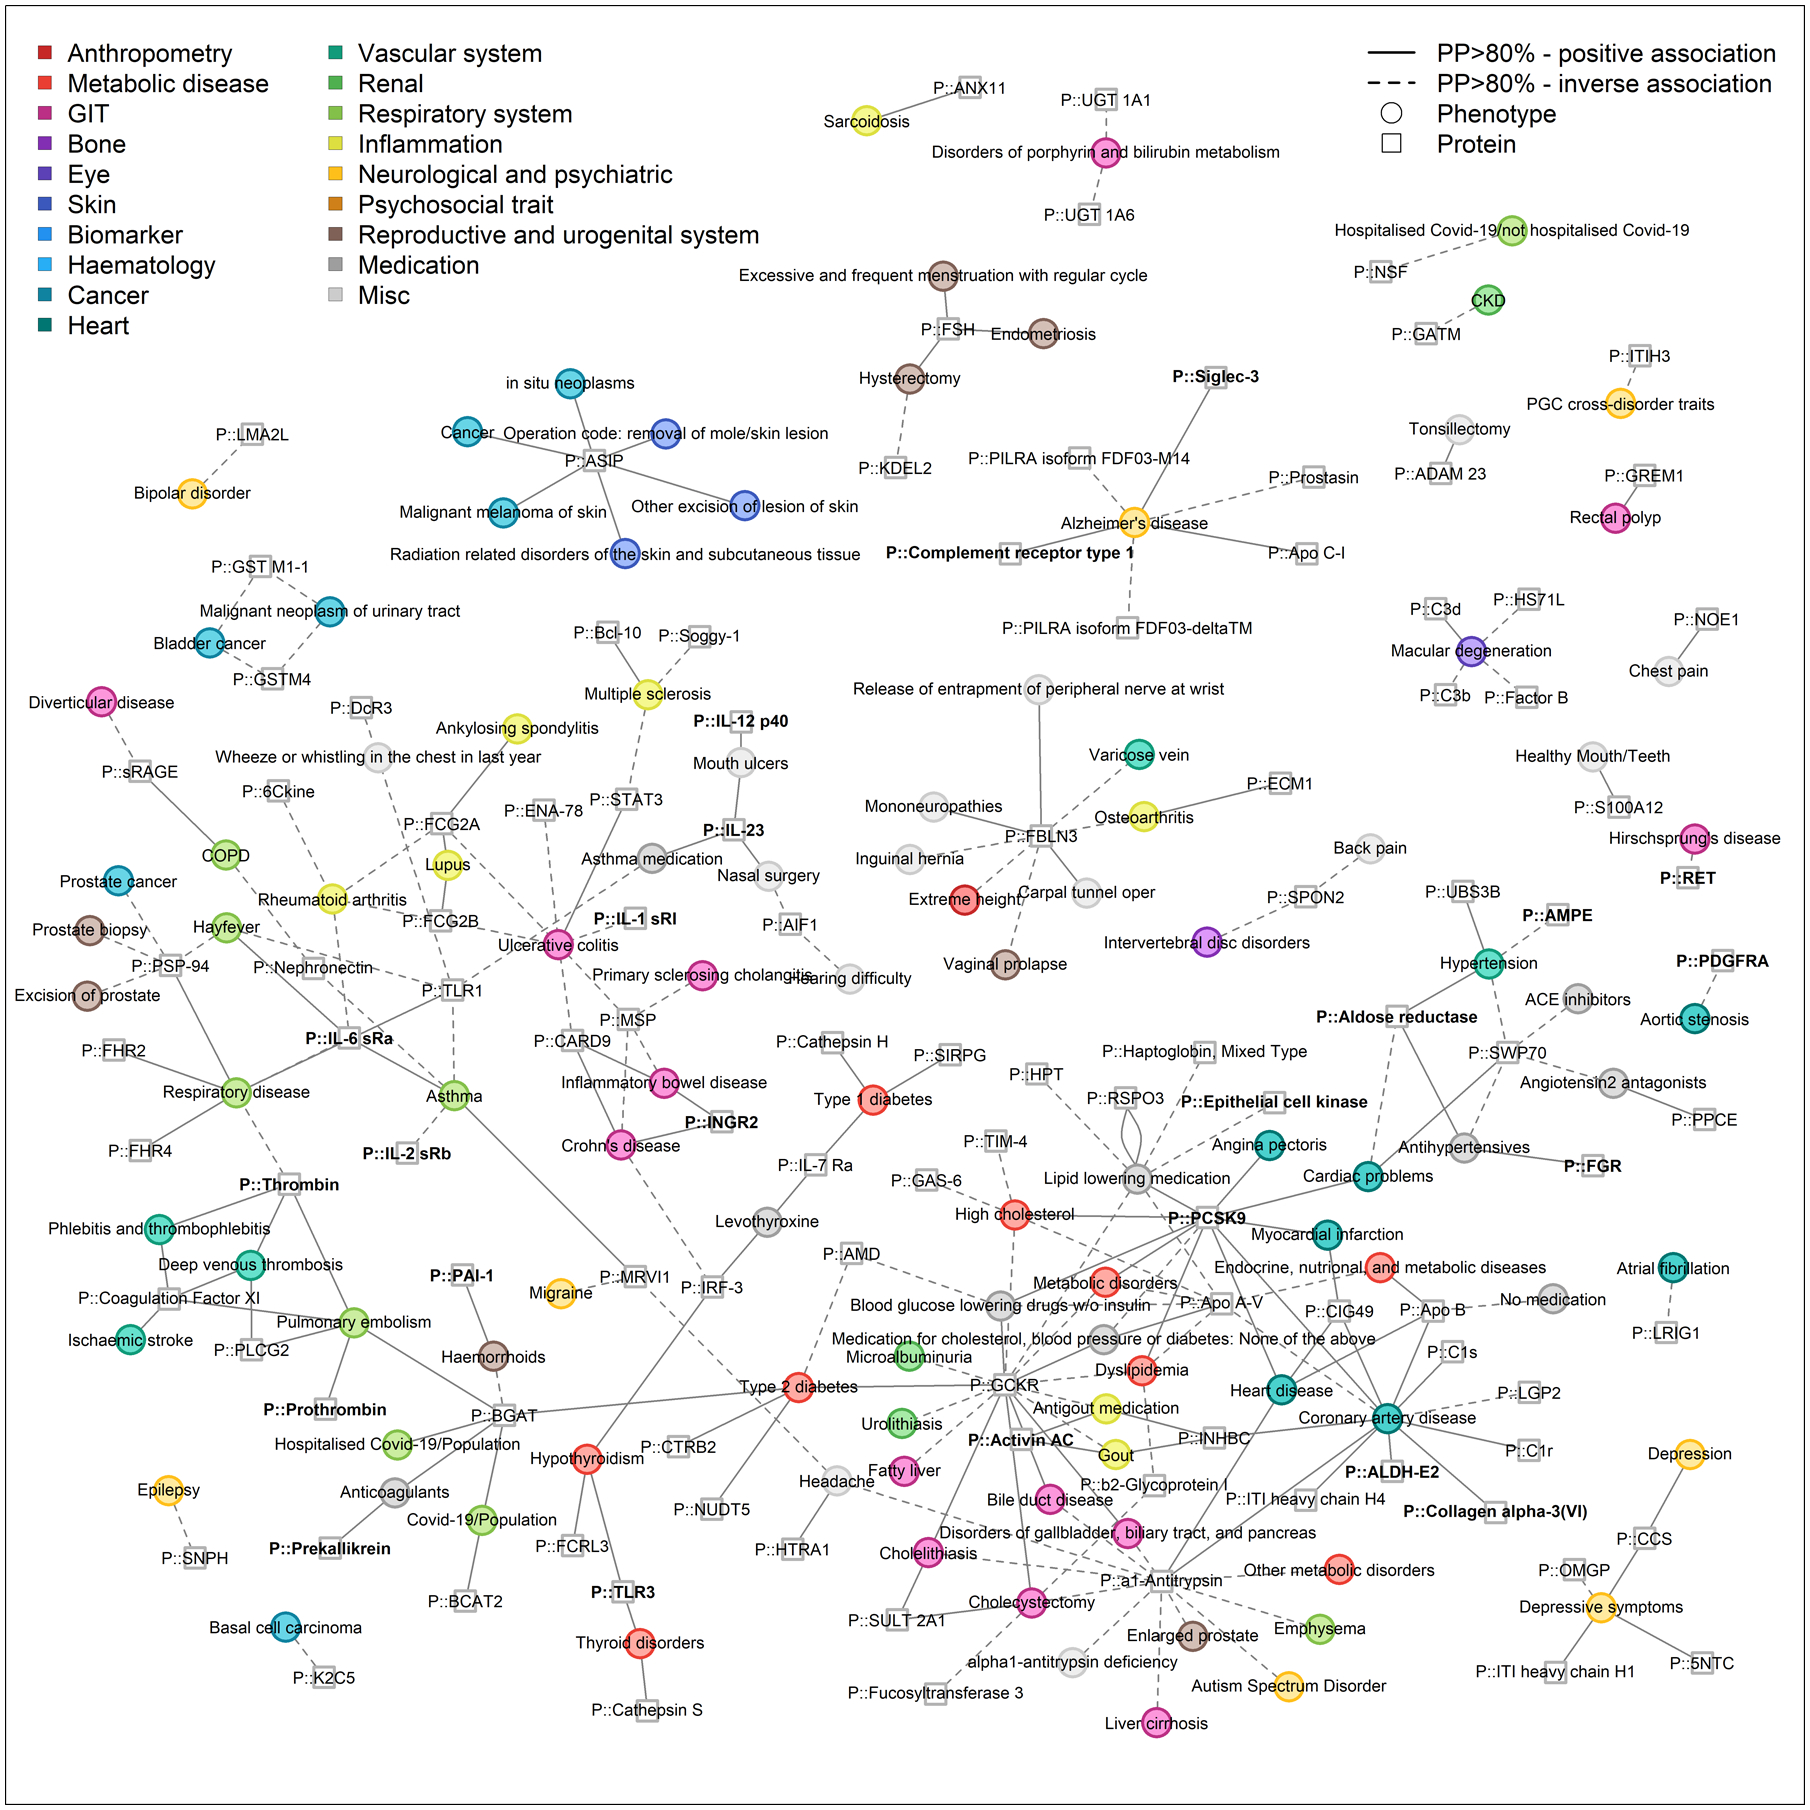
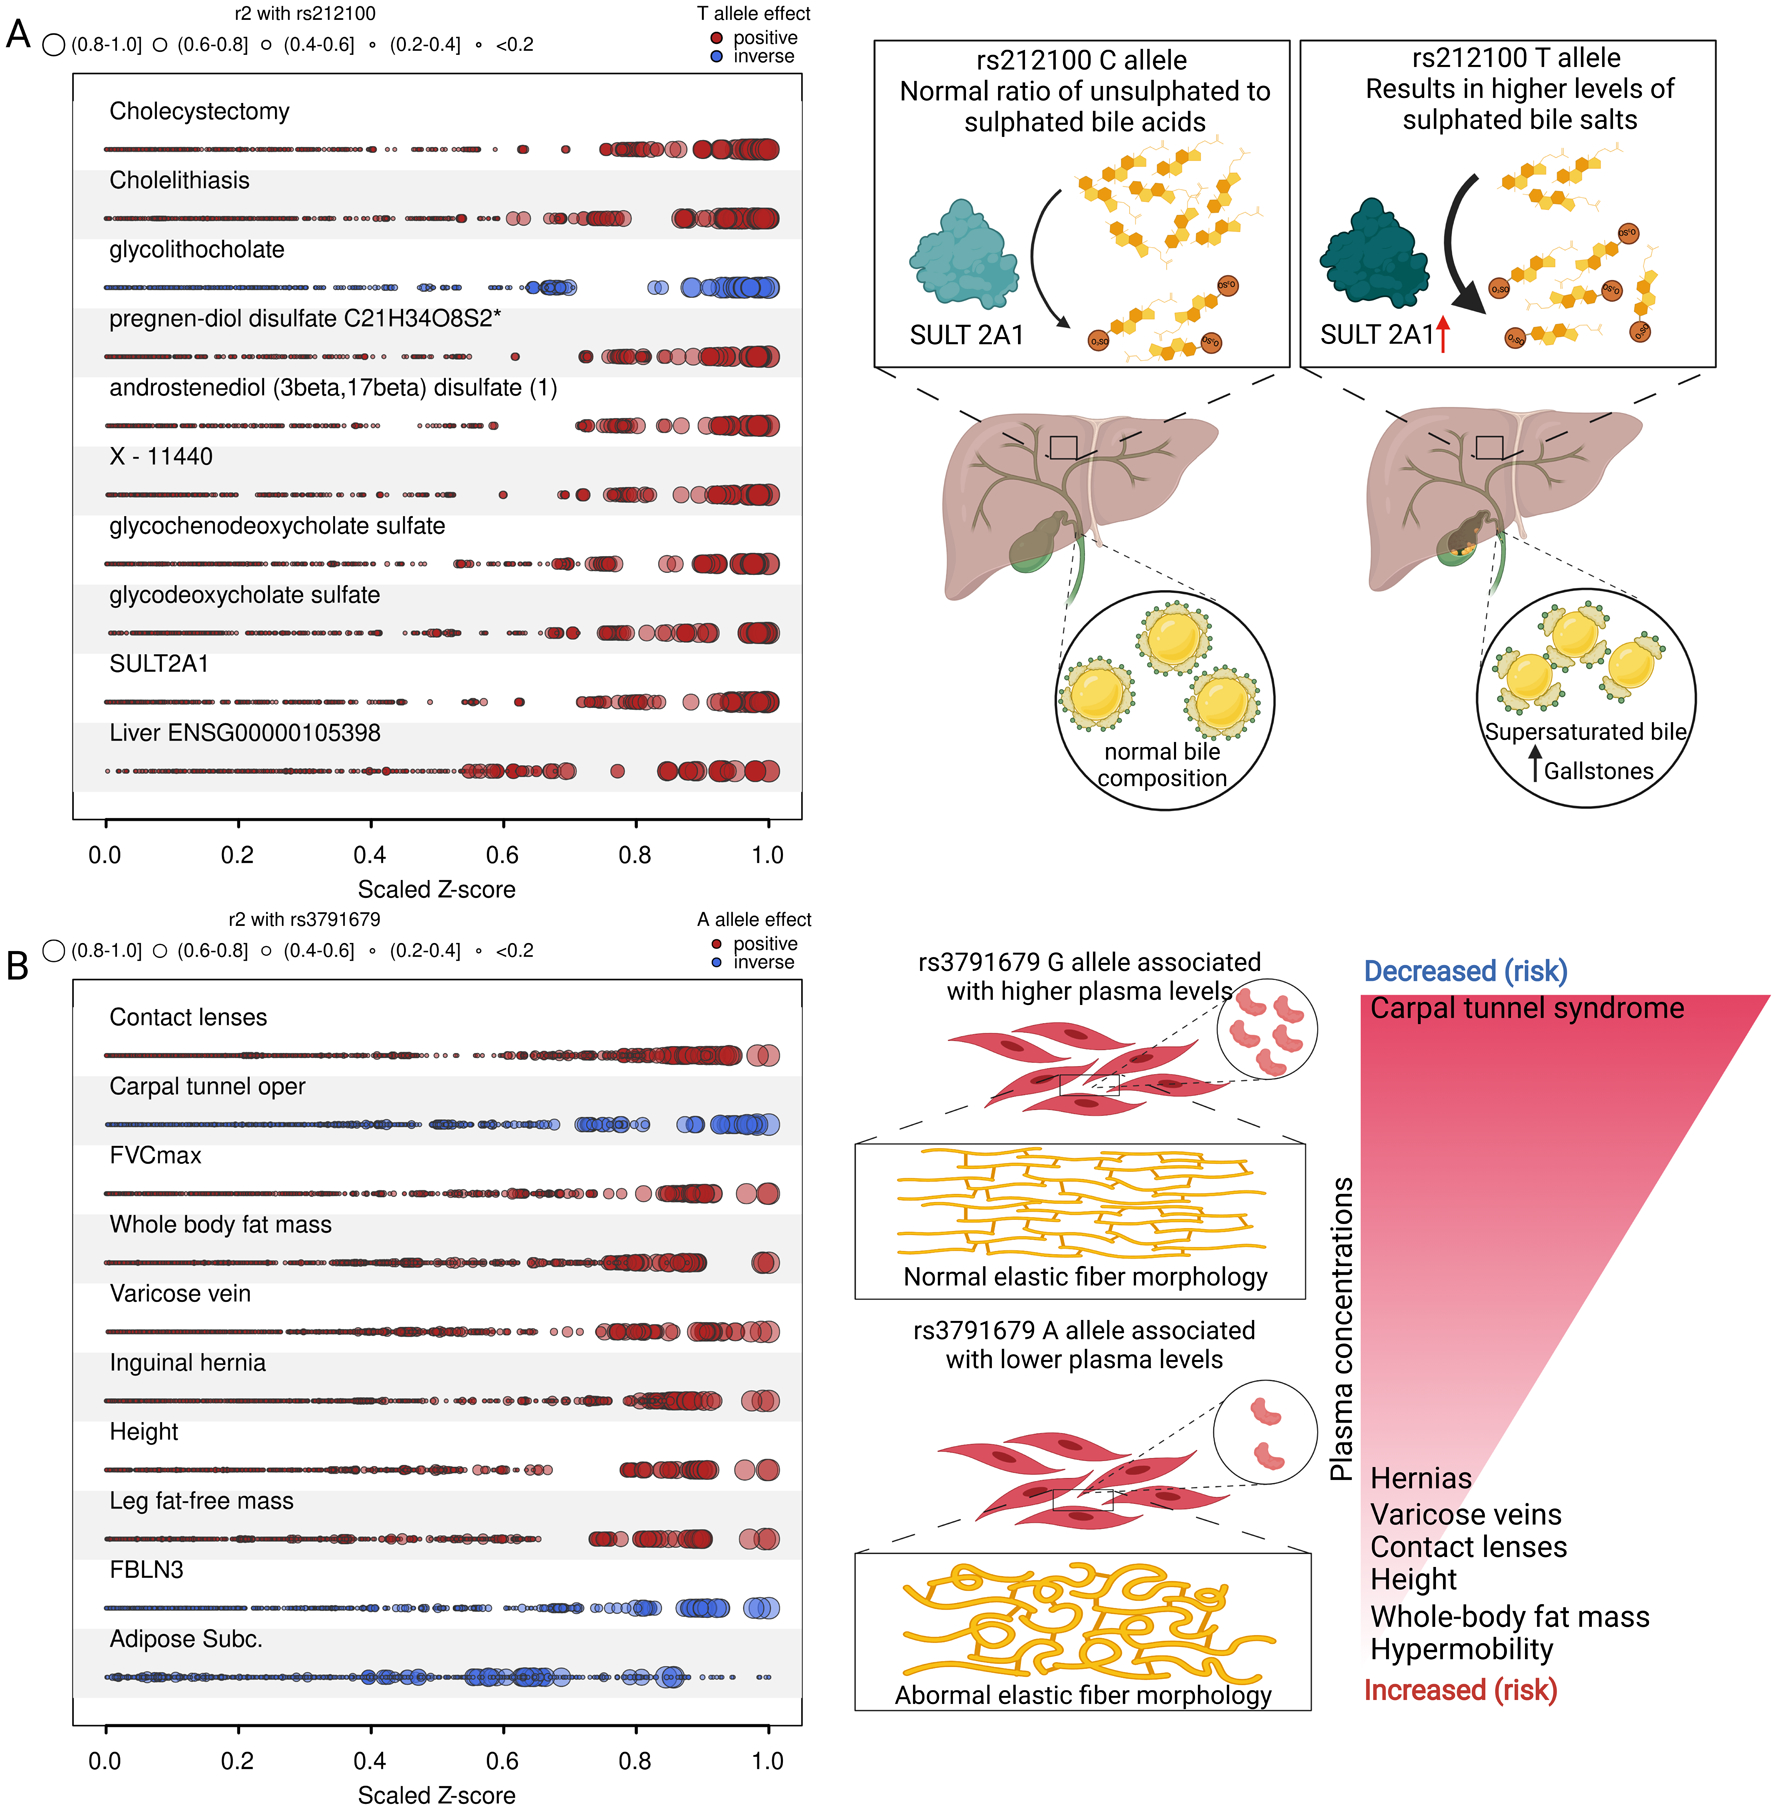
Characterization of the genetic regulation of proteins is essential for understanding disease etiology and developing therapies. We identified 10,674 genetic associations for 3892 plasma proteins to create a cis-anchored gene-protein-disease map of 1859 connections that highlights strong cross-disease biological convergence. This proteo-genomic map provides a framework to connect etiologically related diseases, to provide biological context for new or emerging disorders, and to integrate different biological domains to establish mechanisms for known gene-disease links. Our results identify proteo-genomic connections within and between diseases and establish the value of cis-protein variants for annotation of likely causal disease genes at loci identified in genome-wide association studies, thereby addressing a major barrier to experimental validation and clinical translation of genetic discoveries.


Conflict of interest statement

COMPETING INTERESTS

RAS and AC are current employees and/or stockholders of GlaxoSmithKline. ERG receives an honorarium from the journal Circulation Research of the American Heart Association as a member of the Editorial Board. SOR has received remuneration for consultancy services provided to Pfizer Inc, Astra Zeneca, ERX Pharmaceuticals, GSK, Third Rock Ventures and LG Life Sciences. All other authors declare that they have no competing interests.

Figures

Fig. 1
Fig. 1. Regional sentinel genetic variants associated (p<1.004×10⁻¹¹) with at least one protein target in up to 10,708 participants from the Fenland Study.
The lower panel maps the genomic locations of the genetic variants against the genomic locations of the protein-encoding genes. Genetic variants close to the protein-encoding gene (±500 kb) are highlighted in pink (cis-pQTLs) and all others are shown in blue (trans-pQTLs). Darker shades indicate more significant p-values. The upper panel shows the number of associated protein targets for each genomic region (vertical line), with circles above representing the number of approximately independent genetic variants (r2<0.1), such that larger circles indicate more genetic variants in the region.
Fig. 2
Fig. 2. Classification of protein quantitative trait loci (pQTLs, cis and trans) and subsequent partition of the explained variance in plasma abundances of protein targets
A) Bar chart of pQTL classification based on GO term mapping (blue) or community mapping in a protein network derived by Gaussian graphical modeling (GGM; orange) of associated protein targets. Darker shades indicate cis-pQTLs and lighter colors trans-pQTLs. B) Data-driven protein network colored according to 191 identified protein communities. C) a community-specific pQTL (PNPLA3) that was not captured by GO term mapping. Gene annotation as reported in the Materials and Methods. D) Absolute (upper panel) and relative (lower panel) explained variance in plasma abundances of protein targets by identified pQTLs. Coloring indicates contribution of the lead cis-pQTL (orange), secondary cis-pQTLs (yellow), protein- or pathway-specific trans-pQTLs (blue), and unspecific trans-pQTLs (green). Protein targets have been grouped by underlying genetic architecture as: mostly explained by cis-pQTLs (‘cis-determined’), mostly explained by specific trans-pQTLs (‘specific trans’), and mostly explained by unspecific trans-pQTLs (‘unspecific trans’). The inset displays the overall distribution of explained variance by each of the four categories. The variance explained was computed using linear regression models. A graphical display of effect size distributions can be found in Fig. S3.
Fig. 3
Fig. 3. Integration of gene and splicing quantitative trait loci (eQTLs and sQTLs).
A) Protein targets ordered by the number of tissues for which at least one of the cis-pQTLs was also a cis-eQTL as determined by statistical colocalization (posterior probability >80% for a shared signal). Protein targets for which the eQTL showed evidence for a tissue-specific effect are indicated by black vertical lines underneath. B) Same as A) but considering cis-sQTLs.
Fig. 4
Fig. 4. Causal gene assignment for associations reported in the GWAS catalog using identified cis-pQTLs.
Each panel displays the number of loci that have been reported in the GWAS catalog for a curated phenotype and were identified as protein quantitative trait in close proximity (±500 kb) to the protein-encoding gene (cis-pQTL) in the current study. Mapping of GWAS loci and cis-pQTLs was done using the LD between the reported variants (r2>0.8). The upper panel displays the number of GWAS loci for which cis-pQTLs provided candidate causal genes. The middle panel displays the number of GWAS loci for which cis-pQTLs refined the list of candidate causal genes at the locus. The lower panel displays the number of GWAS loci with confirmative evidence from cis-pQTLs for already assigned candidate causal genes. Examples where gene prioritization was facilitated through pQTL but not gene expression QTL (eQTL) evidence are highlighted by a border around the box. Colors represent broad trait categories.
Fig. 5
Fig. 5. Network representation of phenome-wide colocalization analysis for protein-encoding loci.
This figure is restricted to connections between proteins and binary endpoints, mainly diseases, to increase visibility and show shared etiology. Only protein targets and phenotypes with at least one connection are included. Effect directions are indicated by the line type (solid = higher protein abundance, increased risk, dashed = higher protein abundance, reduced risk). Colors indicate categories of phenotypes. The entire network is composed of 412 protein targets (squares) and 506 phenotypes (circles) as nodes, which are connected (n=1,859 edges) if there is evidence of a shared genetic signal (posterior probability >80%) and is shown in Fig. S6. An interactive version of the figure can be found at www.omicscience.org/apps/pgwas.
Fig. 6
Fig. 6. Selected phenotypic examples from the proteogenomic map.
A) Plot visualizing convergence of genetic variants at the SULT2A1 locus in relation to the LD with the candidate gene variant identified by multi-trait colocalization. Z-scores from GWAS for each annotated trait have been scaled by the absolute maximum, and dot size is proportional to the LD (r2). Colors indicate the direction of effect aligned to the risk-increasing allele (red – positive, blue - inverse). The scheme on the right depicts the suggested mode of action by which higher SULT2A1 activity translates to higher risk of gallstones. B) Same as A, but for diseases and other phenotypes colocalizing at the EFEMP1 locus. The scheme on the right depicts a proposed mechanism by which altered secretion of FBLN3 leads to the observed phenotypes. Stacked regional association plots for A and B can be found in Figs. S9 and S10.

References

    1. Emilsson V, Ilkov M, Lamb JR, Finkel N, Gudmundsson EF, Pitts R, Hoover H, Gudmundsdottir V, Horman SR, Aspelund T, Shu L, Trifonov V, Sigurdsson S, Manolescu A, Zhu J, Olafsson Ö, Jakobsdottir J, Lesley SA, To J, Zhang J, Harris TB, Launer LJ, Zhang B, Eiriksdottir G, Yang X, Orth AP, Jennings LL, Gudnason V, Co-regulatory networks of human serum proteins link genetics to disease. Science 361, 769–773 (2018). - PMC - PubMed
    1. Suhre K, Arnold M, Bhagwat AM, Cotton RJ, Engelke R, Raffler J, Sarwath H, Thareja G, Wahl A, Delisle RK, Gold L, Pezer M, Lauc G, Selim MAED, Mook-Kanamori DO, Al-Dous EK, Mohamoud YA, Malek J, Strauch K, Grallert H, Peters A, Kastenmüller G, Gieger C, Graumann J, Connecting genetic risk to disease end points through the human blood plasma proteome. Nat. Commun 8 (2017), doi:10.1038/ncomms14357. - DOI - PMC - PubMed
    1. Folkersen L, Fauman E, Sabater-Lleal M, Strawbridge RJ, Frånberg M, Sennblad B, Baldassarre D, Veglia F, Humphries SE, Rauramaa R, de Faire U, Smit AJ, Giral P, Kurl S, Mannarino E, Enroth S, Johansson Å, Enroth SB, Gustafsson S, Lind L, Lindgren C, Morris AP, Giedraitis V, Silveira A, Franco-Cereceda A, Tremoli E, IMPROVE study group, Gyllensten U, Ingelsson E, Brunak S, Eriksson P, Ziemek D, Hamsten A, Mälarstig A, Mapping of 79 loci for 83 plasma protein biomarkers in cardiovascular disease. PLoS Genet 13, e1006706 (2017). - PMC - PubMed
    1. Sun BB, Maranville JC, Peters JE, Stacey D, Staley JR, Blackshaw J, Burgess S, Jiang T, Paige E, Surendran P, Oliver-Williams C, Kamat MA, Prins BP, Wilcox SK, Zimmerman ES, Chi A, Bansal N, Spain SL, Wood AM, Morrell NW, Bradley JR, Janjic N, Roberts DJ, Ouwehand WH, Todd JA, Soranzo N, Suhre K, Paul DS, Fox CS, Plenge RM, Danesh J, Runz H, Butterworth AS, Genomic atlas of the human plasma proteome. Nature 558, 73–79 (2018). - PMC - PubMed
    1. Yao C, Chen G, Song C, Keefe J, Mendelson M, Huan T, Sun BB, Laser A, Maranville JC, Wu H, Ho JE, Courchesne P, Lyass A, Larson MG, Gieger C, Graumann J, Johnson AD, Danesh J, Runz H, Hwang S-JJ, Liu C, Butterworth AS, Suhre K, Levy D, Genome‐wide mapping of plasma protein QTLs identifies putatively causal genes and pathways for cardiovascular disease. Nat. Commun 9, 3268 (2018). - PMC - PubMed

Publication types

MeSH terms